Sample Category Title
USD/JPY Mid-Day Outlook
Daily Pivots: (S1) 146.37; (P) 146.80; (R1) 147.40; More...
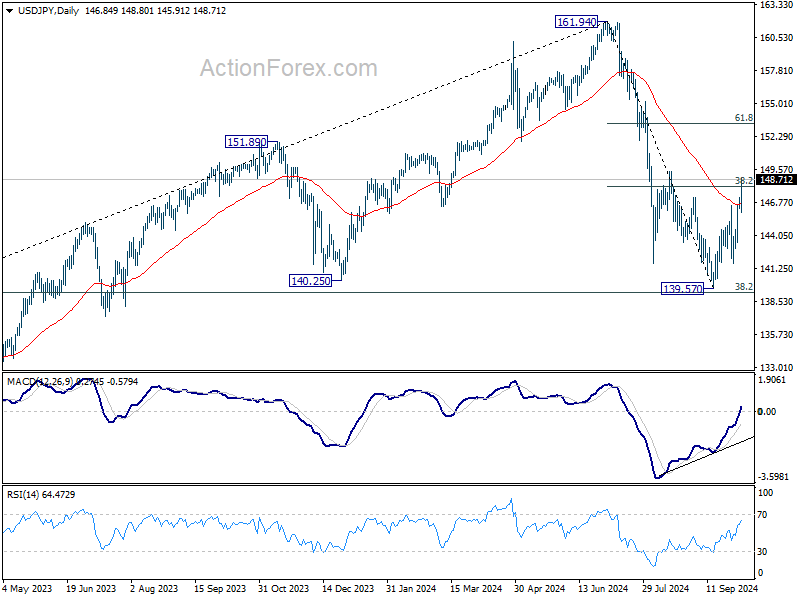
USD/JPY's rise from 139.57 extends higher today and intraday bias stays on the upside. The break of 38.2% retracement of 161.94 to 139.57 at 148.11 argues that whole fall from 161.95 has completed already, just ahead of 139.26 fibonacci level. Rebound from 139.67 is seen as the second leg of the corrective pattern from 161.94. Further rise should be seen to 61.8% retracement at 153.39. On the downside, below 145.91 minor support will turn intraday bias neutral again.
In the bigger picture, fall from 161.94 medium term top is seen as the first leg of the correction to whole up trend from 102.58 (2021 low). Strong support could be seen from 38.2% retracement of 102.58 to 161.94 at 139.26 to contain downside, at least on first attempt. Firm break of 149.35 resistance will indicate that the second leg has started. However, sustained break of 139.26 would open up deeper medium term decline to 61.8% retracement at 125.25.
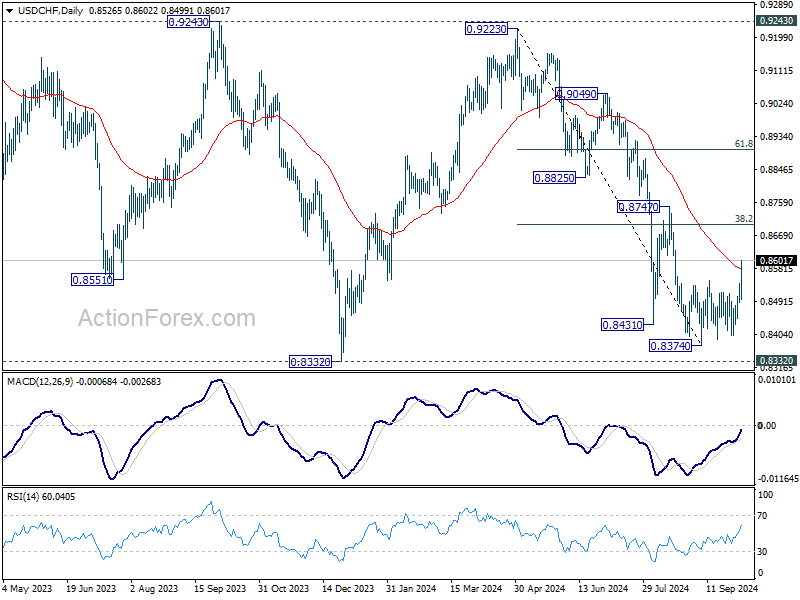
USD/CHF Mid-Day Outlook
Daily Pivots: (S1) 0.8499; (P) 0.8521; (R1) 0.8551; More…
Intraday bias in USD/CHF is now on the upside with the strong break of 0.8548 resistance. Further rise should be seen to 38.2% retracement of 0.9223 to 0.8374 at 0.8698. Sustained break there will argue that fall from 0.9223 has completed after defending 0.8332 low. On the downside, below 0.8499 minor support will turn intraday bias neutral again.
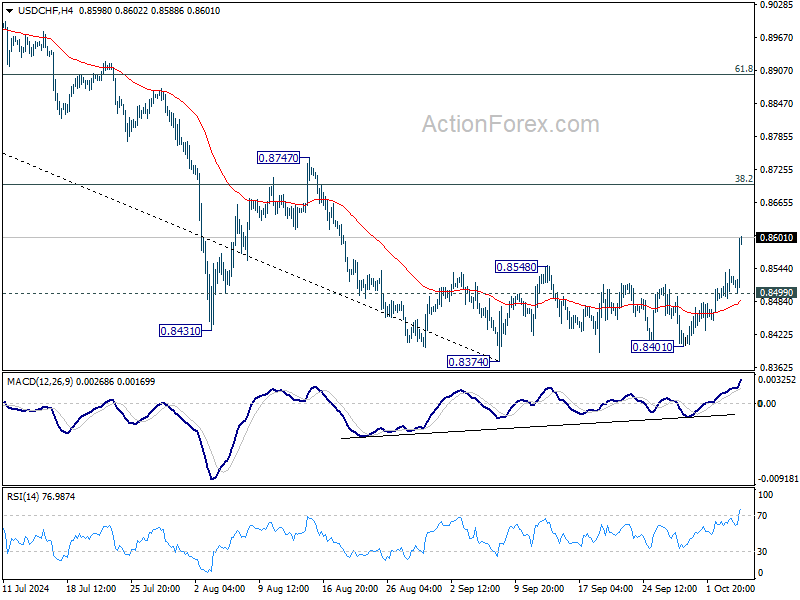
In the bigger picture, price actions from 0.8332 (2023 low) are currently seen as a medium term corrective pattern, with fall from 0.9223 as the second leg. Strong support could be seen from 0.8332 to bring rebound. Yet, overall outlook will continue to stay bearish as long as 0.9243 resistance holds. Firm break of 0.8332, however, will resume larger down trend from 1.0146 (2022 high).
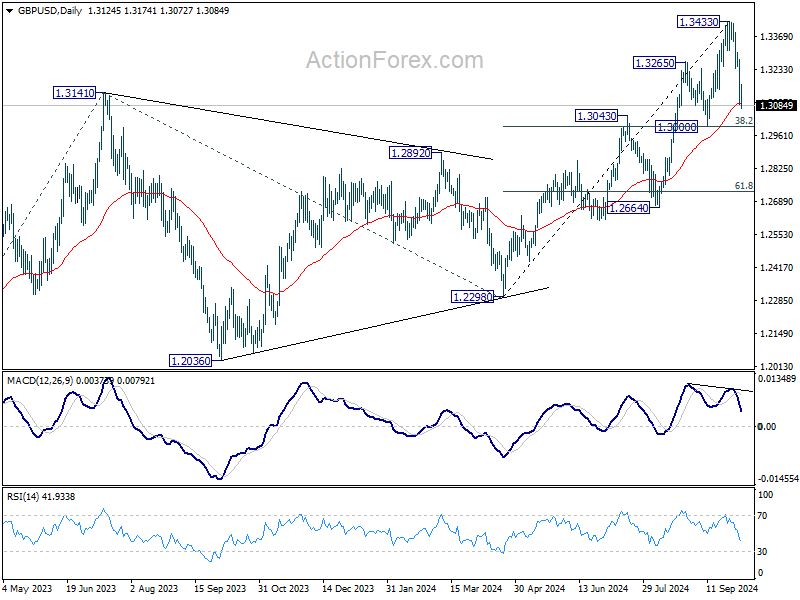
GBP/USD Mid-Day Outlook
Daily Pivots: (S1) 1.3050; (P) 1.3166; (R1) 1.3241; More...
Intraday bias in GBP/USD remains on the downside as pullback from 1.3433 short term top is progress. Deeper decline would be seen, but strong support is expected from 1.3000 cluster (38.2% retracement of 1.2298 to 1.3433 at 1.2999 to bring rebound. On the upside, above 1.3174 minor resistance will turn intraday bias neutral first.
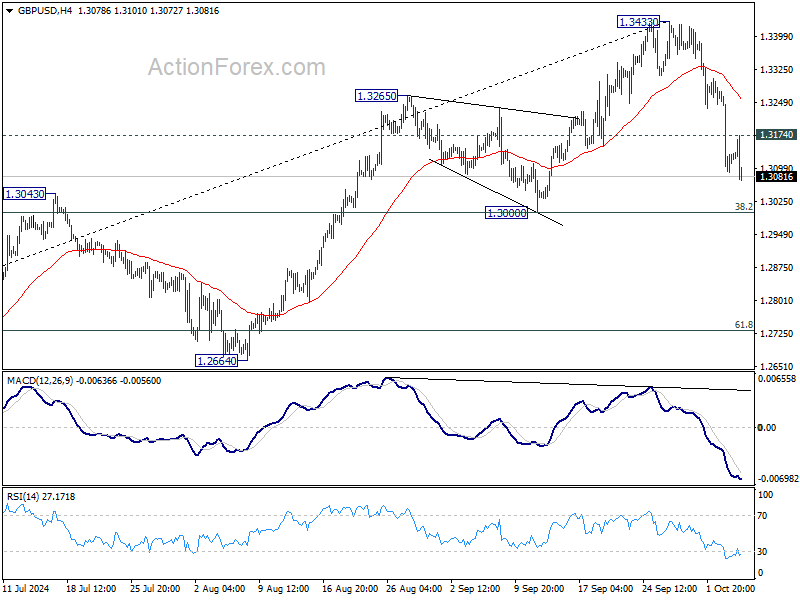
In the bigger picture, up trend from 1.0351 (2022 low) is in progress. Next target is 61.8% projection of 1.0351 to 1.3141 from 1.2298 at 1.4022. For now, outlook will stay bullish as long as 1.3000 support holds, even in case of deep pullback.
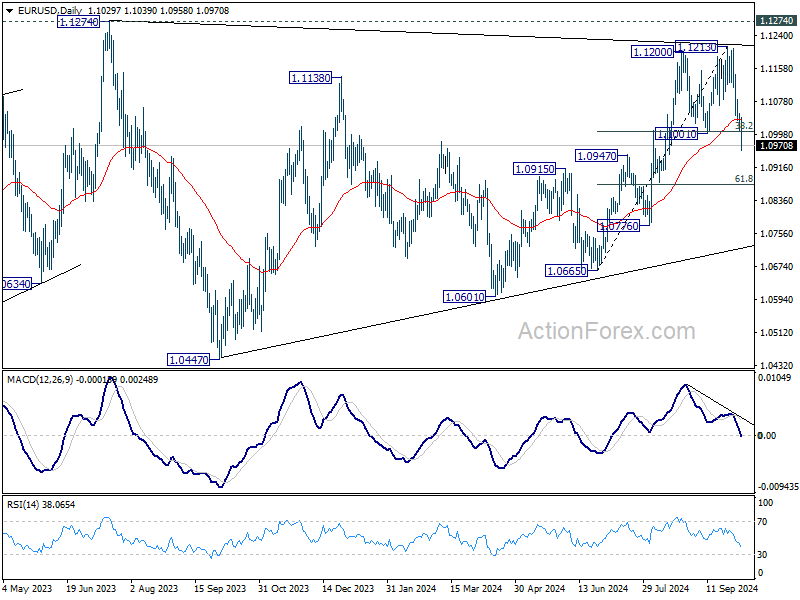
EUR/USD Mid-Day Outlook
Daily Pivots: (S1) 1.1008; (P) 1.1030; (R1) 1.1052; More....
EUR/USD's break of 1.1001 cluster support (38.2% retracement of 1.0665 to 1.1213 at 1.1004) argues that whole rally from 1.0665 has completed at 1.1213. Intraday bias is back on the downside for 61.8% retracement at 1.0874 and possibly below. On the upside, above 1.1039 minor resistance will turn intraday bias neutral first.
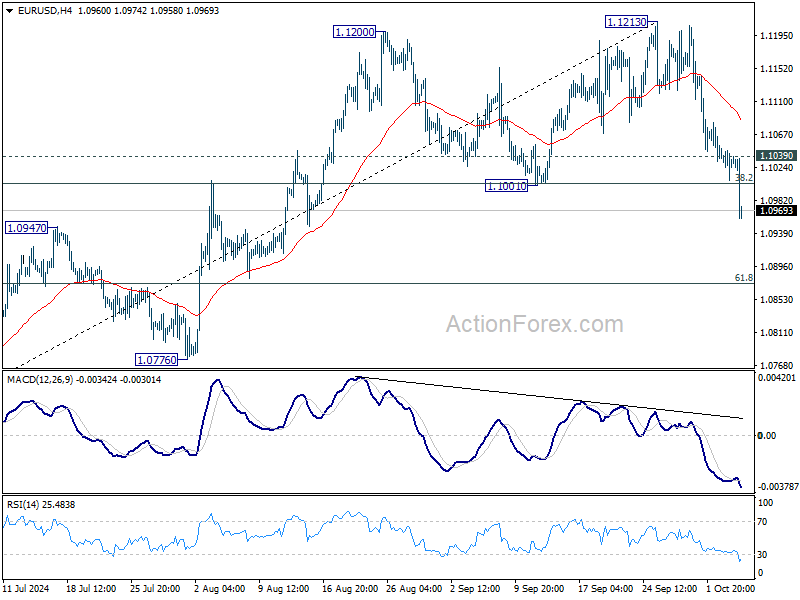
In the bigger picture, rejection by 1.1274 resistance suggests that corrective pattern from 1.1274 (2023 high) is not completed yet. Instead, decline from 1.1213 might be another falling leg. Sustained break of 55 W EMA (now at 1.0877) will validate this case, and bring deeper fall towards 1.0447 support again.
Dollar Jumps after Strong NFP, Traders Abandon Bets on 50bps Fed Cut
Dollar surged across the board during early US trading after the all-around stronger-than-expected non-farm payroll report. The data showed much higher-than-anticipated job growth, a slight decrease in unemployment rate, and an acceleration in wage growth. This robust set of figures has led traders to largely abandon bets on a 50bps rate cut by Fed in November. Fed funds futures now reflect nearly a 90% probability of a 25bps cut instead.
Meanwhile, stock investors seem unfazed by the reduced chances of a larger rate cut. Stock futures climbed as investors welcomed the strong jobs growth, while bond markets saw an outflow of funds, pushing 10-year yield past 3.9% level and heading toward 4%.
Overall in the forex markets, Yen is currently the day’s worst performer, weighed down further by surging bond yields. New Zealand Dollar follows as the second weakest, with Swiss Franc also losing ground. Meanwhile, British Pound is the second strongest, boosted by BoE Chief Economist Huw Pill’s call for caution on fast rate cuts. Canadian Dollar comes in third, with Euro and Australian Dollar positioned in the middle.
In Europe, at the time of writing, FTSE is down -0.09%. DAX is up 0.69%. CAC is up 1.18%. UK 10-year yield is up 0.110 at 4.133. Germany 10-year yield is up 0.076 at 2.228. Earlier in Asia, Nikkei rose 0.22%. Hong Kong HSI rose 2.82%. China was still on holiday. Singapore Strait Times rose 0.33%. Japan 10-year JGB yield rose 0.0584 to 0.886.
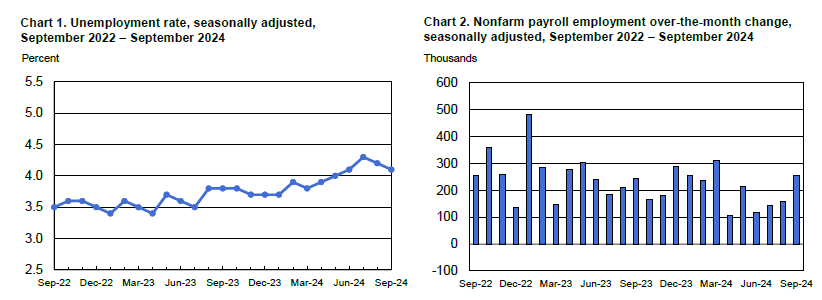
US NFP jobs grow 254k in Sep, unemployment rate dips to 4.1%
US non-farm payroll employment grew 254k in September, well above expectation of 147k. That's also higher than average monthly gain of 203k over the prior 12 months.
Unemployment rate ticked down from 4.2% to 4.1%, below expectation of 4.2%. Labor force participation rate was unchanged at 62.7%.
Average hourly earnings rose 0.4% mom, above expectation of 0.3% mom. Annual average hourly earnings growth accelerated from 3.9% yoy to 4.0% yoy.
BoE’s Pill warns against cutting rates too quickly
In a speech today, Bank of England Chief Economist Huw Pill urged "caution in" reducing monetary policy restrictions, emphasizing the need for a "gradual" approach to rate cuts.
Pill highlighted that his "modal outlook" aligns with a scenario of "continued disinflation," but warned that this depends on maintaining a "restrictive monetary policy stance to bear down on inflationary pressures."
He stressed the importance of caution, noting there is still "ample reason" to carefully assess whether inflationary persistence is fully dissipating. While further reductions in the Bank Rate are expected if the economic and inflation outlook remains on track, Pill warned against the risk of "cutting rates either too far or too fast."
Pill was one of the four dissenting members of the MPC who voted against BoE's rate cut in August, underscoring his preference for a more measured approach in unwinding monetary tightening.
EUR/USD Mid-Day Outlook
Daily Pivots: (S1) 1.1008; (P) 1.1030; (R1) 1.1052; More....
EUR/USD's break of 1.1001 cluster support (38.2% retracement of 1.0665 to 1.1213 at 1.1004) argues that whole rally from 1.0665 has completed at 1.1213. Intraday bias is back on the downside for 61.8% retracement at 1.0874 and possibly below. On the upside, above 1.1039 minor resistance will turn intraday bias neutral first.
In the bigger picture, rejection by 1.1274 resistance suggests that corrective pattern from 1.1274 (2023 high) is not completed yet. Instead, decline from 1.1213 might be another falling leg. Sustained break of 55 W EMA (now at 1.0877) will validate this case, and bring deeper fall towards 1.0447 support again.
US NFP jobs grow 254k in Sep, unemployment rate dips to 4.1%
US non-farm payroll employment grew 254k in September, well above expectation of 147k. That's also higher than average monthly gain of 203k over the prior 12 months.
Unemployment rate ticked down from 4.2% to 4.1%, below expectation of 4.2%. Labor force participation rate was unchanged at 62.7%.
Average hourly earnings rose 0.4% mom, above expectation of 0.3% mom. Annual average hourly earnings growth accelerated from 3.9% yoy to 4.0% yoy.
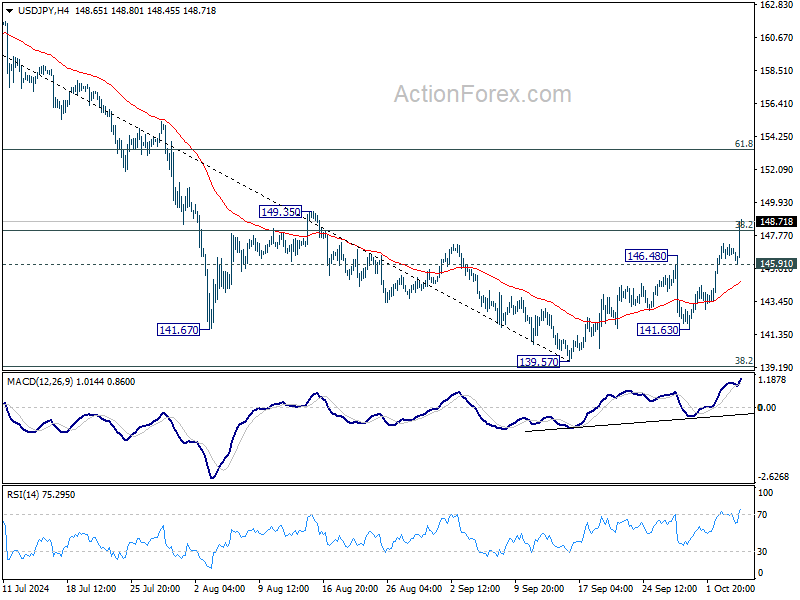
USD/JPY Technical: Recent Mean Reversion Eebound in US Dollar Strength May Have Hit a Ceiling
- The recent week of Japanese yen weakness is likely driven by “political jawboning”
- The current jump in the JPY implied volatility index has reached an overstretched condition that suggests a potential pause in the recent USD/JPY’s up move.
- A break below 143.60 intermediate support on the USD/JPY may trigger renew weakness.
Since our prior publication, the price actions of USD/JPY have shaped the expected mean reversion rebound and hit the lower limit of the 146.90/149.30 key medium-term resistance zone (printed a high of 147.24 on Thursday, 3 October).
The USD/JPY rebounded by 5.5% (766 pips) from its 16 September low of 139.58 to its 3 October high and on Wednesday, 2 October, its daily gain of 2% was the most on record in the past two years.
Political jawboning led to the recent JPY weakness
The recent week of Japanese yen weakness has been primarily driven by “political jawboning” rather than a major change in Japan and the US macro drivers.
The newly elected Liberal Democratic Party leader and Japanese Prime Minister Shigeru Ishiba, a known supporter of higher interest rates to boost Japan Inc’s profitability has “abruptly’ reversed his preference to advocate an accommodative monetary policy in a press interview conducted on Sunday, 29 September.
In addition, after his meet-up with the Bank of Japan (BoJ) Governor Ueda on Wednesday, 2 October, Ishiba reiterated to the media that Japan is not in a conducive environment for additional interest rate increases.
The main reason for Japanese Prime Minister Ishiba’s current dovish stance on monetary policy is likely to be seeking for a higher chance of winning the electorate’s support for his Liberal Democratic Party in the upcoming 27 October snap election.
Technical factors are suggesting a potential pause in JPY weakness
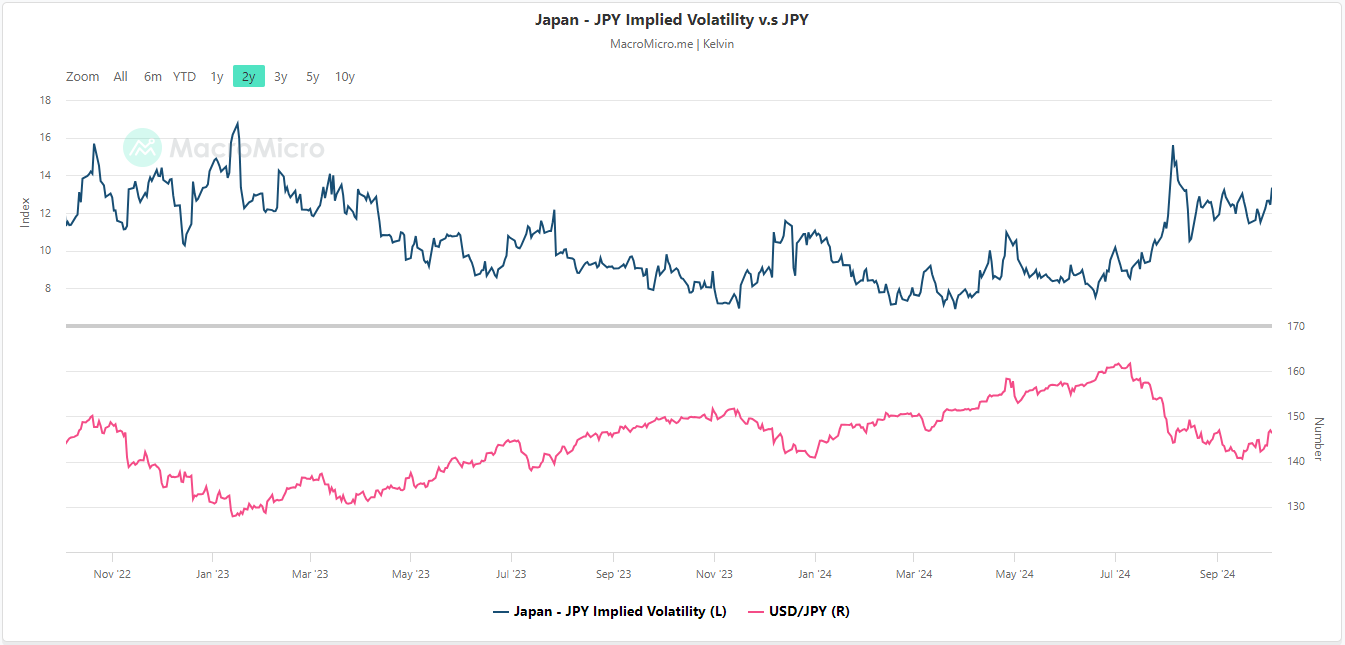
Fig 1: JPY implied volatility index with USD/JPY as of 4 Oct 2024 (Source: Macro Micro, click to enlarge chart)
The JPY implied volatility index has staged a steep push-up from 11.51 last Friday, 27 Friday to a current level of 13.34 at this time of the writing and broke above the recent peak of 13.22 printed on 5 September (see Fig 1).
Hence, the movement depicted in the JPY implied volatility index suggests that the recent corresponding bounce seen in the USD/JPY over the same period is likely to have reached an overstretched condition that in turn may reduce the odds of a further upside movement at this juncture.
Daily RSI of USD/JPY has flashed out a bearish condition
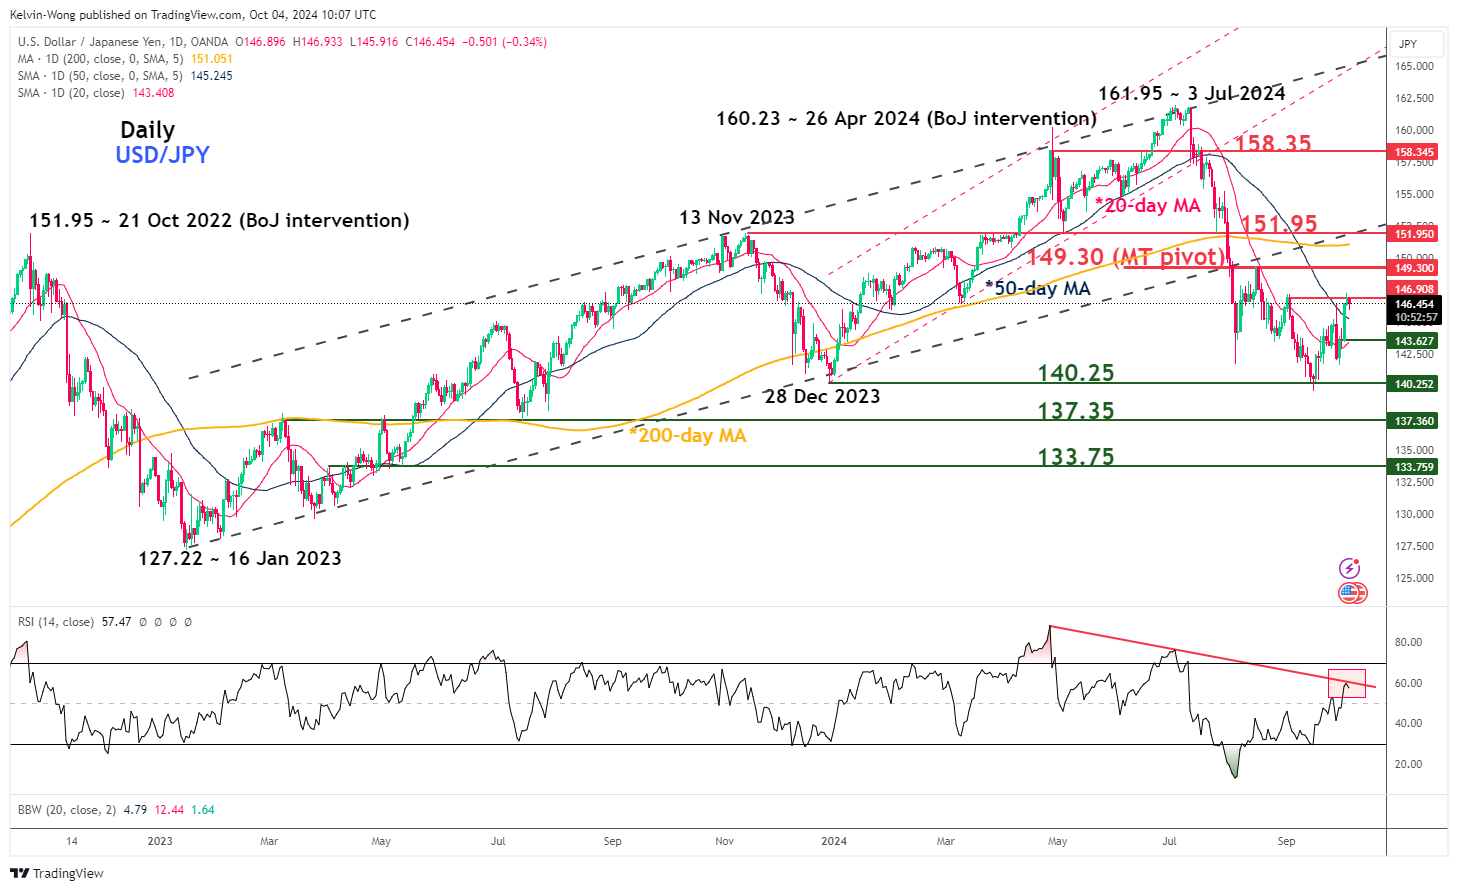
Fig 2: USD/JPY medium-term trend as of 4 Oct 2024 (Source: TradingView, click to enlarge chart)
The daily RSI momentum indicator of the USD/JPY has staged an intraday bearish reaction right at a corresponding trendline resistance in place since 26 April 2024 which suggests a potential pause in the upside momentum of the recent price actions rally from 30 September to 3 October (see Fig 2).
A break with a daily close below 143.60 key intermediate support (also the 20-day moving average) may trigger a new potential impulsive downside sequence of its medium-term downtrend phase to expose the medium-term supports at 140.25, and 137.35 in the first step.
On the other hand, a clearance above 149.30 key medium-term pivotal resistance invalidates the bearish scenario for an extension of the mean reversion rebound for the next medium-term resistance to come in at 151.95 (also close to the 200-day moving average).
NFP Preview – US Jobs Report and Potential Impact on S&P 500
- US Non-Farm Payroll (NFP) data release is highly anticipated amidst shifting expectations of a Fed rate cut.
- Market predictions for the NFP report vary, with analysts split on expected figures.
- S&P 500 technical analysis reveals a bullish triangle pattern, will the bulls finish the week strong?
NFP Preview: What to Expect
Market participants are waiting on today’s jobs report from the US in a week that has seen geopolitical risk take hold of market sentiment. The Iranian attack on Israel which came without much warning really seemed to spook markets and continues to play a role in Oil and Gold prices in particular. This begs the question… will the jobs report be overshadowed by the geopolitical risk?
Heading into the jobs report and market expectations have seen a significant shift this week following pushback from Fed Chair Powell and others around another 50 bps cut in November. This has seen markets aggressively price in a 25 bps cut which has led to a revival of sorts for the US Dollar.
The expected payroll figure is 150k, but more attention should be given to the unemployment rate, which is anticipated to remain steady at 4.2%. A slight miss of these expected figures is unlikely to change the Fed outlook but could lead to some short term spikes across a host of markets.
The data is likely to face scrutiny given that we have seen 16 of the last 19 job reports face a downward revision. This is unprecedented as the 2008 financial crisis did not result in as many downgrades as we have seen this year. Analysts already seem to be split on the print they expect, with UBS and Goldman Sachs predicting 180k and 165k respectively. Kalshi and Factset however are on the more moderate end of the prediction scale, eyeing a print of 148k and 140k respectively.
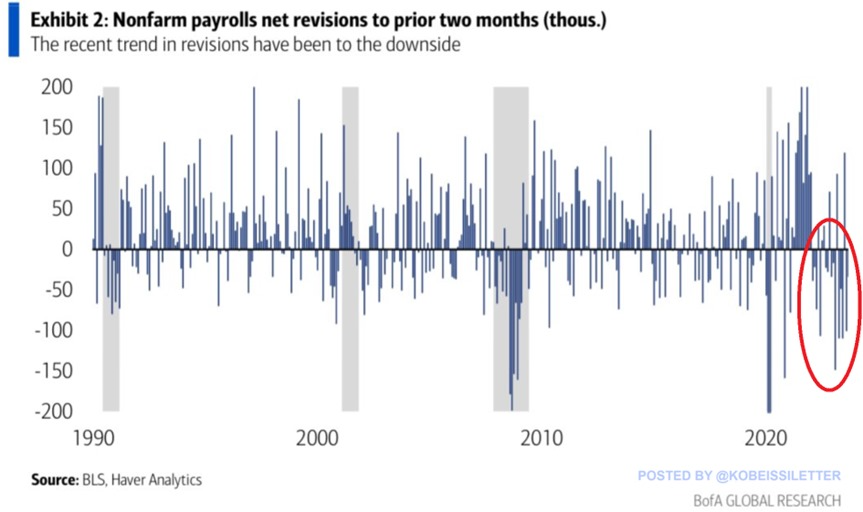
Source: BLS, Haver Analytics, BofA Research, Kobeissi Letter
My takeaway from all of this is that we would need to see a significant miss or downward revision to the jobs numbers for any significant movements to take place today. Anything else is likely to result in short-term spikes with little to no follow through.
There are a host of assets that are hovering near key areas of support and resistance which is why the NFP report is still being closely watched. The US Dollar Index (DXY), EUR/USD, GBP/USD and Gold are among those assets trading near or at key levels.
As for US Equities, the Nasdaq 100 and S&P 500 are also near recent highs and have also retreated following Powell’s comments this week. The threat of regional war in the Middle East and potential threats to supply chains and oil prices are also keeping markets on edge.
Potential Impact on the S&P 500
Looking at the data release, I have compiled a list of what the potential impact on the S&P 500 could be depending on the wage growth and NFP number. This is just my expectations and no guarantee that this is the reaction we may get from markets but could be a useful guide.
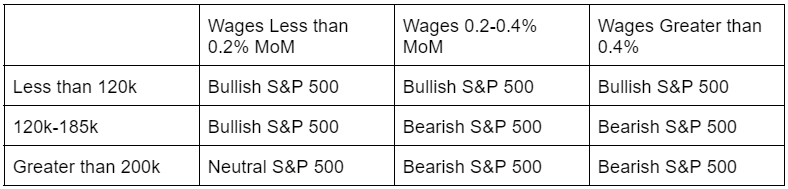
Table Created by Zain Vawda
Technical Analysis S&P 500
Looking at the S&P 500 chart below and the pullback this week has actually been a positive for potential bulls looking to get involved.
The technical triangle pattern which saw a breakout last week is still in play and following the pullback may be ready to continue its move higher. The NFP may just be the catalyst needed to give the S&P the impetus for further upside.
S&P 500 Daily Chart, October 4, 2024
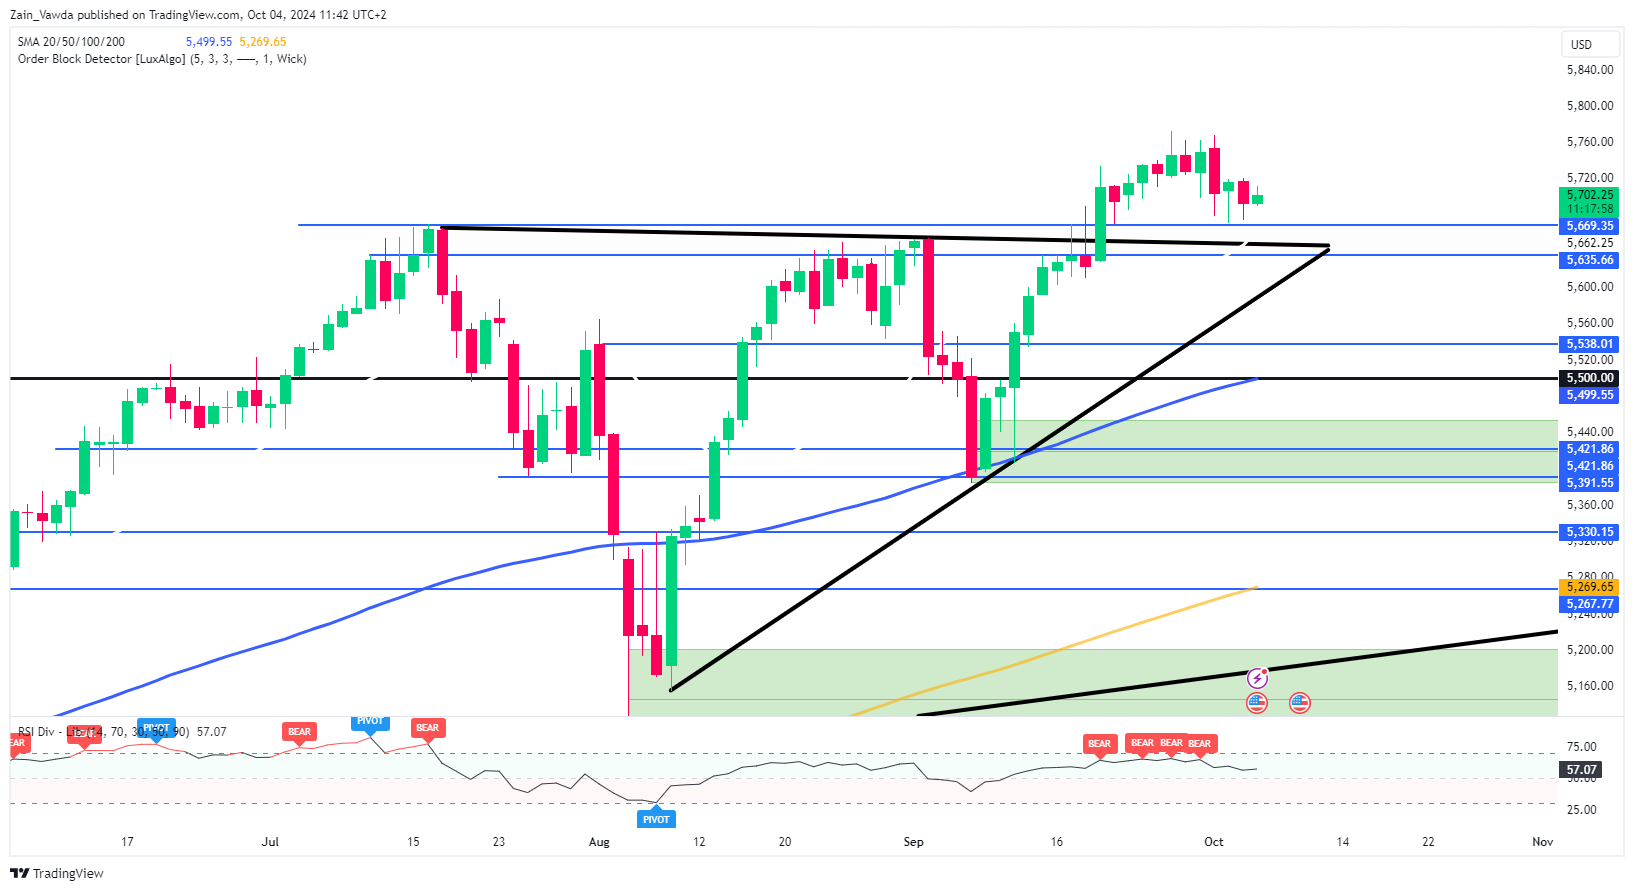
Source: TradingView (click to enlarge)
Support
- 5669
- 5635
- 5538
Resistance
- 5760
- 5910
- 6000
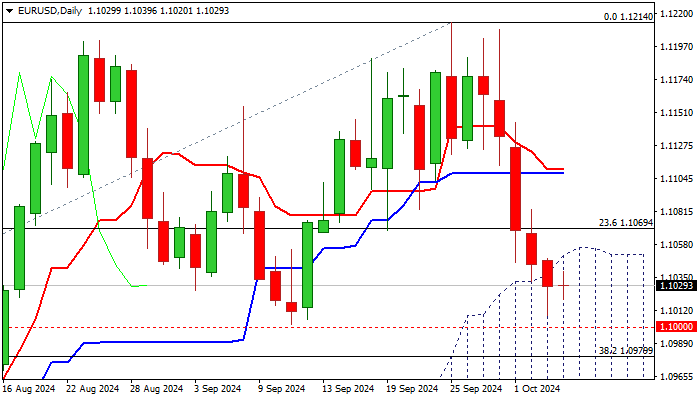
EUR/USD Outlook: Bears Hold Grip and Pressure Key 1.1000 Support Zone Ahead of US Labor Data
EURUSD remains firmly in red and trading near the lowest level in almost one month on Friday morning.
Bears eye key supports at 1.10 zone (psychological / Sep 11 higher low / Fibo 38.2% of 1.0601/1.1204 uptrend) break of which to generate reversal signal on breach of the floor of multi-week consolidation range and completion of a double-top pattern on daily chart.
Bears broke through initial Fibo support at 1.1069 (23.6%) and penetrated into ascending thick daily Ichimoku cloud (spanned between 1.1056 and 1.0933) with weekly close within the cloud to contribute to negative outlook.
Rising negative momentum and converging 10/20 MA’s in bearish setup and about to create a bear-cross, add pressure, but partially countered by oversold conditions and anticipated stronger headwinds from thick daily cloud and strong 1.10 support zone.
We look for firmer signals on sustained break below 1.10 zone or bounce and close above cloud top, which would ease immediate downside risk, further bullish signals to be expected on rally through converged daily Tenkan / Kijun-sen (1.1111/08).
Fundamentals work against Euro, as the ECB got more support for further rate cuts after inflation fell below 2% target, while EU composite PMI fell below 50 threshold in September, signaling contraction.
Release of US labor data for September is expected to play a key role today, with Nonfarm payrolls expected to rise moderately (Sep 147K f/c vs Aug 142K) average earnings to ease (Sep m/m 0.3% f/c vs Aug 0.4% and unemployment to remain unchanged at 4.2% in September).
If hiring in the US falls below expectations and particularly dips below 100K trigger, it will signal that US labor market is cooling and add to bets for another outsized Fed rate cut next month, providing strong support to the single currency.
Conversely, stronger than expected NFP numbers would inflate Dollar and increase pressure on Euro.
Res: 1.1056; 1.1069; 1.1110; 1.1144.
Sup: 1.1000; 1.0980; 1.0930; 1.0907.
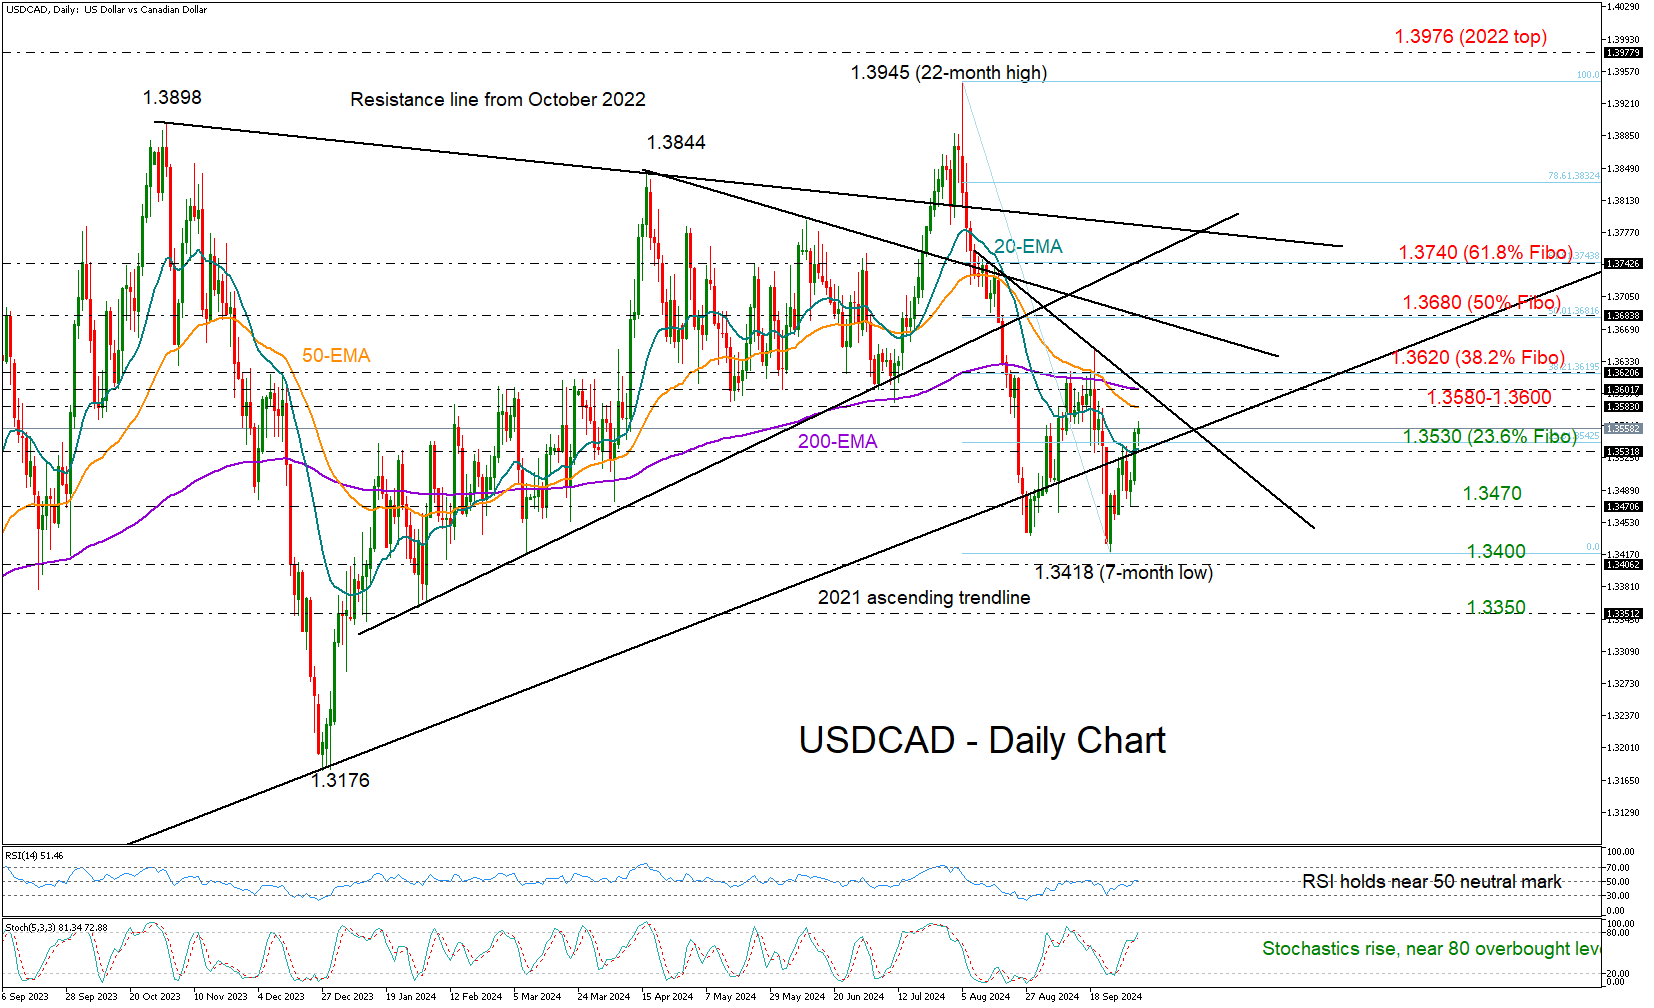
USDCAD Holds on Recovery Action as NFP Report Awaited
- USDCAD returns above 20-day EMA and familiar constraining line
- Technical signals cannot warrant a meaningful rally
- September’s US nonfarm payrolls due at 12:30 GMT
USDCAD continued its upward movement from a seven-month low of 1.3418, surpassing its 20-day exponential moving average (EMA) and the constraining ascending line from the 2021 low.
The range of 1.3580-1.3620, which encapsulates the 50- and 200-day EMAs as well as the 38.2% Fibonacci retracement of the latest downleg is the next target on the upside. A successful penetration higher could see an acceleration towards the 50% Fibonacci of 1.3680. Further up, the bulls may head for the 61.8% Fibonacci of 1.3740.
However, caution may be necessary based on the technical picture. There is no improvement in trend signals as the EMAs continue to point downwards. Moreover, the RSI has yet to step clearly above its 50 neutral mark and the stochastic oscillator is already very close to its 80 overbought level.
Nevertheless, sellers may stay on the sidelines until the price slips below the 20-day EMA at 1.3530. If this situation occurs, there could be immediate support around 1.3470, and then the bears may push for a close below 1.3400 with scope to reach the 1.3350 barrier from January 2024.
Briefly, there may be constraints on how much USDCAD can rise in the near future. For a decisive rally the pair may need to pierce through 1.3620, whilst a drop below 13530 might be enough to resume selling interest.