
Sample Category Title
GBP/JPY Weekly Outlook
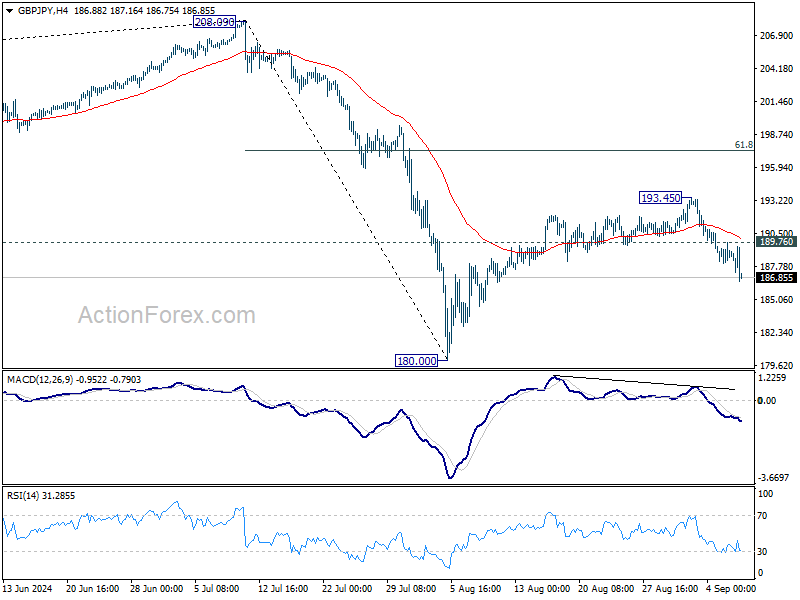
GBP/JPY's decline last week suggests that rebound from 180.00 has completed at 193.45, ahead of 55 D EMA. Initial bias remains on the downside this week for retesting 180.00 low first. Break there will resume whole fall from 208.09. On the upside, above 189.76 minor resistance will turn intraday bias neutral first.
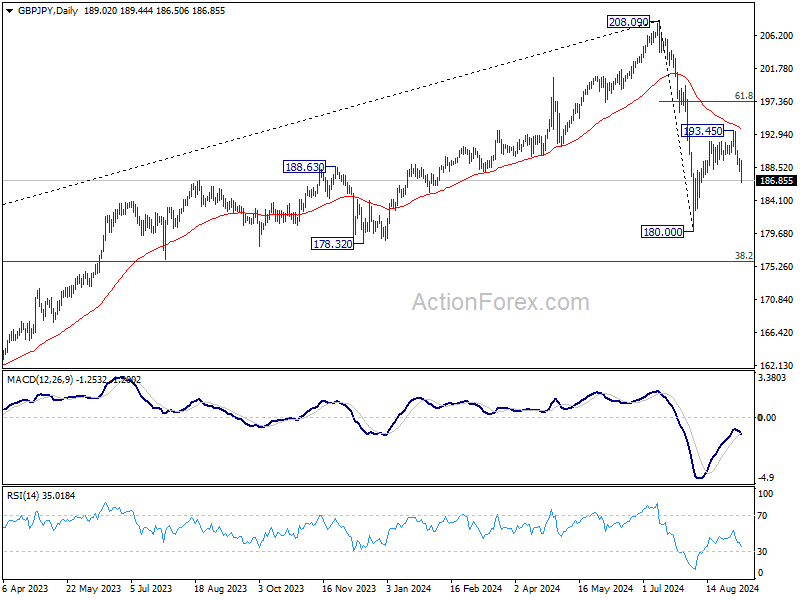
In the bigger picture, price actions from 208.09 are seen as a correction to whole rally from 123.94 (2020 low). The range of consolidation should be set between 38.2% retracement of 123.94 to 208.09 at 175.94 and 208.09. However, decisive break of 175.94 will argue that deeper correction is underway.
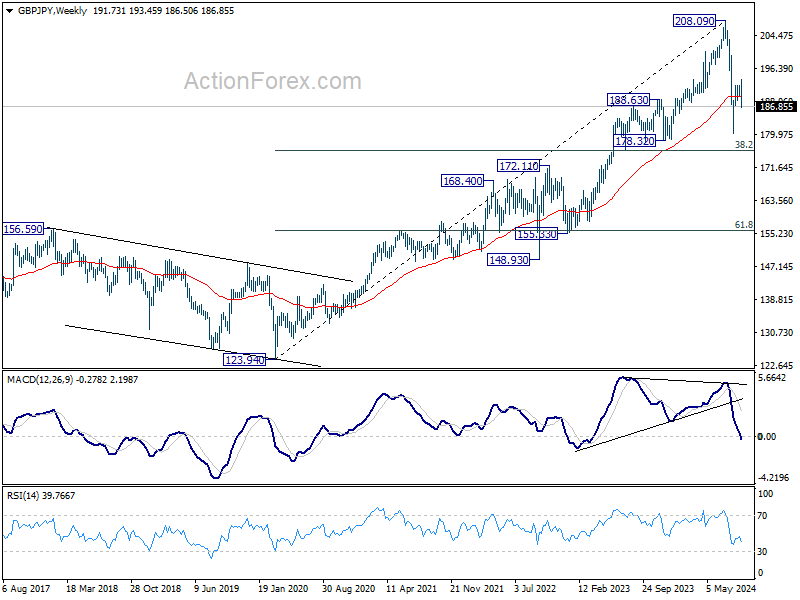
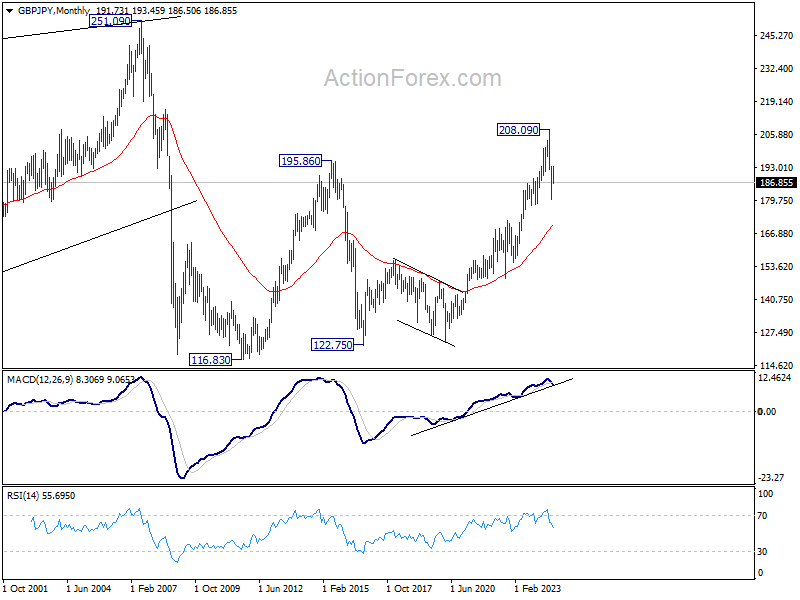
In the longer term picture, considering bearish divergence condition in W MACD, 208.09 is at least a medium term top. It's still early to conclude that the up trend from 122.75 (2016 low) has completed. But it's at least in a medium term corrective phase, with risk of correction to 55 M EMA (now at 169.35).
EUR/JPY Weekly Outlook
EUR/JPY's fall from 163.86 extended lower last week and the development suggests that rebound from 154.40 has completed at 163.86, ahead of 55 D EMA. Initial bias remains on the downside this week for retesting 154.40. Break there will resume the whole decline from 175.41 to 153.15 support. On the upside, above 160.01 support turned resistance will turn intraday bias neutral first.
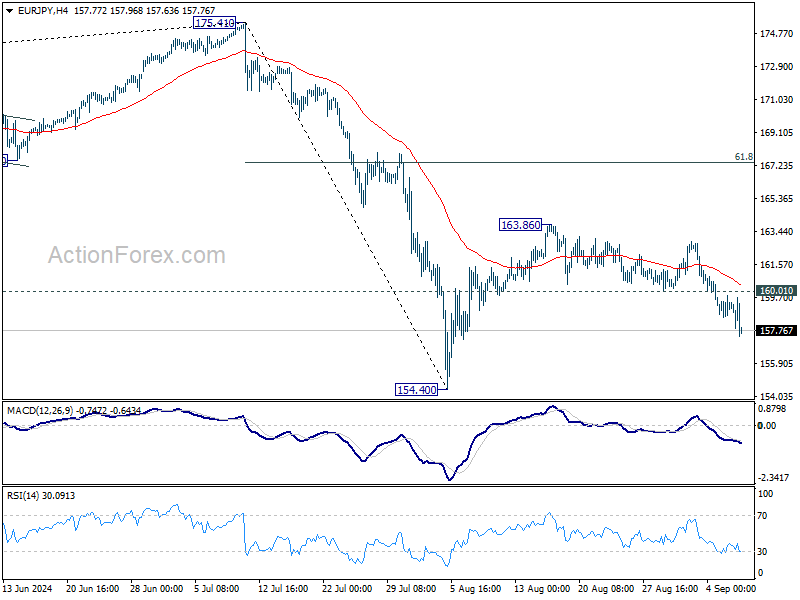
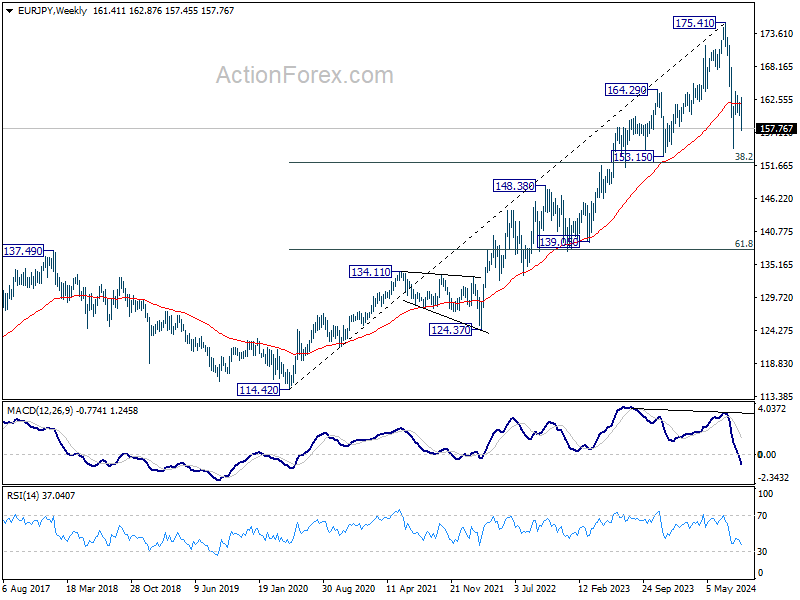
In the bigger picture, price actions from 175.41 are seen as correction to rally from 114.42 (2020 low). The range of consolidation should have been set between 38.2% retracement of 114.42 to 175.41 at 152.11 and 175.41 high. However, decisive break of 152.11 would argue that deeper correction is underway.
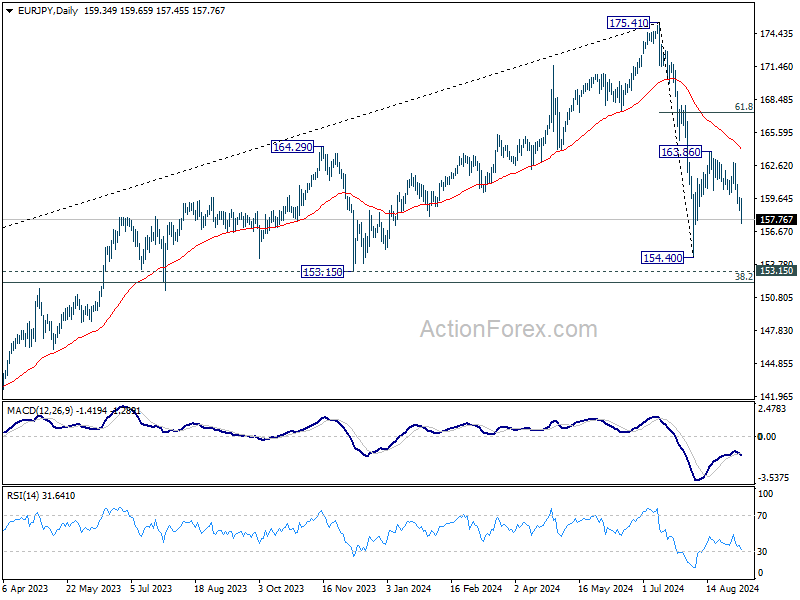
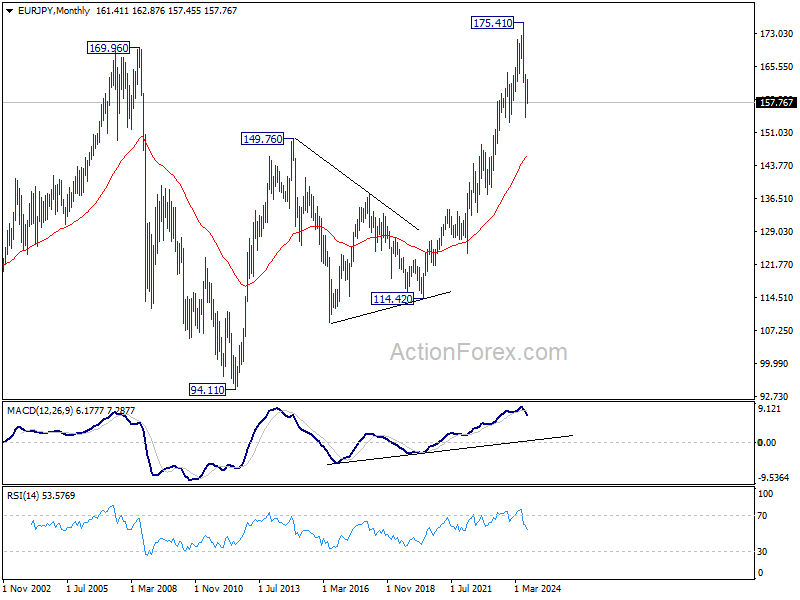
In the long term picture, considering bearish divergence condition in W MACD, 175.41 is at least a medium term top. It's still early to conclude that up trend from 94.11 (2012 low) has completed. But a medium term corrective phase is in progress with risk of deeper fall back to 55 M EMA (now at 145.95).
EUR/GBP Weekly Outlook
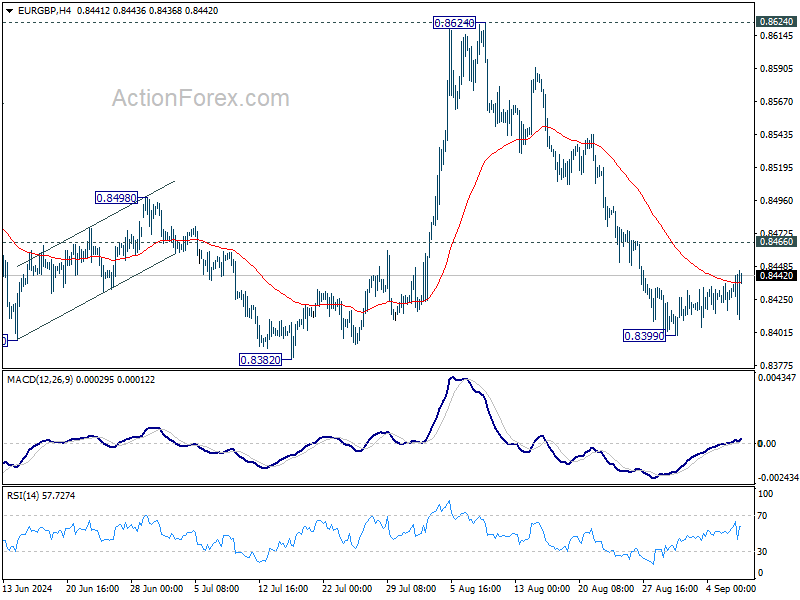
EUR/GBP extended the consolidations from 0.8399 last week and outlook is unchanged. Initial bias remains neutral this week first. While stronger recovery might be seen, outlook will stay bearish as long as 0.8466 resistance holds. Break of 0.8399 will resume the fall from 0.8624 and target 0.8382 support. Firm break there will resume larger down trend.
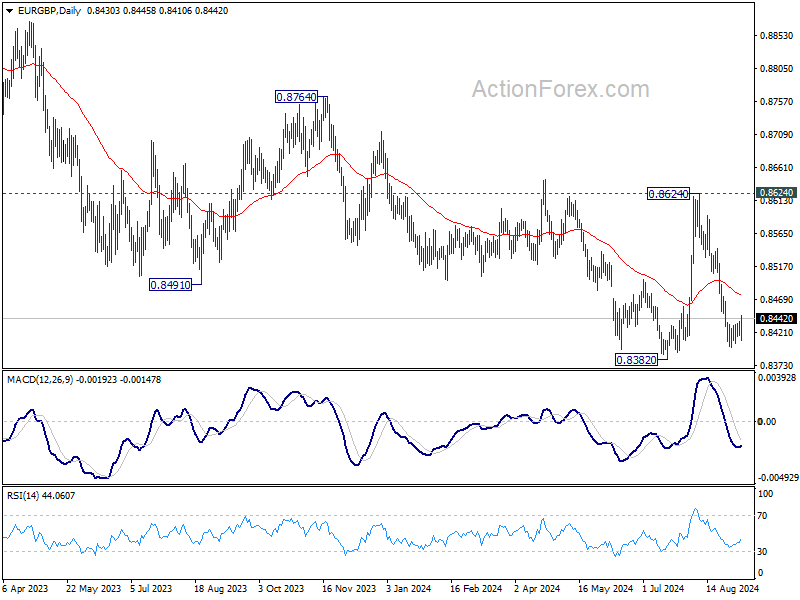
In the bigger picture, as long as 0.8624 resistance holds, down trend from 0.9267 is expected to continue. Firm break of 0.8382 will target 0.8201 (2022 low). However, decisive break of 0.8624 will indicate that such down trend has completed, and turn outlook bullish for 0.8764 resistance next.
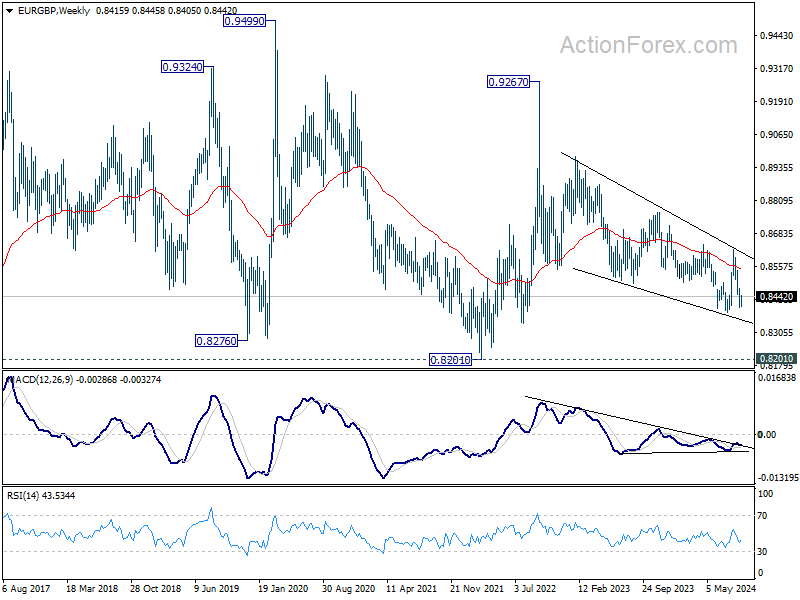
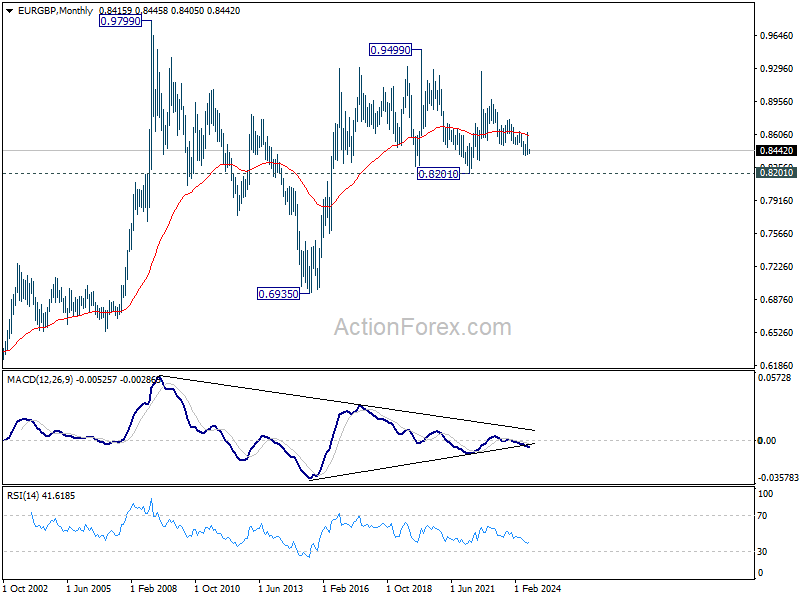
In the long term picture, price action from 0.9499 (2020 high) is seen as part of the long term range pattern from 0.9799 (2008 high). Range trading should continue between 0.8201 and 0.9499, until there is clear signal of imminent breakout.
EUR/AUD Weekly Outlook
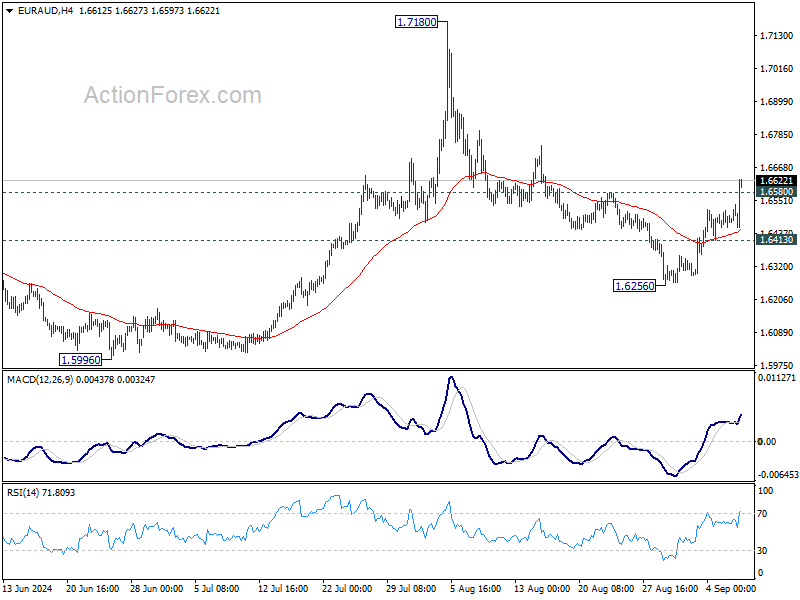
EUR/AUD's strong rebound and break of 1.6580 resistance last week suggests that corrective pullback from 1.7180 has completed at 1.6256 already. Initial bias is back on the upside for retesting 1.7180 resistance next. On the downside, below 1.6413 support will turn bias back to the downside for 1.6256 again.
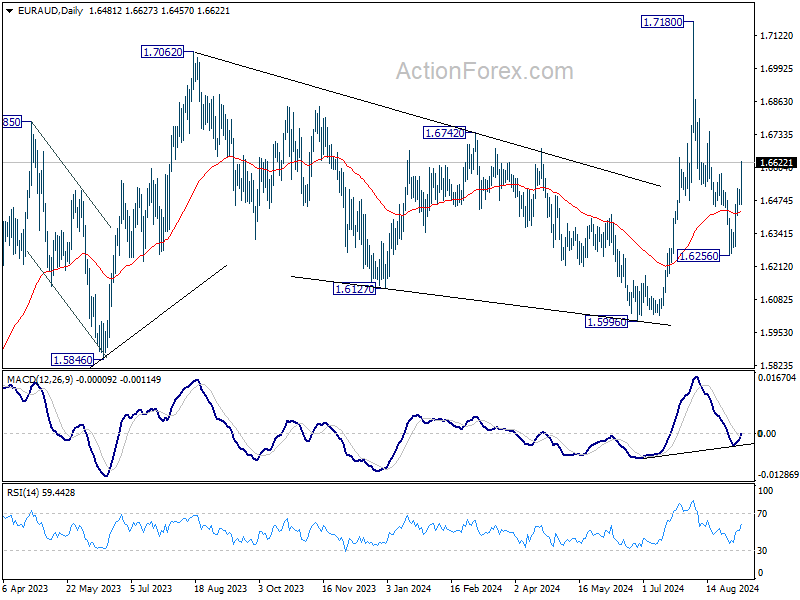
In the bigger picture, outlook is mixed up by the deeper than expected fall from 1.7180. Yet as long as 1.5996 support holds, up trend from 1.4281 (2022 low) is still expected to resume at a later stage. Firm break of 1.7180 will pave the way to 61.8% projection of 1.4281 to 1.7062 from 1.5996 at 1.7715.
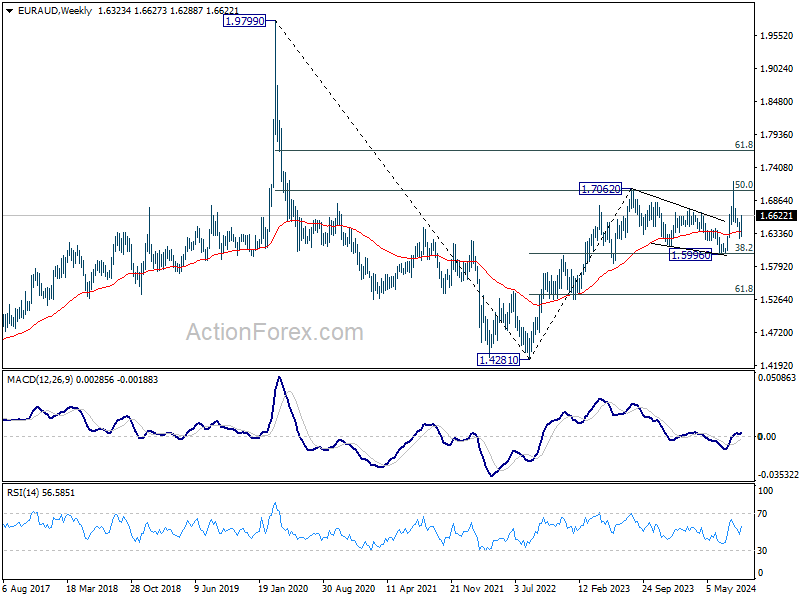
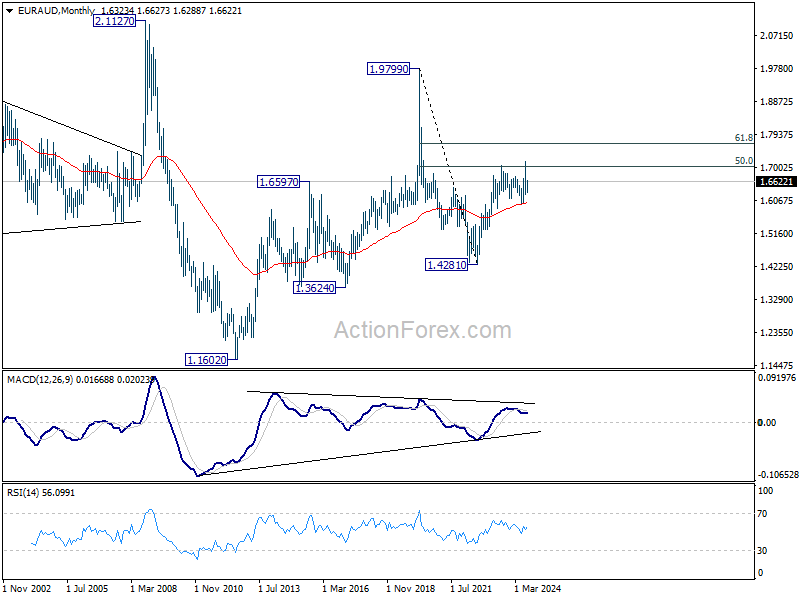
In the longer term picture, price actions from 1.9799 (2020 high) are seen as a long term decline at the same scale as the rise from 1.1602 (2012 low). Rebound from 1.4281 is seen as the second leg. As long as 55 M EMA (now at 1.5999) holds, this second leg could still extend higher. However, sustained trading below 55 M EMA will open up the bearish case for extending the decline through 1.4281 low.
Market Jitters Rise as Indecisive Fed Outlook Sparks Risk Aversion Across Assets
Investors expressed clear dissatisfaction with last week's US non-farm payroll report, not much due to a miss in job growth expectations, but data left the size of the upcoming Fed rate cut unsettled, raising fears that Fed's indecisive stance could worsen the already fragile economic outlook. In response, US equity markets ended the week sharply lower, with major indexes posting significant losses alongside a notable drop in the benchmark 10-year Treasury yield. The risk-off sentiment also spread to other markets, including oil and cryptocurrencies.
Yen was the clear winner of the week, registering broad-based gains fueled additionally by falling US and European bond yields. Meanwhile, there is increasing risk that the steep selloff in Japan's Nikkei index and Yen's rally could create a self-reinforcing cycle, with negative spillover effects for global markets.
Swiss Franc also benefited from the prevailing risk-averse sentiment, finishing as the second-strongest currency of the week. Euro rounded out the top three. At the other end of the spectrum, Australian Dollar was the worst-performing currency of the week. New Zealand Dollar followed behind, with Canadian Dollar also struggling amid weakening oil prices. In the middle of the pack, Dollar and British Pound ended with mixed performance.
Fed Policy Doubts Weigh on Stocks, S&P 500 and NASDAQ Suffer Significant Weekly Declines
After a brief rally on Friday following weaker-than-expected US employment data, US stocks reversed sharply and ended the week on a sour note. Investors re-evaluated the implications of the data for Fed's policy path, and concerns grew that a cautious approach to rate cuts could lead to a more pronounced economic downturn. S&P 500 fell by -4.3% for the week, marking its worst performance since March 2023, while NASDAQ plummeted -5.8%, its steepest weekly drop since 2022. DOW followed suit, closed the week down by -2.9%.
The August non-farm payroll report showed weaker-than-expected job growth but didn't definitively signal a 50bps rate cut for Fed's upcoming meeting this month. On the positive side, the unemployment rate ticked down slightly, helping to calm immediate recession fears triggered by the Sahm rule. However, wage growth came in at 0.4%, a figure that remains high enough to fuel inflation concerns. Additionally, ISM services index indicated modest growth in the services sector, which continues to perform better than the manufacturing sector, now stuck in a prolonged recession.
Initially, the odds of a 50bps rate cut spiked to above 50% following the NFP data, but by the end of the day, those odds had dropped back to 30%, unchanged from last week. However, markets have now priced in a 91.3% chance of a total 100bps cut by year-end, up significantly from 70% just a week ago. This suggests that while traders still expect rate cuts, they may foresee the Fed taking a more cautious, drawn-out approach rather than delivering aggressive action upfront.
Looking ahead, if upcoming CPI data surprises on the upside, Fed could face increased pressure to hold off on larger cuts, reinforcing the risk of a delayed but deeper economic downturn. A slower response from Fed may ultimately lead to more pronounced weakness in the labor market and broader economy, forcing the central bank to take stronger action, on at a later time.
Technically, S&P 500's strong break of 55 D EMA (now at 5472.64) suggests that rebound from 5119.26 has completed at 5651.37. Corrective pattern from 5669.67 should have started the third leg. Without a close above 55 D EMA, risk will now stay on the downside for deeper fall back to 5119.26 support, or slightly further to 38.2% retracement of 4103.78 to 5669.67 at 5069.81.
Similar, but slightly more bearish, picture is seen in NASDAQ. Rebound from 15708.53 should have completed at 18171.68. Fall from there should be the third leg of the corrective pattern from 18671.06. Risk will stay on the downside as long as 55 D EMA (now at 17347.28) holds. Deeper decline should be seen to 15708.53 support, or possibly further to 100% projection of 1867106 to 15708.53 from 18171.68 at 15055.15.
US 10-year yield's breach of 3.669 support late last week suggests that fall from 4.737, as well as that from 4.997, is resuming. Near term risk will now stay on the downside as long as 3.923 resistance holds. Next target is 100% projection of 4.997 to 3.785 from 4.737 at 3.525.
The question for 10-year yield is whether 3.525 could provide enough support to stabilize the decline. Or, TNX would need to dive further to 3.253 cluster support (38.2% retracement of 0.398 to 4.997 at at 3.240) before bottoming.
Dollar index continues to defend 100.61 key support level in indecisive price actions. The drag from falling yields was somewhat countered by risk-aversion on Friday, as DXY eventually closed at 101.17. For now, risk will stay on the downside as long as 102.16 support turned resistance holds. Firm break of 100.51/61 will resume whole fall from 107.34 to 99.57 (2023 low) next. That would also raise the chance of resuming whole down trend from 114.77 (2022 high).
Nevertheless, strong bounce from current level, followed by break of 102.16 will confirm short term bottoming and keep medium term outlook neutral for more sideway trading.
Nikkei Poised for Further Decline: Could Another Shockwave Hit Global Markets
The sharp drop in Japan's Nikkei index is worth significant attention, especially considering the shockwave it sent through global markets in early August, when it plunged from 40k to 31k in just a few days.
Last week's losses were particularly striking as they occurred even before the US stock market selloff, which followed the release of NFP data and the corresponding strong rally in Yen. Given this backdrop, Nikkei appears poised for further downside in the coming week.
Technically, Nikkei appears to have formed a short-term top at 39080.64, marked by a classic island reversal pattern. Immediate focus is now on 38.2% retracement of 31156.11 to 39080.64 at 36053.47. Decisive break there will argue that whole rebound from 31156.11 has completed and deeper fall would be seen to 61.8% retracement at 34183.28, and possibly below.
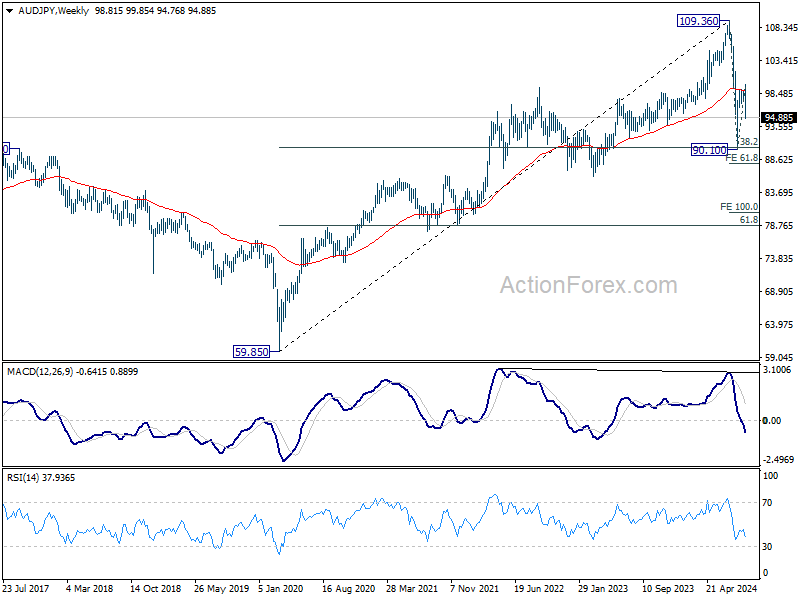
The next move in Nikkei will largely depend on the strength of Yen's rally. AUD/JPY ended as the biggest mover last week, closing down -3.99%. The development suggests that rebound from 90.10 has completed at 99.82, after rejection by falling 55 D EMA. Deeper fall should be seen to 61.8% retracement of 90.10 to 99.82 at 93.75.
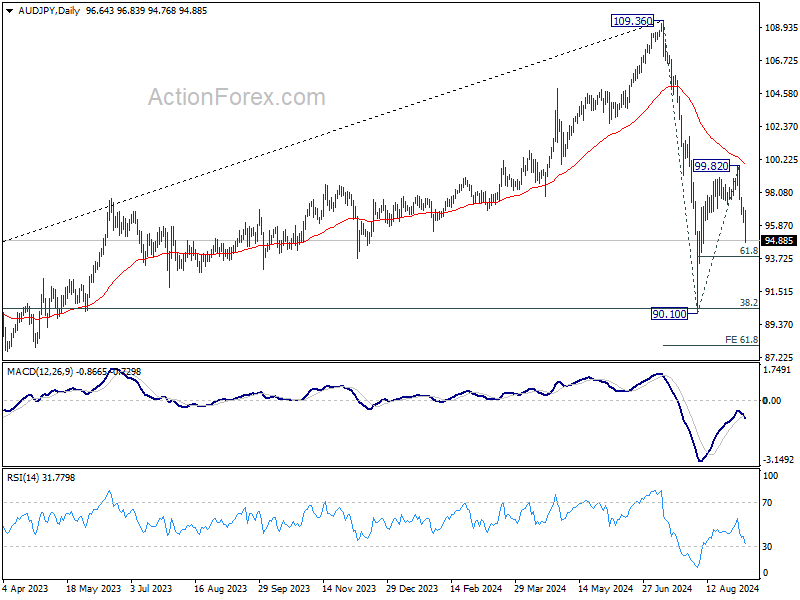
More importantly, AUD/JPY was also rejected by 55 W EMA, which could set up deeper medium term decline. Sustained break of 93.75 will raise that whole fall from 109.36 is resuming through 90.10 to 61.8% projection of 109.36 to 9010 from 99.82 at 87.91. If this bearish scenario is realized, that could probably mean a corresponding break of 31156.11 support in Nikkei, and intensification of risk aversion in the global markets.
WTI Oil and Bitcoin Point to Underlying Risk Aversion
In gauging overall risk sentiment ahead, some other markets would also be analyzed for confirmation of the overall direction.
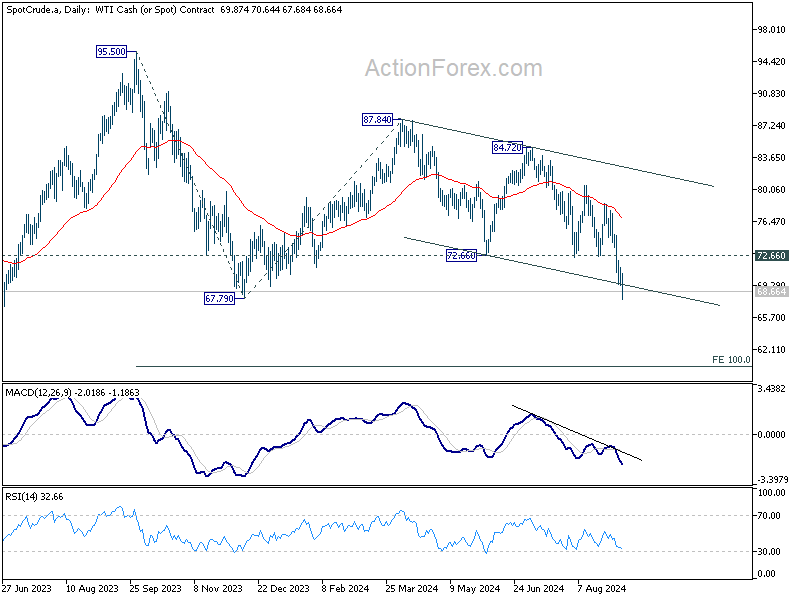
WTI crude oil suffered the worst weekly plunge since last October, and closed at the lowest level since June 2023. The fall came even with support factors like OPEC+ delayed plan to boost production until December. Traders were apparently more worried about the demand considering the global slowdown, in the US, Europe, as well as China.
Technically, WTI's close below lower channel support suggests that the fall is probably accelerating. Near term outlook will stay bearish as long as 72.66 support turned resistance holds. The question is whether 63.67/67.79 zone could provide enough support to form a bottom. If not, WTI would then be extending the larger down trend from 131.82. Next target will be 100% projection of 95.50 to 67.79 from 87.84 at 60.13.
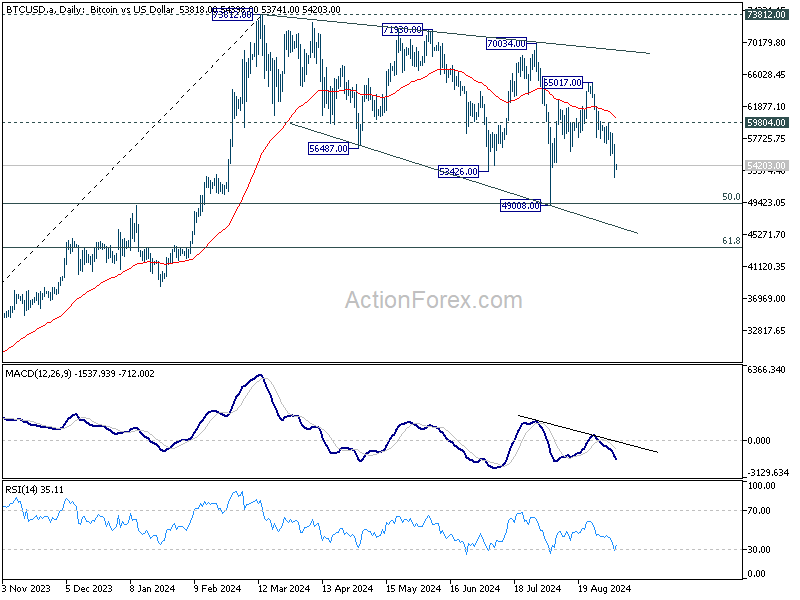
Bitcoin's extended fall last week suggests that rebound from 49008 has completed at 65017 already. More importantly, corrective pattern from 73812 is now extending with another falling leg. Near term outlook will stay bearish as long as 59004 resistance holds. Next target is 49008 support. Firm break there will extend the correction to 61.8% retracement of 24896 to 73812 at 43581.
EUR/CHF Weekly Outlook
EUR/CHF's fall from 0.9759 continued last week despite interim recovery. Initial bias is now on the downside this week. As noted before, rebound from 0.9209 should have completed at 0.9579, ahead of 55 D EMA. Deeper fall should be seen to retest 0.9209 first. Firm break there will resume larger down trend. For now, risk will stay on the downside as long as 0.9444 resistance holds, in case of recovery.
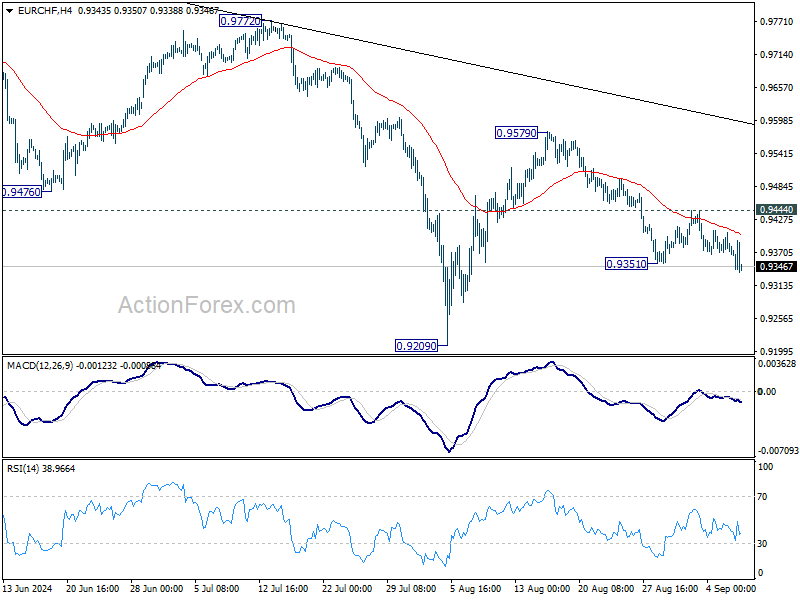
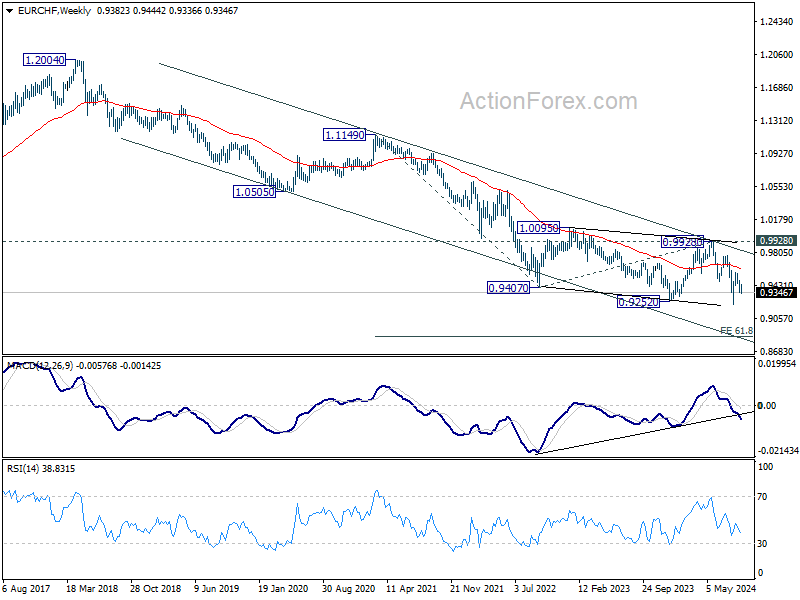
In the bigger picture, medium term corrective pattern from 0.9407 (2022 low) might have completed with three waves to 0.9928. Decisive break of 0.9252 (2023 low) will confirm long term down trend resumption. Next target will be 61.8% projection of 1.1149 to 0.9407 from 0.9928 at 0.8851. For now, outlook will stay bearish as long as 0.9928 resistance holds, even in case of strong rebound.
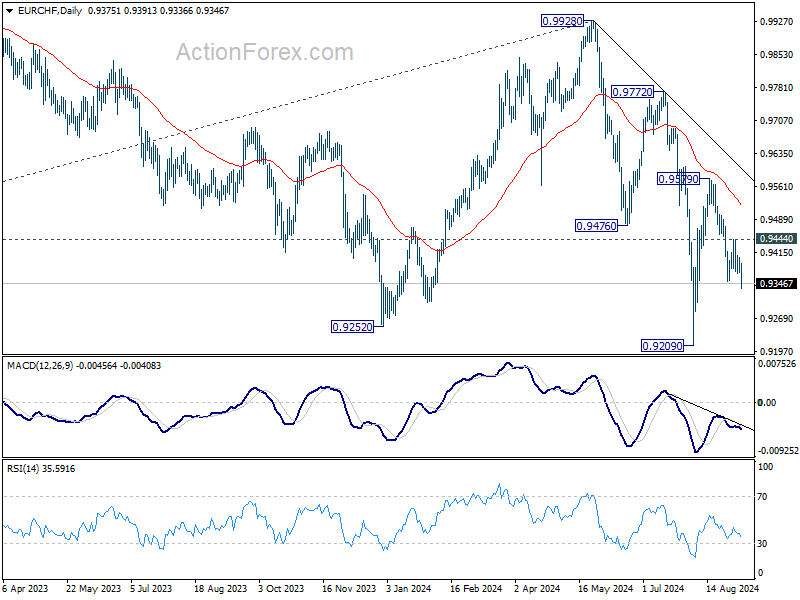
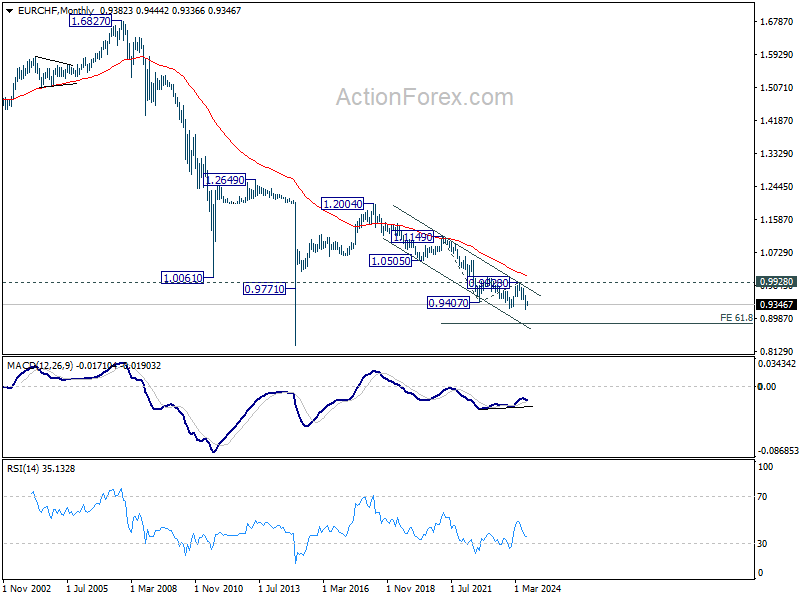
In the long term picture, fall from 1.2004 (2018 high) is part of the multi-decade down trend. Firm break of 0.9928 resistance is needed to be the first sign of long term bottoming. Otherwise, outlook will remain bearish.
EUR/CHF Weekly Outlook
EUR/CHF's fall from 0.9759 continued last week despite interim recovery. Initial bias is now on the downside this week. As noted before, rebound from 0.9209 should have completed at 0.9579, ahead of 55 D EMA. Deeper fall should be seen to retest 0.9209 first. Firm break there will resume larger down trend. For now, risk will stay on the downside as long as 0.9444 resistance holds, in case of recovery.
In the bigger picture, medium term corrective pattern from 0.9407 (2022 low) might have completed with three waves to 0.9928. Decisive break of 0.9252 (2023 low) will confirm long term down trend resumption. Next target will be 61.8% projection of 1.1149 to 0.9407 from 0.9928 at 0.8851. For now, outlook will stay bearish as long as 0.9928 resistance holds, even in case of strong rebound.
In the long term picture, fall from 1.2004 (2018 high) is part of the multi-decade down trend. Firm break of 0.9928 resistance is needed to be the first sign of long term bottoming. Otherwise, outlook will remain bearish.
Summary 9/9 – 9/13
Monday, Sep 9, 2024
| GMT | Ccy | Events | Consensus | Previous |
|---|---|---|---|---|
| 23:50 | JPY | Bank Lending Y/Y Aug | 3.20% | 3.20% |
| 23:50 | JPY | Current Account (JPY) Jul | 2.10T | 1.78T |
| 23:50 | JPY | GDP Annualized Q2 F | 3.20% | 3.10% |
| 23:50 | JPY | GDP Deflator Y/Y Q2 F | 3.00% | 3.00% |
| 01:30 | CNY | CPI Y/Y Aug | 0.70% | 0.50% |
| 01:30 | CNY | PPI Y/Y Aug | -1.40% | -0.80% |
| 05:00 | JPY | Eco Watchers Survey: Current Aug | 47.6 | 47.5 |
| 08:30 | EUR | Eurozone Sentix Investor Confidence Sep | -11.7 | -13.9 |
| 14:00 | USD | Wholesale Inventories Jul F | 0.30% | 0.30% |
| 22:45 | NZD | Manufacturing Sales Q2 | 0.70% | |
| 23:50 | JPY | Money Supply M2+CD Y/Y Aug | 1.50% | 1.40% |
| GMT | Ccy | Events | |
|---|---|---|---|
| 23:50 | JPY | Bank Lending Y/Y Aug | |
| Forecast: 3.20% | Previous: 3.20% | ||
| 23:50 | JPY | Current Account (JPY) Jul | |
| Forecast: 2.10T | Previous: 1.78T | ||
| 23:50 | JPY | GDP Annualized Q2 F | |
| Forecast: 3.20% | Previous: 3.10% | ||
| 23:50 | JPY | GDP Deflator Y/Y Q2 F | |
| Forecast: 3.00% | Previous: 3.00% | ||
| 01:30 | CNY | CPI Y/Y Aug | |
| Forecast: 0.70% | Previous: 0.50% | ||
| 01:30 | CNY | PPI Y/Y Aug | |
| Forecast: -1.40% | Previous: -0.80% | ||
| 05:00 | JPY | Eco Watchers Survey: Current Aug | |
| Forecast: 47.6 | Previous: 47.5 | ||
| 08:30 | EUR | Eurozone Sentix Investor Confidence Sep | |
| Forecast: -11.7 | Previous: -13.9 | ||
| 14:00 | USD | Wholesale Inventories Jul F | |
| Forecast: 0.30% | Previous: 0.30% | ||
| 22:45 | NZD | Manufacturing Sales Q2 | |
| Forecast: | Previous: 0.70% | ||
| 23:50 | JPY | Money Supply M2+CD Y/Y Aug | |
| Forecast: 1.50% | Previous: 1.40% | ||
Tuesday, Sep 10, 2024
| GMT | Ccy | Events | Consensus | Previous |
|---|---|---|---|---|
| 00:30 | AUD | Westpac Consumer Confidence Sep | 2.80% | |
| 01:30 | AUD | NAB Business Conditions Aug | 6 | |
| 01:30 | AUD | NAB Business Confidence Aug | 1 | |
| 03:00 | CNY | Trade Balance (USD) Aug | 82.1B | 84.7B |
| 06:00 | GBP | Claimant Count Change Aug | 135K | |
| 06:00 | GBP | ILO Unemployment Rate (3M) Jul | 4.10% | 4.20% |
| 06:00 | GBP | Average Earnings Including Bonus 3M/Y Jul | 4.50% | |
| 06:00 | GBP | Average Earnings Excluding Bonus 3M/Y Jul | 5.40% | |
| 06:00 | EUR | Germany CPI M/M Aug F | -0.10% | -0.10% |
| 06:00 | EUR | GermanyCPI Y/Y Aug F | 1.90% | 1.90% |
| 08:00 | EUR | Italy Industrial Output M/M Jul | -0.10% | 0.50% |
| 10:00 | USD | NFIB Business Optimism Index Aug | 93.6 | 93.7 |
| GMT | Ccy | Events | |
|---|---|---|---|
| 00:30 | AUD | Westpac Consumer Confidence Sep | |
| Forecast: | Previous: 2.80% | ||
| 01:30 | AUD | NAB Business Conditions Aug | |
| Forecast: | Previous: 6 | ||
| 01:30 | AUD | NAB Business Confidence Aug | |
| Forecast: | Previous: 1 | ||
| 03:00 | CNY | Trade Balance (USD) Aug | |
| Forecast: 82.1B | Previous: 84.7B | ||
| 06:00 | GBP | Claimant Count Change Aug | |
| Forecast: | Previous: 135K | ||
| 06:00 | GBP | ILO Unemployment Rate (3M) Jul | |
| Forecast: 4.10% | Previous: 4.20% | ||
| 06:00 | GBP | Average Earnings Including Bonus 3M/Y Jul | |
| Forecast: | Previous: 4.50% | ||
| 06:00 | GBP | Average Earnings Excluding Bonus 3M/Y Jul | |
| Forecast: | Previous: 5.40% | ||
| 06:00 | EUR | Germany CPI M/M Aug F | |
| Forecast: -0.10% | Previous: -0.10% | ||
| 06:00 | EUR | GermanyCPI Y/Y Aug F | |
| Forecast: 1.90% | Previous: 1.90% | ||
| 08:00 | EUR | Italy Industrial Output M/M Jul | |
| Forecast: -0.10% | Previous: 0.50% | ||
| 10:00 | USD | NFIB Business Optimism Index Aug | |
| Forecast: 93.6 | Previous: 93.7 | ||
Wednesday, Sep 11, 2024
| GMT | Ccy | Events | Consensus | Previous |
|---|---|---|---|---|
| 06:00 | GBP | GDP M/M Jul | 0.20% | 0.00% |
| 06:00 | GBP | Manufacturing Production M/M Jul | 0.20% | 1.10% |
| 06:00 | GBP | Manufacturing Production Y/Y Jul | -1.50% | |
| 06:00 | GBP | Industrial Production M/M Jul | 0.30% | 0.80% |
| 06:00 | GBP | Industrial Production Y/Y Jul | -1.40% | |
| 06:00 | GBP | Goods Trade Balance (GBP) Jul | -18.0B | -18.9B |
| 12:30 | USD | CPI M/M Aug | 0.20% | 0.20% |
| 12:30 | USD | CPI Y/Y Aug | 2.60% | 2.90% |
| 12:30 | USD | CPI Core M/M Aug | 0.20% | 0.20% |
| 12:30 | USD | CPI Core Y/Y Aug | 3.20% | 3.20% |
| 14:30 | USD | Crude Oil Inventories | -6.9M | |
| 23:01 | GBP | RICS Housing Price Balance Aug | -14% | -19% |
| 23:50 | JPY | BSI Large Manufacturing Index Q/Q Q3 | -1 | |
| 23:50 | JPY | PPI Y/Y Aug | 2.80% | 3.00% |
| GMT | Ccy | Events | |
|---|---|---|---|
| 06:00 | GBP | GDP M/M Jul | |
| Forecast: 0.20% | Previous: 0.00% | ||
| 06:00 | GBP | Manufacturing Production M/M Jul | |
| Forecast: 0.20% | Previous: 1.10% | ||
| 06:00 | GBP | Manufacturing Production Y/Y Jul | |
| Forecast: | Previous: -1.50% | ||
| 06:00 | GBP | Industrial Production M/M Jul | |
| Forecast: 0.30% | Previous: 0.80% | ||
| 06:00 | GBP | Industrial Production Y/Y Jul | |
| Forecast: | Previous: -1.40% | ||
| 06:00 | GBP | Goods Trade Balance (GBP) Jul | |
| Forecast: -18.0B | Previous: -18.9B | ||
| 12:30 | USD | CPI M/M Aug | |
| Forecast: 0.20% | Previous: 0.20% | ||
| 12:30 | USD | CPI Y/Y Aug | |
| Forecast: 2.60% | Previous: 2.90% | ||
| 12:30 | USD | CPI Core M/M Aug | |
| Forecast: 0.20% | Previous: 0.20% | ||
| 12:30 | USD | CPI Core Y/Y Aug | |
| Forecast: 3.20% | Previous: 3.20% | ||
| 14:30 | USD | Crude Oil Inventories | |
| Forecast: | Previous: -6.9M | ||
| 23:01 | GBP | RICS Housing Price Balance Aug | |
| Forecast: -14% | Previous: -19% | ||
| 23:50 | JPY | BSI Large Manufacturing Index Q/Q Q3 | |
| Forecast: | Previous: -1 | ||
| 23:50 | JPY | PPI Y/Y Aug | |
| Forecast: 2.80% | Previous: 3.00% | ||
Thursday, Sep 12, 2024
| GMT | Ccy | Events | Consensus | Previous |
|---|---|---|---|---|
| 01:00 | AUD | Consumer Inflation Expectations Sep | 4.50% | |
| 12:15 | EUR | ECB Main Refinancing Rate | 4.00% | 4.25% |
| 12:15 | EUR | ECB Deposit Rate | 3.50% | 3.75% |
| 12:30 | CAD | Building Permits M/M Jul | -13.90% | |
| 12:30 | USD | PPI M/M Aug | 0.20% | 0.10% |
| 12:30 | USD | PPI Y/Y Aug | 2.20% | |
| 12:30 | USD | PPI Core M/M Aug | 0.20% | 0.00% |
| 12:30 | USD | PPI Core Y/Y Aug | 2.40% | |
| 12:30 | USD | Initial Jobless Claims (Sep 6) | 231K | 227K |
| 12:45 | EUR | ECB Press Conference | ||
| 14:30 | USD | Natural Gas Storage | 13B | |
| 22:30 | NZD | Business NZ PMI Aug | 44 |
| GMT | Ccy | Events | |
|---|---|---|---|
| 01:00 | AUD | Consumer Inflation Expectations Sep | |
| Forecast: | Previous: 4.50% | ||
| 12:15 | EUR | ECB Main Refinancing Rate | |
| Forecast: 4.00% | Previous: 4.25% | ||
| 12:15 | EUR | ECB Deposit Rate | |
| Forecast: 3.50% | Previous: 3.75% | ||
| 12:30 | CAD | Building Permits M/M Jul | |
| Forecast: | Previous: -13.90% | ||
| 12:30 | USD | PPI M/M Aug | |
| Forecast: 0.20% | Previous: 0.10% | ||
| 12:30 | USD | PPI Y/Y Aug | |
| Forecast: | Previous: 2.20% | ||
| 12:30 | USD | PPI Core M/M Aug | |
| Forecast: 0.20% | Previous: 0.00% | ||
| 12:30 | USD | PPI Core Y/Y Aug | |
| Forecast: | Previous: 2.40% | ||
| 12:30 | USD | Initial Jobless Claims (Sep 6) | |
| Forecast: 231K | Previous: 227K | ||
| 12:45 | EUR | ECB Press Conference | |
| Forecast: | Previous: | ||
| 14:30 | USD | Natural Gas Storage | |
| Forecast: | Previous: 13B | ||
| 22:30 | NZD | Business NZ PMI Aug | |
| Forecast: | Previous: 44 | ||
Friday, Sep 13, 2024
| GMT | Ccy | Events | Consensus | Previous |
|---|---|---|---|---|
| 04:30 | JPY | Industrial Production M/M Jul F | 2.80% | 2.80% |
| 09:00 | EUR | Eurozone Industrial Production M/M Jul | 0.20% | -0.10% |
| 12:30 | CAD | Capacity Utilization Q2 | 78.40% | 78.50% |
| 12:30 | CAD | Wholesale Sales M/M Jul | -1.10% | -0.60% |
| 12:30 | USD | Import Price Index M/M Aug | -0.20% | 0.10% |
| 14:00 | USD | Michigan Consumer Sentiment Index Sep P | 68 | 67.9 |
| GMT | Ccy | Events | |
|---|---|---|---|
| 04:30 | JPY | Industrial Production M/M Jul F | |
| Forecast: 2.80% | Previous: 2.80% | ||
| 09:00 | EUR | Eurozone Industrial Production M/M Jul | |
| Forecast: 0.20% | Previous: -0.10% | ||
| 12:30 | CAD | Capacity Utilization Q2 | |
| Forecast: 78.40% | Previous: 78.50% | ||
| 12:30 | CAD | Wholesale Sales M/M Jul | |
| Forecast: -1.10% | Previous: -0.60% | ||
| 12:30 | USD | Import Price Index M/M Aug | |
| Forecast: -0.20% | Previous: 0.10% | ||
| 14:00 | USD | Michigan Consumer Sentiment Index Sep P | |
| Forecast: 68 | Previous: 67.9 | ||
Markets Weekly Outlook – ECB Rates, China and US Presidential Debate in Focus
- US jobs data missed estimates, keeping recessionary fears very much in play.
- US Equities continue their September struggles as Oil falters as well.
- ECB expected to cut rates amidst slowing European economy, while UK jobs data and US CPI figures remain in focus.
Week in Review: Jobs Data Fails to Provide Clarity as Underlying Data Flashes Warning Signs
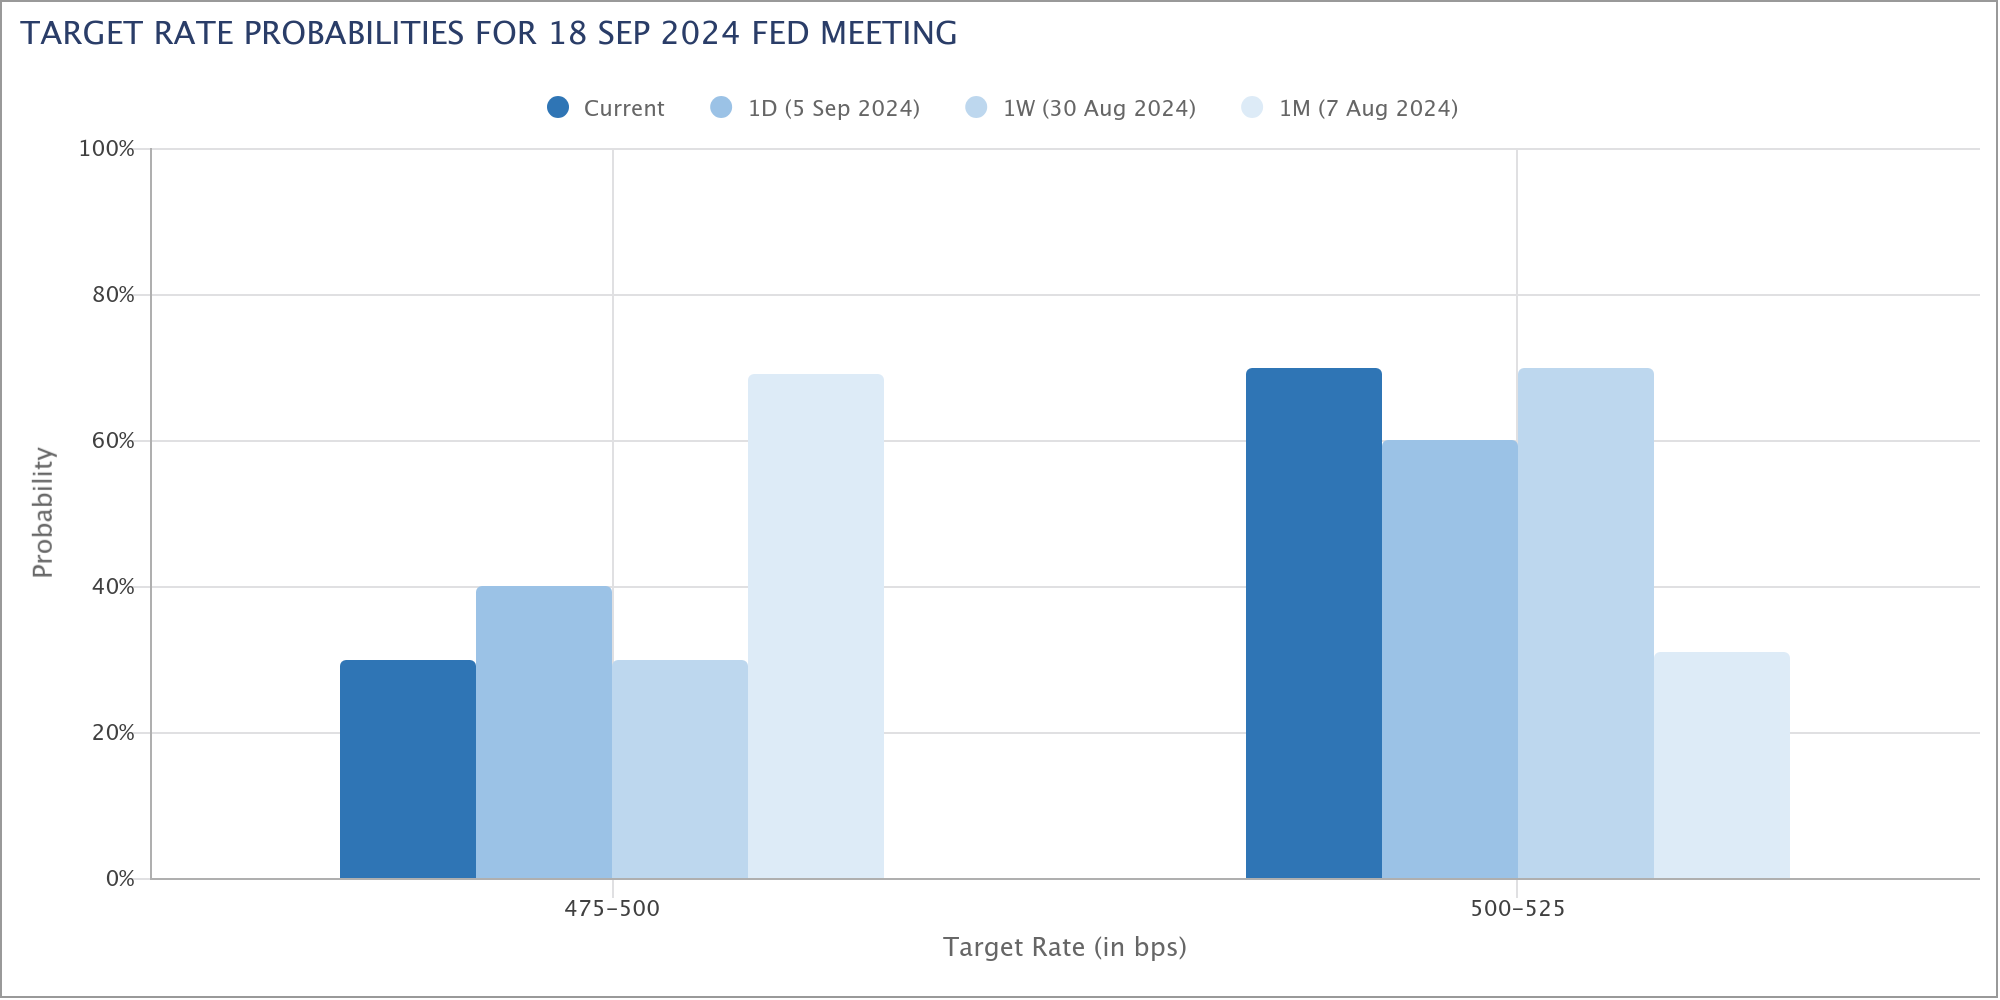
As the week draws to a close, US jobs data failed to provide clarity on whether the US Federal Reserve will deliver a 25 or 50 bps cut at the September 18 meeting. Although the number of jobs created missed estimates, there was enough in the report to keep markets on edge for a little while longer.
In August, the non-farm payrolls increased by 142,000, which was below the expected 165,000. Moreover, the previous two months saw a reduction of 86,000 in their initial estimates. This pattern of revising numbers downward is ongoing and doesn’t account for recent benchmark revisions that indicated the Bureau of Labor Statistics overestimated payroll growth by an average of 78,000 per month for the year leading up to March 2024. For instance, June’s job growth was first reported as 206,000, then adjusted to 179,000, and is now just 118,000. Similarly, July’s figures dropped from 114,000 to 89,000.
It looks as if the apparent weakness in the labor market may finally be showing itself. Given that, is it possible to rule out a 50 bps cut. My take is not especially with the improvement we witnessed in the unemployment rate which improved to 4.2% from last month’s surprise print of 4.3%.
Another point that may concern the Federal Reserve and cited by ING Think Research, is the growing divide between fulltime and part-time employment. According to ING this tallies with the idea that the US is adding largely lower-paid, part-time jobs and is losing full-time, well-paid jobs, primarily through attrition – not replacing retiring or quitting workers.

Source: ING Think (click to enlarge)
Every recession starts this way, unfortunately. The easiest way to cut costs is not to replace workers, but if everyone is doing that, then the economy slows, and companies start making actual cuts down the line.
As for performance this week, US Equities have continued their September blues as historic seasonality suggested. Leading Wall Street indexes were all red for the week with the Nasdaq down around 5.6%, the S&P down 4% and the DJIA down around 2.84%.
The downturn is reflected in US equity funds flows which experienced their largest weekly outflow in 12 weeks by September 4. This is in line with growing concern around the health of the global economy. According to LSEG data, investors disposed of a net $11.37 billion worth of US equity funds during the week. This was also the fourth weekly outflow in five weeks.
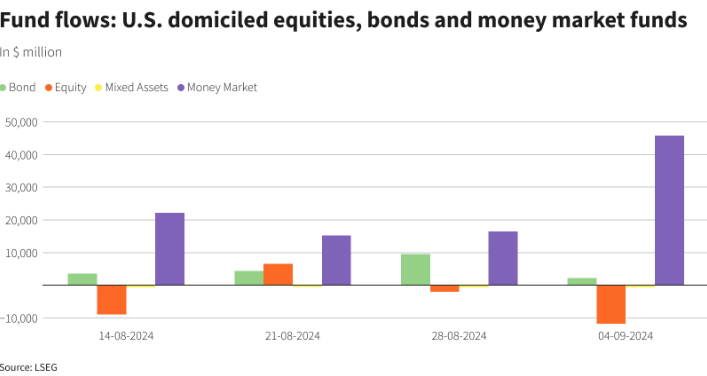
Source: LSEG Workspace (click to enlarge)
Oil prices suffered from concern around the economy as well. Word that OPEC + will defer production increases which were scheduled to start in October was not enough to rescue the selloff. This leaves oil in a precarious position heading into the new week as it looks set to end the week around 8% down.
Gold did not manage to break its all-time high despite recessionary concerns and part of this may be down to the amount of rate cuts already priced in by market participants. The US Dollar Index (DXY) saw a similar reaction and strengthened following the release of the jobs data to finish the week on a high.
The market’s reaction was similar to the swings in rate cut expectations. Initially, 65% of participants anticipated a 50 basis point cut right after the data was released. However, as the trading session progressed, expectations were adjusted significantly. The latest pricing now suggests a 75% likelihood of a 25 basis point cut.

Source: CME FedWatch Tool (click to enlarge)
The Week Ahead: ECB to Cut Rates, Trump-Harris Debate
The week ahead is not expected to be as chaotic as last week particularly from a data point of view. The US gets a reprieve on the data front as the US election comes into focus with the Presidential debate between Kamala Harris and Donald Trump. The debate itself should not have a huge impact on markets barring any significant surprises.
Asia Pacific Markets
In Asia, the upcoming week puts focus on Chinese data which has been a point of contention of late. Deteriorating data has been one of the signs that the global economy is slowing, particularly from a demand perspective.
China is about to release its trade, inflation, and credit data next week. We expect that trade growth in August continued to slow, with exports increasing by about 5% compared to last year and imports by about 3%. It’s important to keep an eye on car exports, which have been under pressure and are likely to slow down more. If car exports go from helping to hurting, it could weaken China’s overall export performance. Inflation is expected to rise slightly in August.
Europe + UK + US
In Europe and the US, it’s still a heavy data week but more so from the UK and Euro Area.
The European Central Bank (ECB) meeting being the biggest event with the ECB expected to deliver another 25 bps cut. Current inflation is nearing 2%, and longer-term forecasts are stable at about 2%, giving the ECB good reasons to ease up on strict monetary policies. Couple this with the struggles faced by the German economy and it would seem to be a no brainer.
The UK focus will be jobs data in the week ahead. Last month, there was a sudden and unusual drop in UK unemployment from 1.5 million to 1.2 million in just one month. Since the unemployment rate is calculated as a moving average, we might see it decrease further, possibly reaching 4.0% from a recent high of 4.4%. This could happen even if the number of unemployed people rises again in the most recent monthly figures. The data is however unlikely to have any long lasting impact on rate expectations as it relates to the Bank of England.
The highlights from the US with the exception of the Presidential debate will come in the form of US CPI and PPI data. The data which markets had been glued to over the last 24 months suddenly does not hold the same sway. Barring any crazy figure this should not sway rate cut expectations all that much with labor data now holding the key. Short-term volatility and fluctuations should still be expected however.
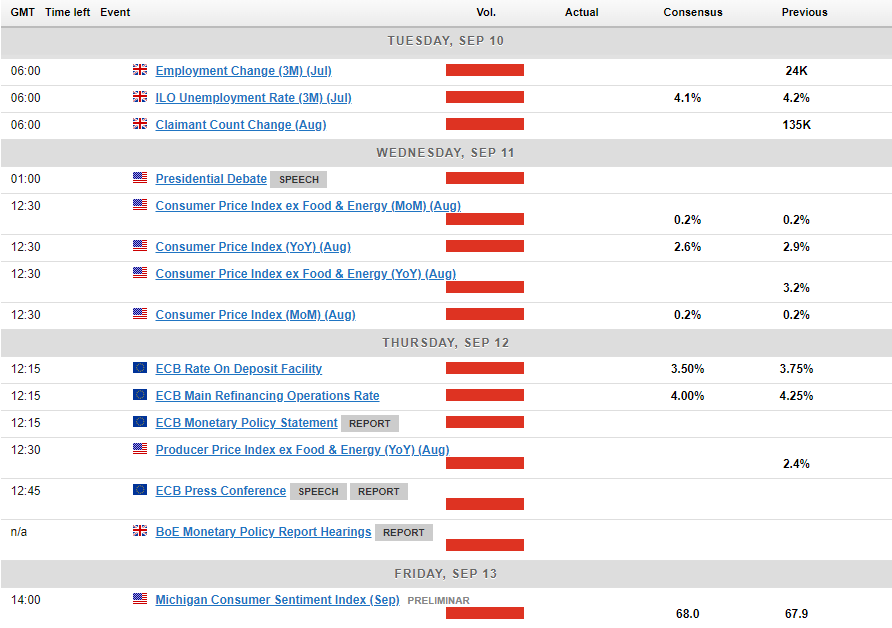
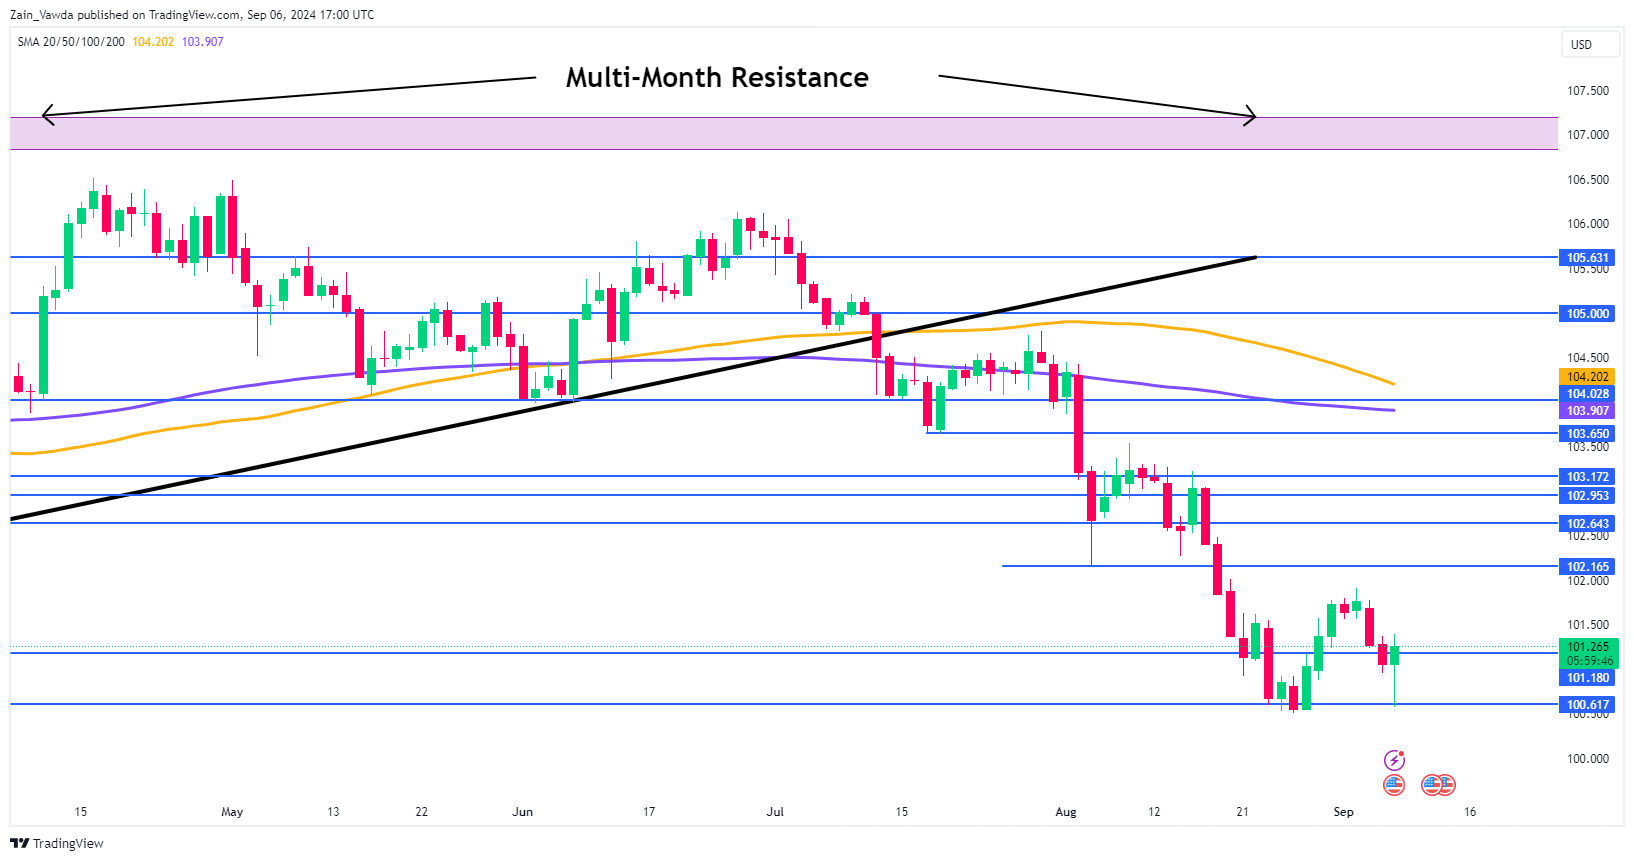
Chart of the Week
This week’s focus is on the US Dollar Index (DXY), which continues to be intriguing and surprising. The main question on my mind is how much of the expected rate cuts are already reflected in the Dollar’s value. After Friday’s data release, the Dollar initially dropped but then rose sharply, suggesting that a lot of the rate cut expectations might already be factored in.
The DXY continues to find support around the 100.50 handle and keeping a retest of the 100.00 psychological mark at bay, for now. The weekly and daily candle are however sending mixed signals. The weekly candle is set to close as a hanging man while the daily candle is on course for a hammer candlestick close hinting at a move higher on Monday. The only positive around the weekly candle is that a hanging man candle at support is not a high conviction print as it is best when it appears following a significant upside rally at a area of resistance.
There remains many hurdles on the upside with initial resistance at 101.80 and 102.16 before the 103.00 handle comes into focus.
A move back to the downside now needs to navigate support at 101.17 before the 100.50 level. The psychological 100.00 remains untested yet and remains a massive barrier if bulls are to seize control.
US Dollar Index (DXY) Daily Chart – August 30, 2024
Source:TradingView.Com (click to enlarge)
Key Levels to Consider:
Support:
- 101.17
- 100.50
- 100.00
Resistance:
- 101.80
- 102.16
- 103.00
- 104.00 (200-day MA)
The Weekly Bottom Line: With Employment Slowing, The Time to Cut is Here
U.S. Highlights
- The U.S. added fewer jobs than expected in August, even as wage growth accelerated, and the unemployment rate edged down. Additionally, JOLTS data pointed to lower job openings, suggesting that the U.S. labor market continued to cool.
- Fed Governor Williams stated that the time had come for less restrictive monetary policy but remained mum on the possible size of any cut. Governor Waller, however, suggested he favored starting carefully.
- Manufacturing activity continued to contract in August, with demand easing. However, the services sector, continued to chug along as it has for much of this year.
Canadian Highlights
- There were no surprises from the Bank of Canada this week, as they proceeded with another rate cut this week. We expect two more rate cuts before the end of the year.
- Employment data for August showed modest job gains, but the details of the report indicate cooling in the labour market.
- Canada recorded a trade surplus in July, leaving net trade tracking to add modestly to third quarter growth in Canada.
U.S. – With Employment Slowing, The Time to Cut is Here
In a holiday shortened week, the labor market took center stage. Both the Job Opening and Labor Turnover Survey (JOLTS) and employment report were on the calendar. Given the Fed’s recent heighten focus on the second leg of its dual mandate – to promote maximum employment – the reports carried larger than usual significance. Notably, they provided a last look at top-tier labor market data before the Fed’s meeting on September 18th. Markets were generally down throughout the week. This morning’s employment report extended that trend as 10-year bond yields edged lower relative to last week’s close (-0.22 percentage points) and the S&P500 also dipped lower (-3.4%), as of the time of writing.
The increase in August’s payroll growth came in lower than anticipated and on a three-month basis, continued to head lower (Chart 1). Additionally, the figures for the prior two months were revised down. Despite this, there was some good news – the unemployment rate ticked down and annual growth in average hourly earnings edged up. Today’s payrolls report was a mixed bag, but overall, adds to the thesis that the labour market has eased off the gas. In a statement by Fed Governor Williams, following release of the report, he was clear in his believe that it was now appropriate to dial back policy restrictiveness. Further, speaking after the jobs data, Governor Waller pointed to starting rate cuts “carefully”, but was open to moving faster if the data warrant it.
In another sign of a cooling labor market, the more backward-looking JOLTS report revealed that job openings fell more than anticipated in July to 7.7 million. This marked the lowest level in more than three years. Additionally, the job openings to unemployed workers ratio declined to 1.1 from a high of 2 in early-2022. The job separation rate also ticked up in July after a dip in June, though it still remains relatively low. Overall, the JOLTS data suggests that the pandemic era of tightness in the labor market has receded and adds to the mounting evidence of cooling labor demand and a slowing economy.
On the production side, while the ISM Manufacturing Index managed to edge up in August, it remained in contraction territory for the fifth consecutive month and came in lower than analysts’ expectations. The sector continued to experience weakness in demand as both the new orders and new export orders indexes slid deeper into contraction. The ongoing weakness in the sector rekindled some concerns over the health of the economy. On the services side, however, things were a bit better, with the ISM Services Index coming in at 51.5 in August, up just slightly from 51.4 in July. Overall, the services sector continues to hold its ground, offsetting much of the weakness evident in the manufacturing sector (Chart 2).
With the employment numbers now a known variable, the Fed’s attention will be focused on the inflation data on tap for release next week. Barring any unforeseen flare-ups, all roads seem to lead to a quarter-point rate cut at the September meeting.
Canada – Signs Point to Continued Rate Cuts
The Bank of Canada’s interest rate decision on Wednesday was front and centre to start off September. As widely expected, the Bank of Canada reduced its benchmark rate by a quarter of a percent, in line with our expectation. Their statement recognized what we have been seeing in the data since their July rate reduction – economic activity has been softening, the labour market has been cooling, and inflation is slowing further towards its target. While the Bank of Canada has maintained a measured tone around inflation, we expect the weakening trends in the labour market and growth to be their focus in upcoming meetings. We continue to expect another 175 basis points in cuts through the end of next year, at a pace of a quarter point per meeting.
July’s trade data on Wednesday also showed some hints of softening that underscore the need for the Bank of Canada to continue on its rate reduction path. While Canada recorded a trade surplus for the month, this was on the back of declines in both import and export volumes, meaning that the surplus was driven by a combination of higher prices and greater weakness in imports than exports. Weakness in imports is often just another symptom of softening demand in the economy. There may be some brighter notes in the coming months’ trade data. While crude oil exports increased in July due to higher prices and a modest decline in volumes, we expect that volumes should be boosted in the coming months due to shipments from the newly operational Trans Mountain Pipeline (Chart 1). This is a spot to look for growth in next month’s report.
On Wednesday, the Bank of Canda noted that the labour market had continued to slow, with little change in employment in recent months. At the time, the data for June and July showed close to no monthly changes in total employment. The August data, released today, does complicate that story somewhat, showing a gain of 22k new positions – though this is not a statistically significant increase given the high volatility of this report. Also of note, all of the net new gains in employment in August were in part-time employment (Chart 2). More than that, the increases in full-time employment from the July data were reversed. Notwithstanding the relatively high volatility of the employment data, these are signs of a cooling labour market. Adding to this, labour force growth outpaced employment growth, leading to the unemployment rate to tick up to 6.6 percent. Wage growth moderated somewhat, though still rising at a healthy clip – average hourly wages in August were still up 5% from a year prior, compared to the long-run average of around 3%. Wage growth this high does mean that concerns about inflation are still relevant.
The combination of moderating wage growth, rising unemployment, and falling full-time employment is a clear signal that the labour market is cooling. When expectations for interest rates are as firmly entrenched as they are now, the main thing to look for is any signal that might upset those expectations – and we saw nothing to upset the apple cart this week. This week’s data were not game changers, leaving a clear case for the Bank of Canada to continue reducing interest rates.
Weekly Economic & Financial Commentary: Rate Cut at Sept. 18 FOMC Meeting, 25 bps or 50 bps?
Summary
United States: Rate Cuts Incoming
- The August jobs report did little to settle the debate if a 25 bps or 50 bps rate cut is coming this month. We're sticking with 50 bps, but acknowledge 25 bps as a real possibility. Firms continued to hire in August and the economy kept expanding. Attention is already turning to next week's CPI report for further clues on the degree of easing.
- Next week: NFIB Small Business Optimism Index (Tue.), CPI (Wed.)
International: Bank of Canada Cuts Interest Rates, Signals Further Easing to Come
- The Bank of Canada (BoC) cut its policy rate by 25 bps this week, citing downside risks to growth and an overall slowing in inflation. The central bank also signaled further easing, though given lingering concerns around elevated services inflation and wage growth, we expect a steady rather than accelerated pace of BoC rate cuts. In this week's economic figures, Brazil reported strong GDP growth, Australia soft GDP growth, China mixed August PMIs and Japan firm wage data.
- Next week: Brazil CPI (Tue.), U.K. Monthly GDP (Wed.), European Central Bank Rate Decision (Thu.)
Interest Rate Watch: Rate Cut at Sept. 18 FOMC Meeting: 25 bps or 50 bps?
- The weaker-than-expected labor market report for August kept a 50 bps rate cut at the Sept. 18 FOMC meeting firmly on the table. The size of the rate cut—25 bps or 50 bps—will depend crucially on August CPI data, scheduled for release next Wednesday.
Credit Market Insights: Tight Spreads Signal Optimism Despite Labor Market Worries
- Recent data have shown that spreads for investment-grade and high-yield corporate bonds have continued to tighten, signaling optimism for the future of the U.S. economy remains high. While spreads have generally been performing better, investors still remain cautious.
Topic of the Week: Inverted Yield Curve Era Nearing an End
- The spread between the yields on the 10-year Treasury and the 2-year Treasury notes, a popular recession indicator, turned positive for the first time in 26 months at the close on Wednesday. Yet, there are reasons to question the true predictive power of the yield curve on the likelihood of a recession in the real economy.