Sample Category Title
Analysis of XAU/USD: Gold Price Holds Near Key Resistance
As shown on the XAU/USD chart today, the price of gold is:
→ above the psychological level of $2,500 per ounce;
→ near a key resistance marked by a red line labelled Support 2. This line has been preventing further price growth several times since 20 August, when the all-time high was reached.
If the bulls manage to break through this line, it could turn into a support level, as happened with Support 1 (as indicated by arrows). This would set the stage for a potential rally within the upward channel, marked in blue. From a technical analysis perspective, a break above the “bull flag” pattern could signal a resumption of the uptrend.
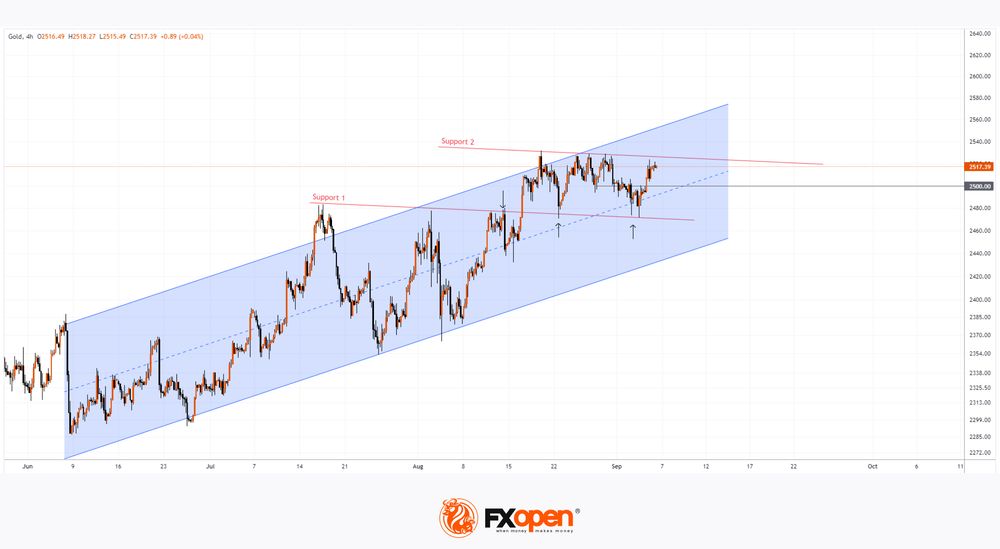
On the other hand, we can't rule out the possibility of a price reversal at Support 2. In this case, the chart could start to form a bearish “triple top” pattern from a technical standpoint.
Which scenario – bullish or bearish – will play out? Much depends on the fundamentals. Today at 15:30 GMT+3, US labour market data will be released, which is likely to have a strong impact on financial markets due to the upcoming Federal Reserve meeting, where a rate cut is expected.
Disappointing data on unemployment and job creation could indicate issues in the US economy and lead to a rise in gold prices, as gold is seen as a safe-haven asset during times of geopolitical tension and economic uncertainty.
Start trading commodity CFDs with tight spreads. Open your trading account now or learn more about trading commodity CFDs with FXOpen.
This article represents the opinion of the Companies operating under the FXOpen brand only. It is not to be construed as an offer, solicitation, or recommendation with respect to products and services provided by the Companies operating under the FXOpen brand, nor is it to be considered financial advice.
Market Analysis: GBP/USD Recovers While EUR/GBP Eyes Gains
GBP/USD is attempting a fresh increase from the 1.3090 zone. EUR/GBP is gaining pace and might extend its upward move above the 0.8440 zone.
Important Takeaways for GBP/USD and EUR/GBP Analysis Today
- The British Pound is attempting a recovery above the 1.3130 zone against the US Dollar.
- There was a break above a key bearish trend line with resistance at 1.3120 on the hourly chart of GBP/USD at FXOpen.
- EUR/GBP started a fresh increase above the 0.8420 resistance zone.
- There is a major rising channel forming with support near 0.8425 on the hourly chart at FXOpen.
GBP/USD Technical Analysis
On the hourly chart of GBP/USD at FXOpen, the pair started a fresh decline from the 1.3265 zone. The British Pound traded below the 1.3200 zone against the US Dollar.
A low was formed near 1.3090 and the pair is now attempting a recovery wave. There was a break above the 23.6% Fib retracement level of the downward move from the 1.3266 swing high to the 1.3088 low.
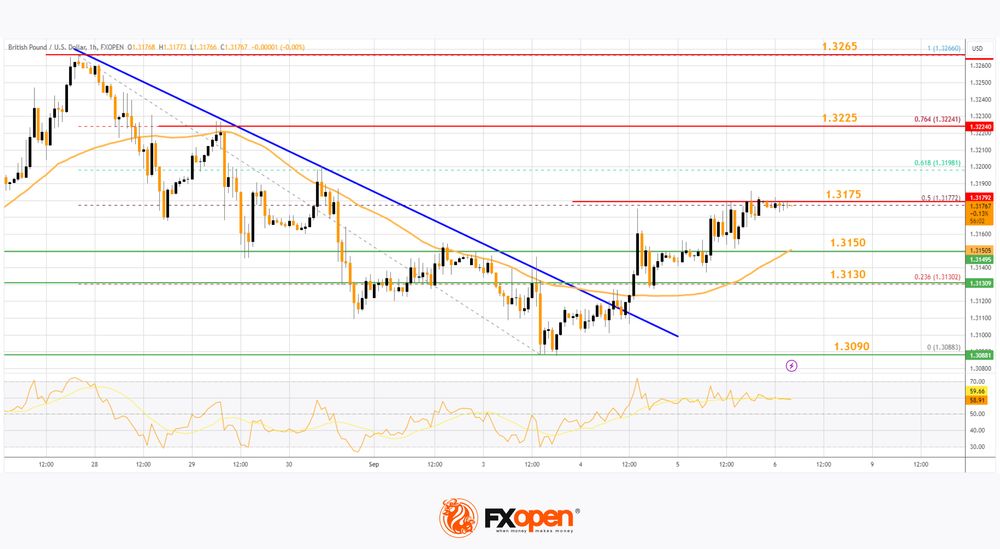
There was a break above a key bearish trend line with resistance at 1.3120, and the pair settled above the 50-hour simple moving average. On the upside, the GBP/USD chart indicates that the pair is facing resistance near 1.3175, and the 50% Fib retracement level of the downward move from the 1.3266 swing high to the 1.3088 low.
The next major resistance is near the 1.3225 level. If the RSI moves above 60 and the pair climbs above 1.3225, there could be another rally. In the stated case, the pair could rise toward the 1.3265 level or even 1.3320.
On the downside, there is a major support forming near 1.3150. If there is a downside break below the 1.3150 support, the pair could accelerate lower. The next major support is near the 1.3090 zone, below which the pair could test 1.3020. Any more losses could lead the pair toward the 1.3000 support.
EUR/GBP Technical Analysis
On the hourly chart of EUR/GBP at FXOpen, the pair started a fresh increase from the 0.8400 zone. The Euro traded above the 0.8420 level to move into a positive zone against the British Pound.
The EUR/GBP chart suggests that the pair settled above the 50-hour simple moving average and 0.8440. There was a clear move above the 50% Fib retracement level of the downward move from the 0.8467 swing high to the 0.8399 low.
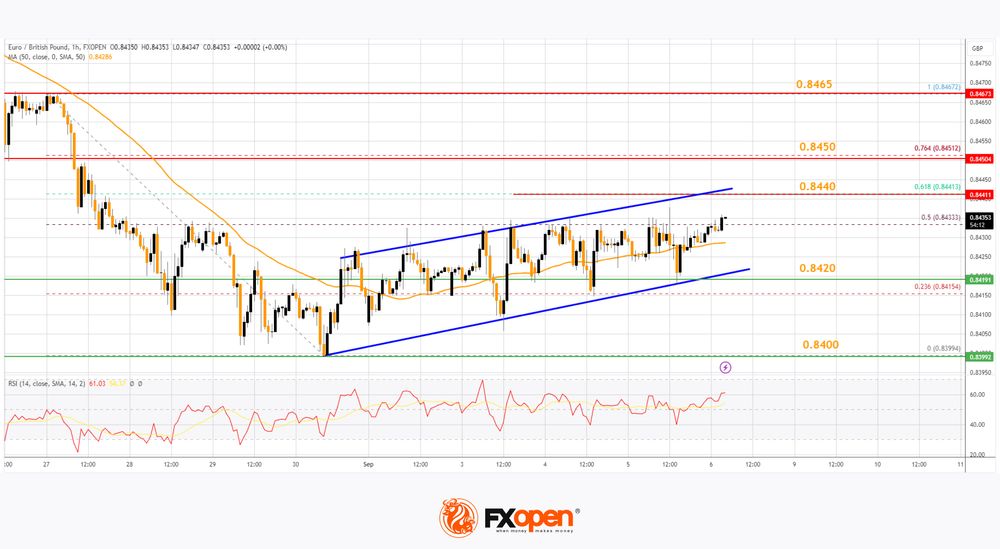
Immediate resistance is near 0.8440 or the 61.8% Fib retracement level of the downward move from the 0.8467 swing high to the 0.8399 low.
The next major resistance for the bulls is near the 0.8450 zone. A close above the 0.8450 level might accelerate gains. In the stated case, the bulls may perhaps aim for a test of 0.8465. Any more gains might send the pair toward the 0.8500 level in the coming days.
Immediate support sits near a key rising channel at 0.8425. The next major support is near the 0.8400 zone. A downside break below the 0.8400 support might call for more downsides.
In the stated case, the pair could drop toward the 0.8365 support level. Any more losses might send the pair toward the 0.8340 level in the near term.
Trade over 50 forex markets 24 hours a day with FXOpen. Take advantage of low commissions, deep liquidity, and spreads from 0.0 pips. Open your FXOpen account now or learn more about trading forex with FXOpen.
This article represents the opinion of the Companies operating under the FXOpen brand only. It is not to be construed as an offer, solicitation, or recommendation with respect to products and services provided by the Companies operating under the FXOpen brand, nor is it to be considered financial advice.
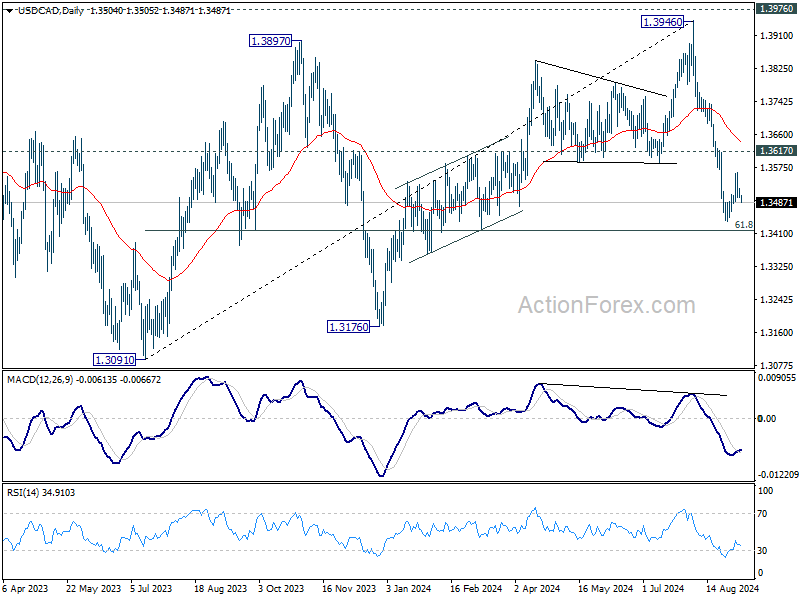
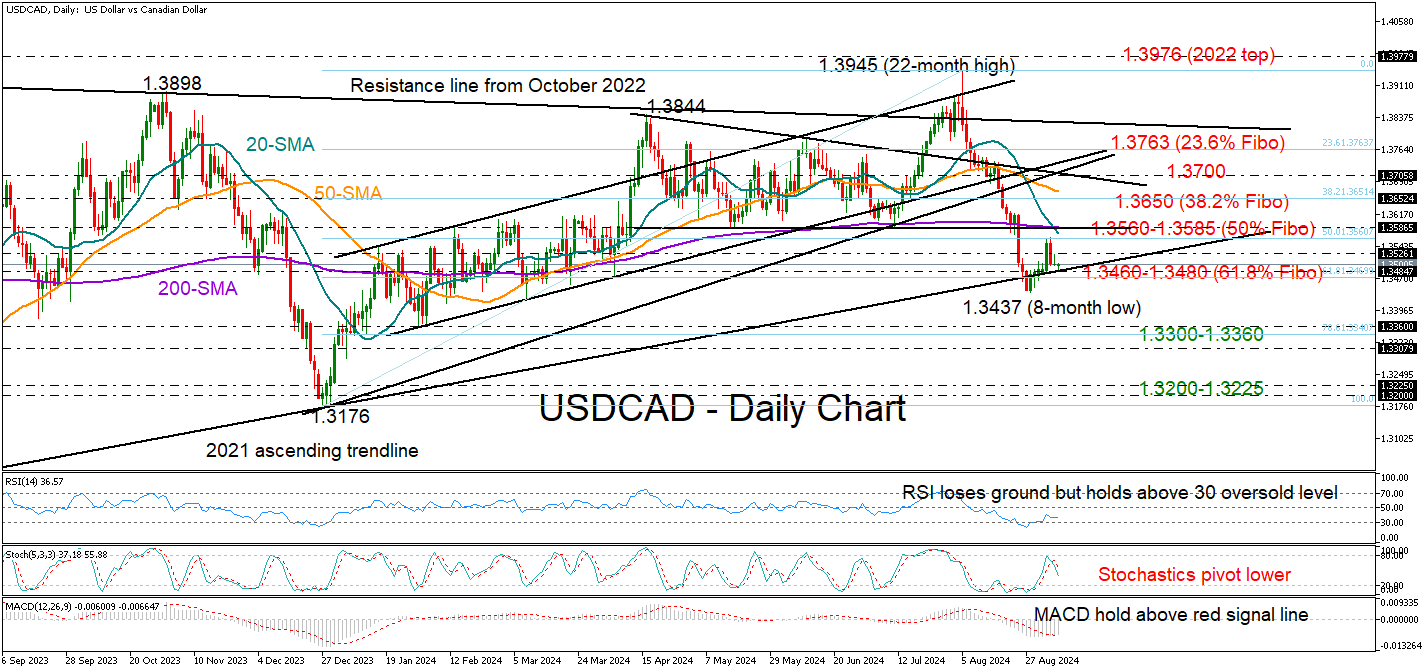
USDCAD Doubts September’s Upturn
- USDCAD trims September’s uptick to trade near key trendline
- Technical signals are mixed; a break below 1.3480 could shift the bias to the downside
- US & Canadian employment figures due at 12:30 GMT
USDCAD started Friday’s NFP session with soft negative momentum after a stagnant day, which prevented the pair from examining its weekly high of 1.3564.
While the technical indicators have barely shown any improvement, there is still a chance for a positive turnaround as long as the RSI maintains its rebound off its 30 oversold level and the MACD holds above its red signal line. Encouragingly, the price itself seems to have created a green doji candlestick on Thursday, but the candlestick pattern still needs confirmation.
A decisive close below 1.3480 and beneath the 61.8% Fibonacci retracement of the December-July upleg could renew selling pressures. If the 1.3437 low gives way as well, the price could dive towards the 50% Fibonacci of 1.3360 and the support trendline, which connects the lows from July and December 2023 seen at 1.3300. Another move lower could shift the spotlight the 1.3200-1.3225 constraining zone.
If there is some bullish action on the other hand, there could be an initial retest of the 50% Fibonacci level at 1.3560, which has been a barrier for bullish activity earlier this week. Then, strong buying will be necessary for the pair to overcome the 1.3585 region, the flattening 200-day SMA, and ultimately reach the 38.2% Fibonacci mark of 1.3650. Even higher, a tougher battle could take place between 1.3700 and the 23.6% Fibonacci of 1.3763.
In brief, USDCAD is in a wait-and-see mode ahead of the US and Canadian jobs data. A sustainable decline below 1.3480 could heighten negative risks.
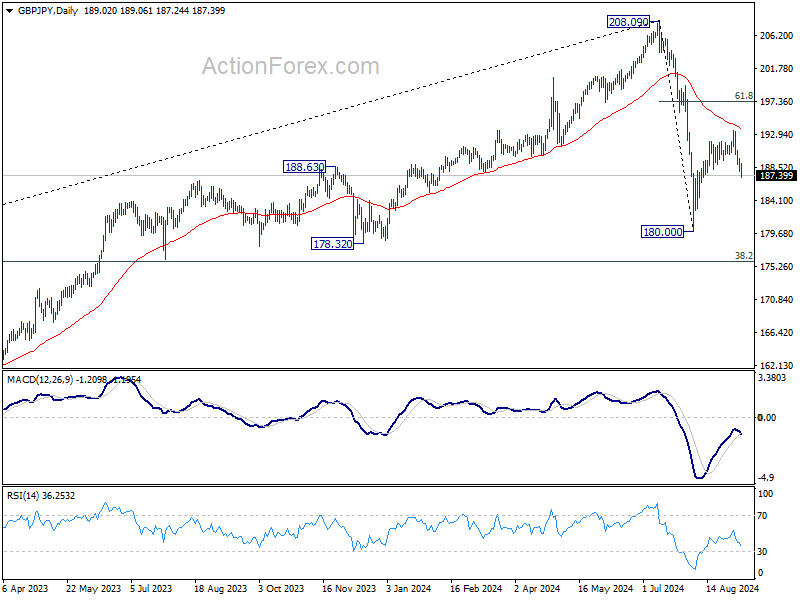
GBP/JPY Daily Outlook
Daily Pivots: (S1) 188.18; (P) 188.98; (R1) 189.90; More...
GBP/JPY's break of 188.23 support suggests that rebound from 180.00 has already completed at 193.45, ahead of 55 D EMA. Intraday bias is back on the downside for retesting 180.00. Firm break there will resume whole fall from 208.09. For now, risk will stay on the downside as long as 193.45 resistance holds, in case of recovery.
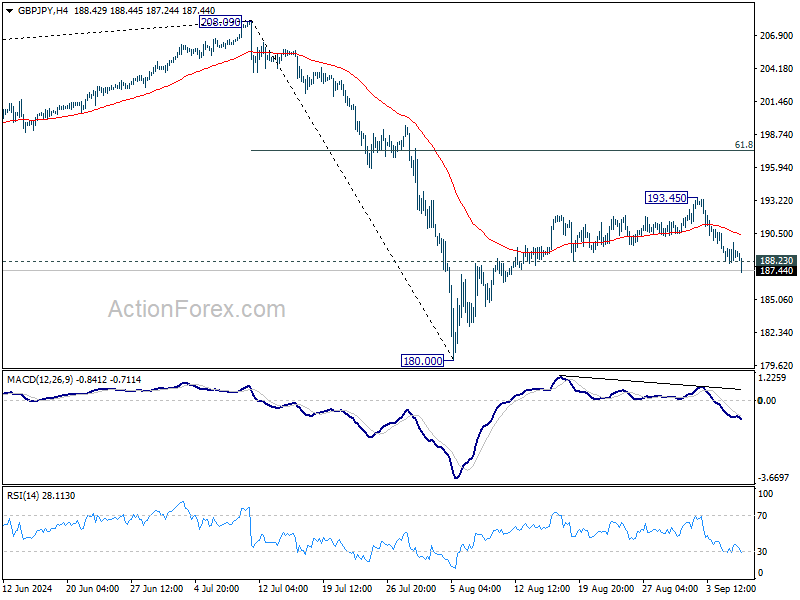
In the bigger picture, price actions from 208.09 are seen as a correction to whole rally from 123.94 (2020 low). Current development suggests that the first leg has completed and the range of medium term consolidation should be set between 38.2% retracement of 123.94 to 208.09 at 175.94 and 208.09.
EUR/JPY Daily Outlook
Daily Pivots: (S1) 158.70; (P) 159.24; (R1) 159.93; More....
EUR/JPY's fall from 163.86 continues today and intraday bias stays on the downside. Deeper fall would be seen to retest 154.40 low first. Firm break there will resume whole fall from 175.41. On the upside, above 160.01 support turned resistance will turn intraday bias neutral first.
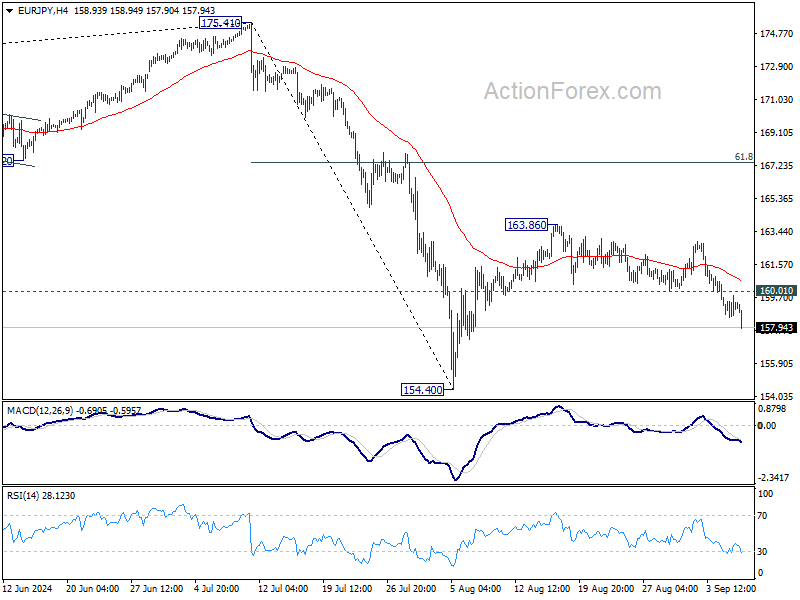
In the bigger picture, price actions from 175.41 are seen as correction to rally from 114.42 (2020 low). Current development suggests that the first leg has completed. The range of consolidation should be seen between 38.2% retracement of 114.42 to 175.41 at 152.11 and 175.41 high.

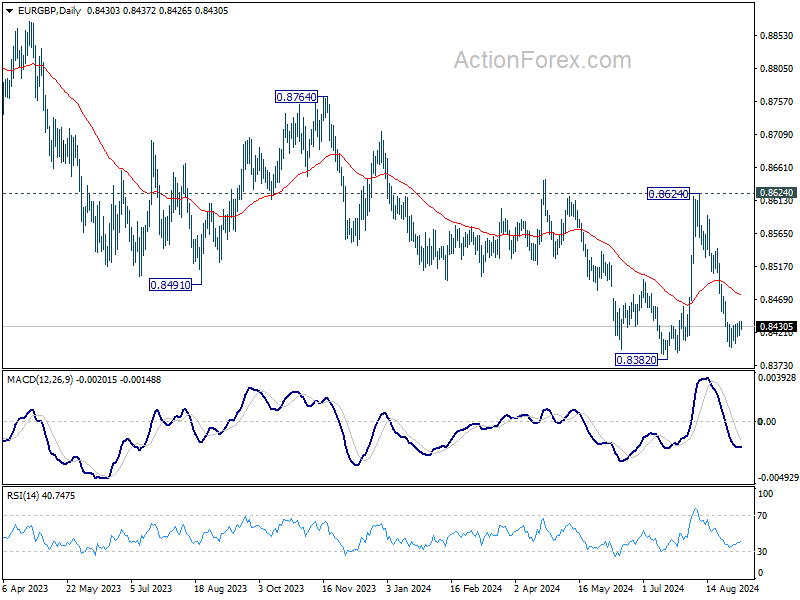
EUR/GBP Daily Outlook
Daily Pivots: (S1) 0.8419; (P) 0.8429; (R1) 0.8439; More...
EUR/GBP is staying in consolidation from 0.8399 and intraday bias remains neutral. While stronger recovery cannot be ruled out, further decline is expected as long as 0.8466 minor resistance holds. Below 0.8399 will resume the fall from 0.8624 and target 0.8382 support. Firm break there will resume larger down trend.
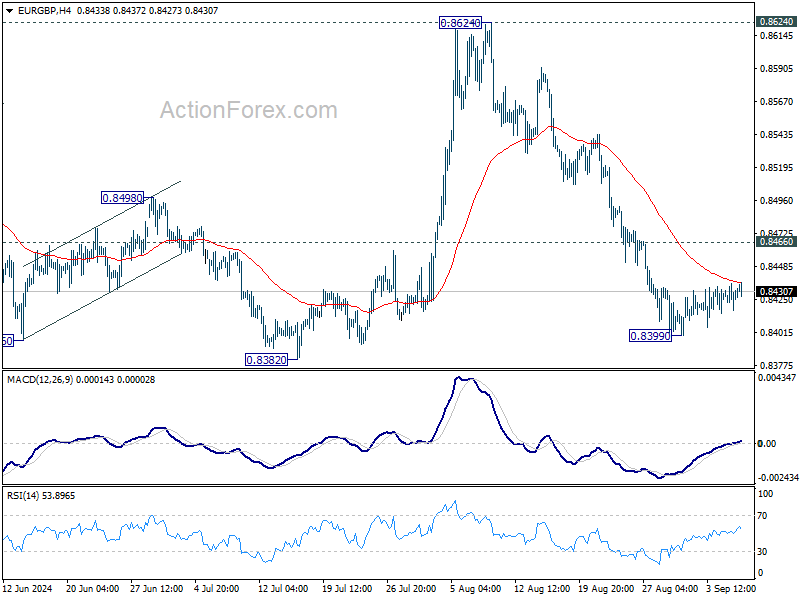
In the bigger picture, as long as 0.8624 resistance holds, down trend from 0.9267 is expected to continue. Firm break of 0.8382 will target 0.8201 (2022 low). However, decisive break of 0.8624 will indicate that such down trend has completed, and turn outlook bullish for 0.8764 resistance next.
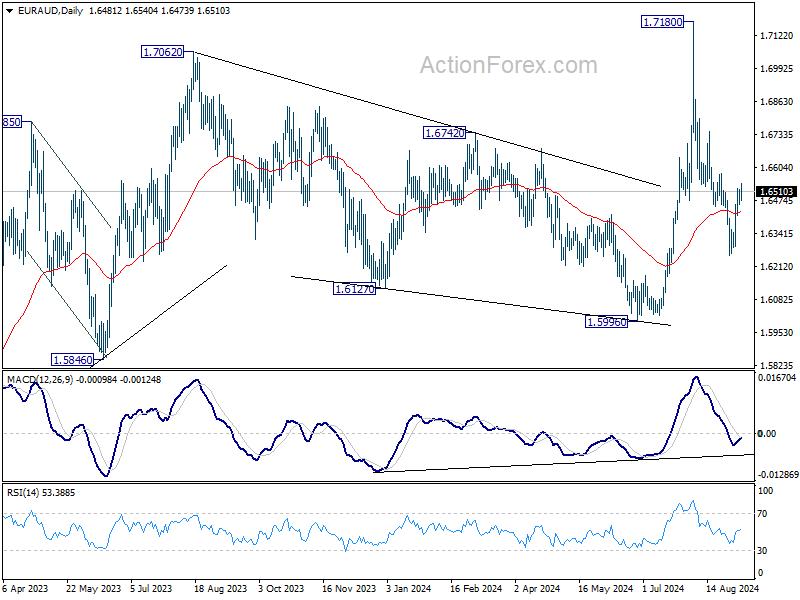
EUR/AUD Daily Outlook
Daily Pivots: (S1) 1.6442; (P) 1.6482; (R1) 1.6522; More...
EUR/AUD is bounded in range of 1.6256/6580 and intraday bias stays neutral. With 1.6580 resistance intact, fall from 1.7180 is still in favor to continue. On the downside, break of 1.6256 support will target 1.5996 key support level next. However, decisive break of 1.6580 will turn bias back to the upside for stronger rebound.
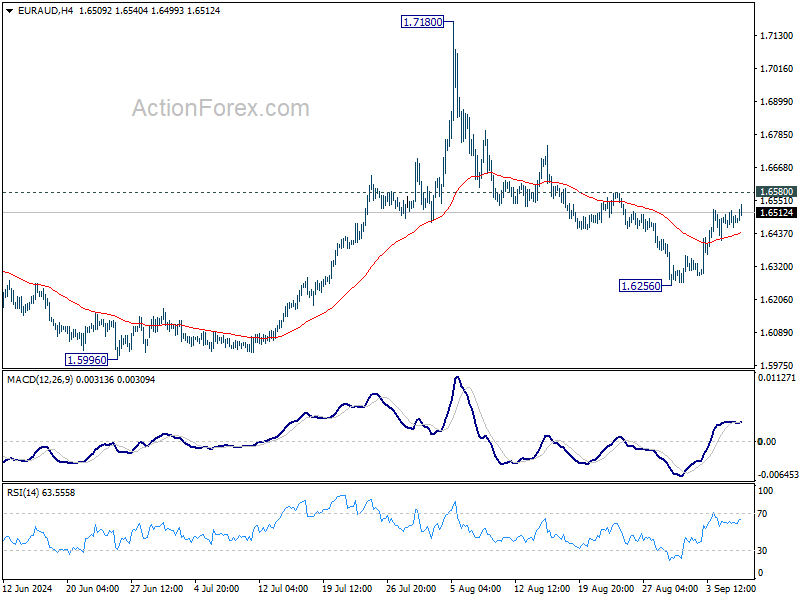
In the bigger picture, outlook is mixed up by the deeper than expected fall from 1.7180. Yet as long as 1.5996 support holds, up trend from 1.4281 (2022 low) is still expected to resume at a later stage. Firm break of 1.7180 will pave the way to 61.8% projection of 1.4281 to 1.7062 from 1.5996 at 1.7715.
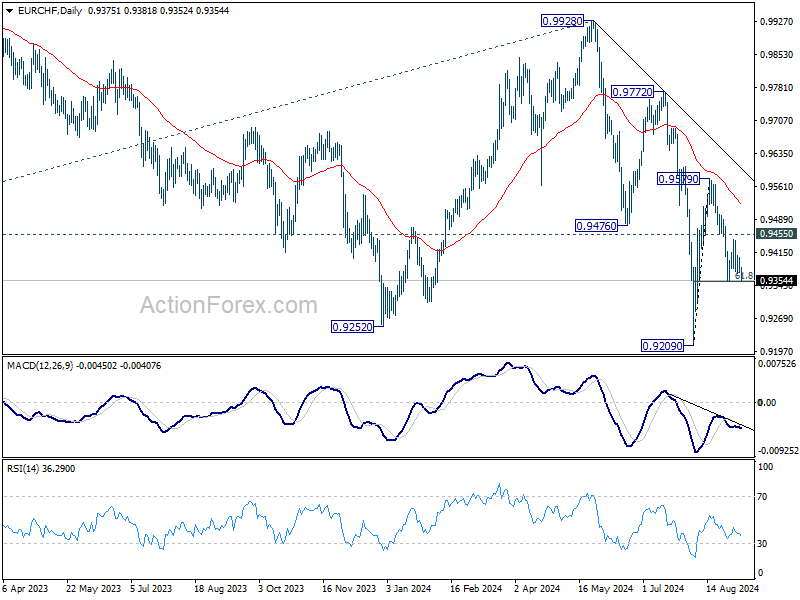
EUR/CHF Daily Outlook
Daily Pivots: (S1) 0.9364; (P) 0.9386; (R1) 0.9399; More....
Intraday bias in EURCHF remains neutral with focus on 0.9351 support. Firm break there, will resume the decline from 0.9579 to retest 0.9209 low. Further decline will remain in favor as long as 0.9455 resistance holds, in case of recovery.
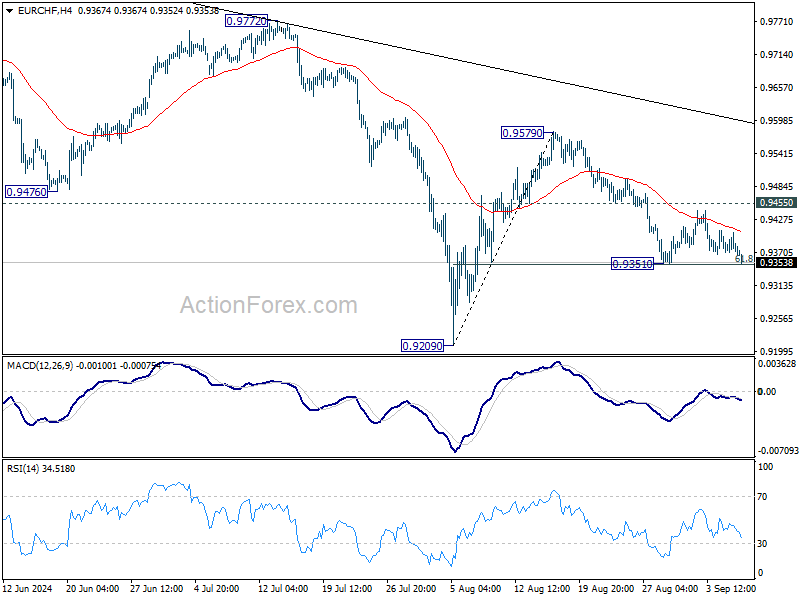
In the bigger picture, medium term corrective pattern from 0.9407 (2022 low) might have completed with three waves to 0.9928. Decisive break of 0.9252 (2023 low) will confirm long term down trend resumption. Next target will be 61.8% projection of 1.1149 to 0.9407 from 0.9928 at 0.8851. For now, outlook will stay bearish as long as 0.9928 resistance holds, even in case of strong rebound.
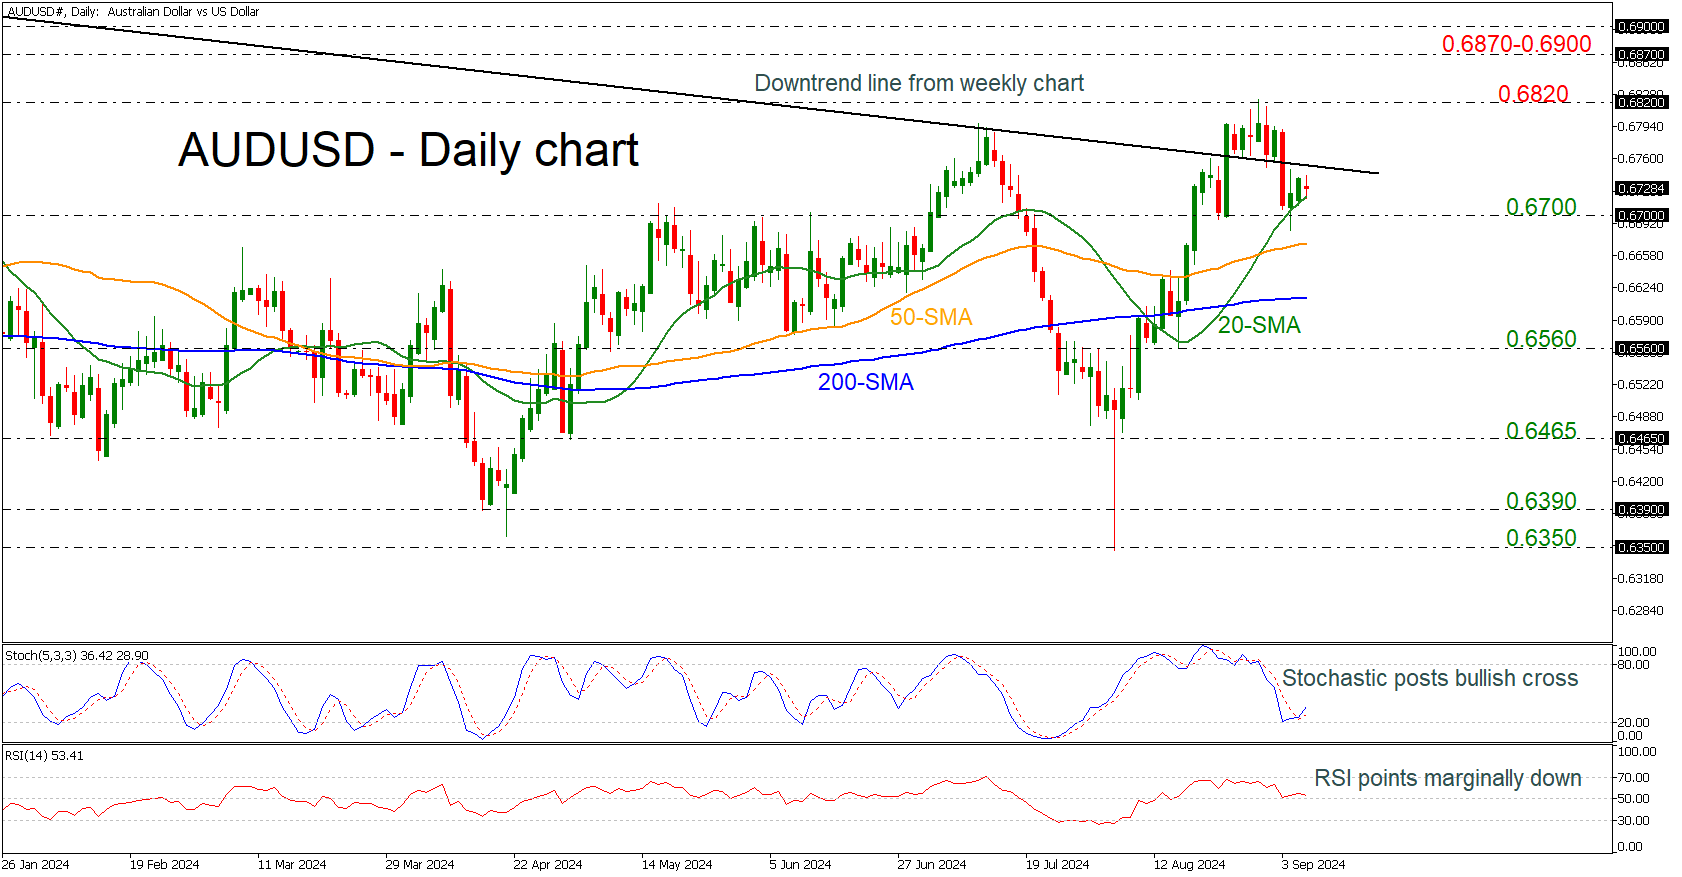
AUDUSD Bounces Off 0.6700 But Looks Weak
- AUDUSD flirts with weekly downtrend line
- Stochastics create bullish cross
- But RSI holds near neutral level
AUDUSD has reversed to the upside after the rebound off the 0.6700 round number with strong barrier coming from the weekly descending trend line around 0.6750. Over the last couple of weeks, the market has been developing back and forth of the aforementioned diagonal line, looking weak to change the outlook to a more positive one.
Technically, the stochastic oscillator posted a bullish crossover within its %K and %D lines above the oversold region; however, the RSI is heading down mirroring the latest red candle.
In case of another run above the 0.6750 level, then the market could re-challenge the 0.6820 resistance ahead of the restrictive region of 0.6870-0.6900.
On the flip side, a closing session beneath the 0.6700 mark could open the door to 50-day simple moving average (SMA) at 0.6670 ahead of the 200-day SMA at 0.6615. The latter level would be another tough obstacle to overcome before hitting the 0.6560 support.
Turning to the medium-term picture, the bearish outlook came back into play after the bridge back to the downside of the descending trend line. A jump above that point would restore the bullish mode. For a bull market though, traders need to wait for a clear close above 0.6900.
USD/CAD Daily Outlook
Daily Pivots: (S1) 1.3492; (P) 1.3509; (R1) 1.3519; More...
USD/CAD is still bounded in consolidation above 1.3439 and intraday bias remains neutral. With 1.3618 resistance intact, further decline is expected. On the downside, break of 1.3439 and sustained trading below 61.8% retracement of 1.3091 to 1.3946 at 1.3418 will pave the way to 1.3091/3176 support zone next. However, firm break of 1.3617 will confirm short term bottoming and turn bias back to the upside for stronger rebound.
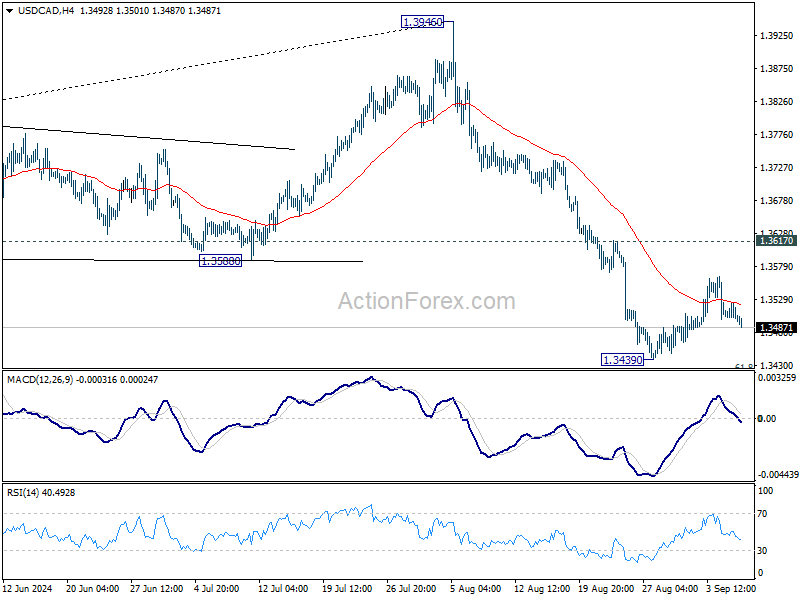
In the bigger picture, current development suggests that corrective pattern from 1.3976 (2022 high) is extending with another falling leg. While deeper decline could be seen, strong support should emerge above 1.2947 resistance turned support to bring rebound. Rise from 1.2005 (2021 low) is still in favor to resume at a later stage.