
Sample Category Title
EUR/USD Mid-Day Outlook
Daily Pivots: (S1) 1.1160; (P) 1.1175; (R1) 1.1200; More....
EUR/USD's retreat from 1.1200 extends lower today, but stays well above 1.1007 resistance turned support. Intraday bias remains neutral first and further rally is still in favor. On the upside, break of 1.1200 will resume recent rally to 161.8% projection of 1.0665 to 1.0947 from 1.0776 at 1.1232, and then 1.1274 high.
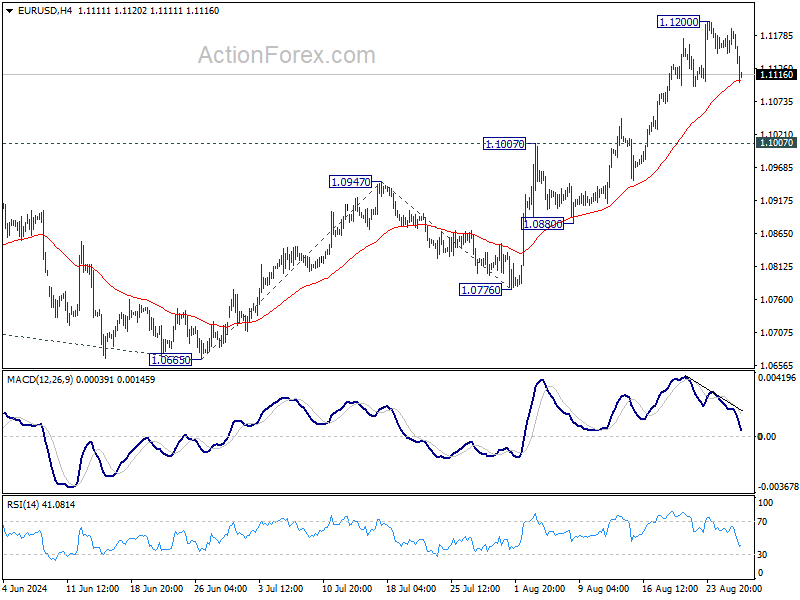
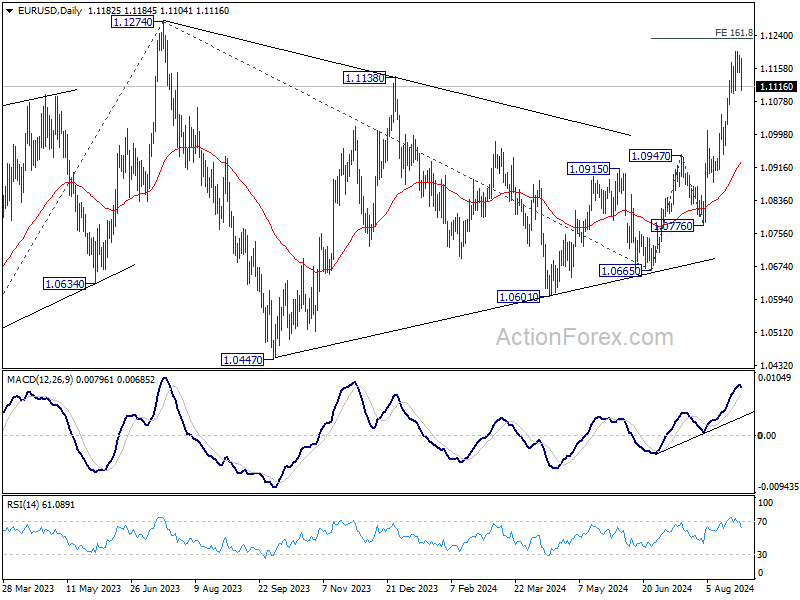
In the bigger picture, break of 1.1138 resistance indicates that corrective pattern from 1.1274 has completed at 1.0665 already. Decisive break of 1.1274 (2023 high) will confirm whole up trend from 0.9534 (2022 low). Next target will be 61.8% projection of 0.9534 to 1.1274 from 1.0665 at 1.1740. This will now be the favored case as long as 1.0947 resistance turned support holds.
Euro Under Siege as Dollar Stages Recovery
Euro is facing significant selling pressure today, with its recent decline gaining momentum. Fresh data from ECB paints a grim picture: bank lending growth in July was notably sluggish, failing to meet even historical averages. Meanwhile, money growth, which had shown signs of improvement in prior months, remained stagnant with M3 increasing by just 2.3% year-over-year.
The prevailing market expectation is that ECB will implement two additional rate cuts this year, in September and December. However, as Germany’s economic woes deepen, with the real threat of a recession on the horizon, speculation is growing that ECB might be forced to consider yet another rate reduction beyond what is currently anticipated.
Meanwhile, Dollar is staging a broad recovery, though its trajectory is likely to be influenced by Nvidia's earnings and the subsequent impact on overall market sentiment. Despite some market participants betting on a total of 100bps in rate cuts by Fed this year, such expectations is overly ambitious. Unless next week’s non-farm payroll report is unexpectedly weak, Fed is still likely to proceed with a modest 25bps cut at its September meeting.
As the week progresses, Euro is emerging as the weakest performer, followed by Australian Dollar and Japanese Yen. In contrast, Swiss Franc is leading the charge, with Canadian Dollar and New Zealand Dollar also showing relative strength. Dollar and British Pound are positioned somewhere in the middle of the performance spectrum.
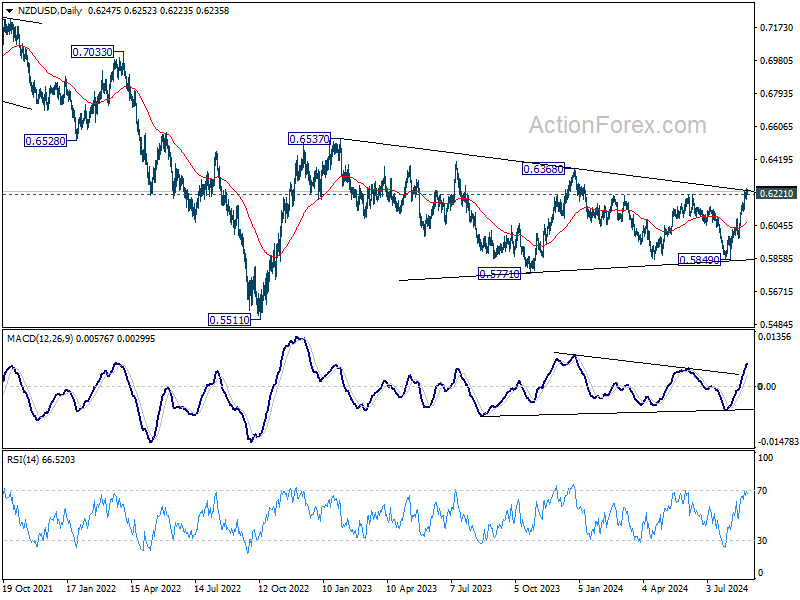
Technically, NZD/USD is now at a juncture after breaking through 0.6221 resistance last week. Decisive break of falling trend line resistance will strength the case that consolidation from 0.6537 has already completed. That is, rise form 0.5511 (2022 low) could be ready to resume through 0.6537 in the medium term. Tomorrow’s ANZ business confidence data could be the catalyst needed for the Kiwi to break through the trendline with conviction.
In Europe, at the time of writing, FTSE is down -0.24%. DAX is up 0.73%. CAC is up 0.37%. UK 10-year yield is down -0.0041 at 3.974. Germany 10-year yield is down -0.037 at 2.257. Earlier in Asia, Nikkei rose 0.22%. Hong Kong HSI fell -1.02%. China Shanghai SSE fell -0.40%. Singapore Strait Times fell -0.22%. Japan 10-year JGB yield rose 0.0147 to 0.895.
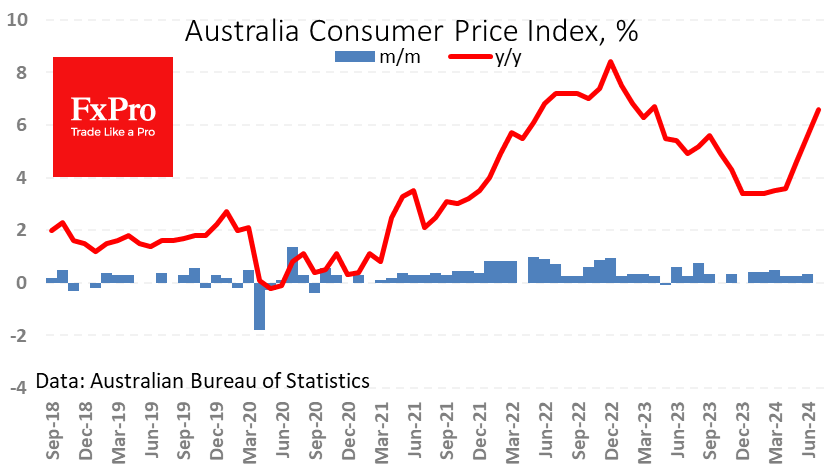
Australia's monthly CPI slows to 3.5% in Jul, slightly above expectations
Australia's monthly CPI inflation slowed from 3.8% yoy in June to 3.5% yoy in July, above the expected 3.4% yoy. CPI excluding volatile items and holiday travel also eased, dropping from 4.0% yoy to 3.7% yoy. Additionally, the annual trimmed mean CPI, a measure that smooths out irregular price fluctuations, decreased from 4.1% yoy to 3.8% yoy.
The most significant contributors to the price increases were housing (+4.0%), food and non-alcoholic beverages (+3.8%), alcohol and tobacco (+7.2%), and transport (+3.4%). These sectors continue to exert upward pressure on inflation, despite the overall slowing trend.
BoJ's Himino signals readiness for further rate hikes if economic confidence grows
BoJ Deputy Governor Ryozo Himino reaffirmed the central bank's commitment to adjusting its monetary policy if confidence in the economic outlook strengthens. In a speech, Himino stated that if BoJ gains "growing confidence" in its economic and price forecasts, it "will adjust the degree of monetary accommodation," signaling readiness for rate hikes ahead.
Himino outlined the baseline scenario for fiscal 2025 and 2026, describing it as a "reasonably balanced state" where inflation aligns with the price stability target, and economic growth "slightly above cruising speed". However, he cautioned against two risk scenarios: one where inflation remains above 2% and another where it falls well below 2% and fails to recover.
Addressing recent financial market volatility, Himino noted that Yen's appreciation might ease the import cost pressures faced by small and medium-sized enterprises, though it could reduce yen-denominated profits for export industries. He reassured that Japanese firms have developed competitive strengths. Stock price volatilities, while influential, should not significantly undermine business sentiment.
EUR/USD Mid-Day Outlook
Daily Pivots: (S1) 1.1160; (P) 1.1175; (R1) 1.1200; More....
EUR/USD's retreat from 1.1200 extends lower today, but stays well above 1.1007 resistance turned support. Intraday bias remains neutral first and further rally is still in favor. On the upside, break of 1.1200 will resume recent rally to 161.8% projection of 1.0665 to 1.0947 from 1.0776 at 1.1232, and then 1.1274 high.
In the bigger picture, break of 1.1138 resistance indicates that corrective pattern from 1.1274 has completed at 1.0665 already. Decisive break of 1.1274 (2023 high) will confirm whole up trend from 0.9534 (2022 low). Next target will be 61.8% projection of 0.9534 to 1.1274 from 1.0665 at 1.1740. This will now be the favored case as long as 1.0947 resistance turned support holds.
Economic Indicators Update
| GMT | Ccy | Events | Actual | Forecast | Previous | Revised |
|---|---|---|---|---|---|---|
| 01:30 | AUD | Construction Work Done Q2 | 0.10% | 0.70% | -2.90% | |
| 01:30 | AUD | Monthly CPI Y/Y Jul | 3.50% | 3.40% | 3.80% | |
| 08:00 | CHF | UBS Economic Expectations Aug | -3.4 | 9.4 | ||
| 08:00 | EUR | Eurozone M3 Money Supply Y/Y Jul | 2.30% | 2.80% | 2.20% | 2.30% |
| 14:30 | USD | Crude Oil Inventories | -2.7M | -4.6M |
Gold Price Outlook: $2500/oz Back in Focus as US Dollar Index (DXY) Bounces
- Gold prices hover around $2500/oz as the DXY strengthens, with markets awaiting key data amidst geopolitical tensions.
- Gold ETFs see continued inflows, marking a fourth consecutive month of gains, signaling sustained investor interest.
- Technical analysis reveals a bearish triangle pattern on the Gold chart, suggesting a potential price decline.
Gold prices have returned to $2500/oz as the DXY started the day strong. Geopolitical tensions have taken a backseat while markets anticipate this week’s data. Gold ETFs experienced modest inflows last week, continuing a trend that began in May, with inflows totaling around 8 metric tonnes ($403 million), setting the stage for a fourth consecutive month of growth.
Market participants are closely watching Nvidia’s earnings release later today, which could spark volatility and influence broader markets. Additionally, the upcoming PCE data on Friday could be pivotal in determining gold’s trajectory by the week’s end.
The rally in the US Dollar this morning could be attributed to various factors, including end-of-month re balancing by investors. With expectations of 100 bps in rate cuts, the question arises: Have these cuts already been priced into the market?
US Dollar Index Daily Chart, August 28, 2024
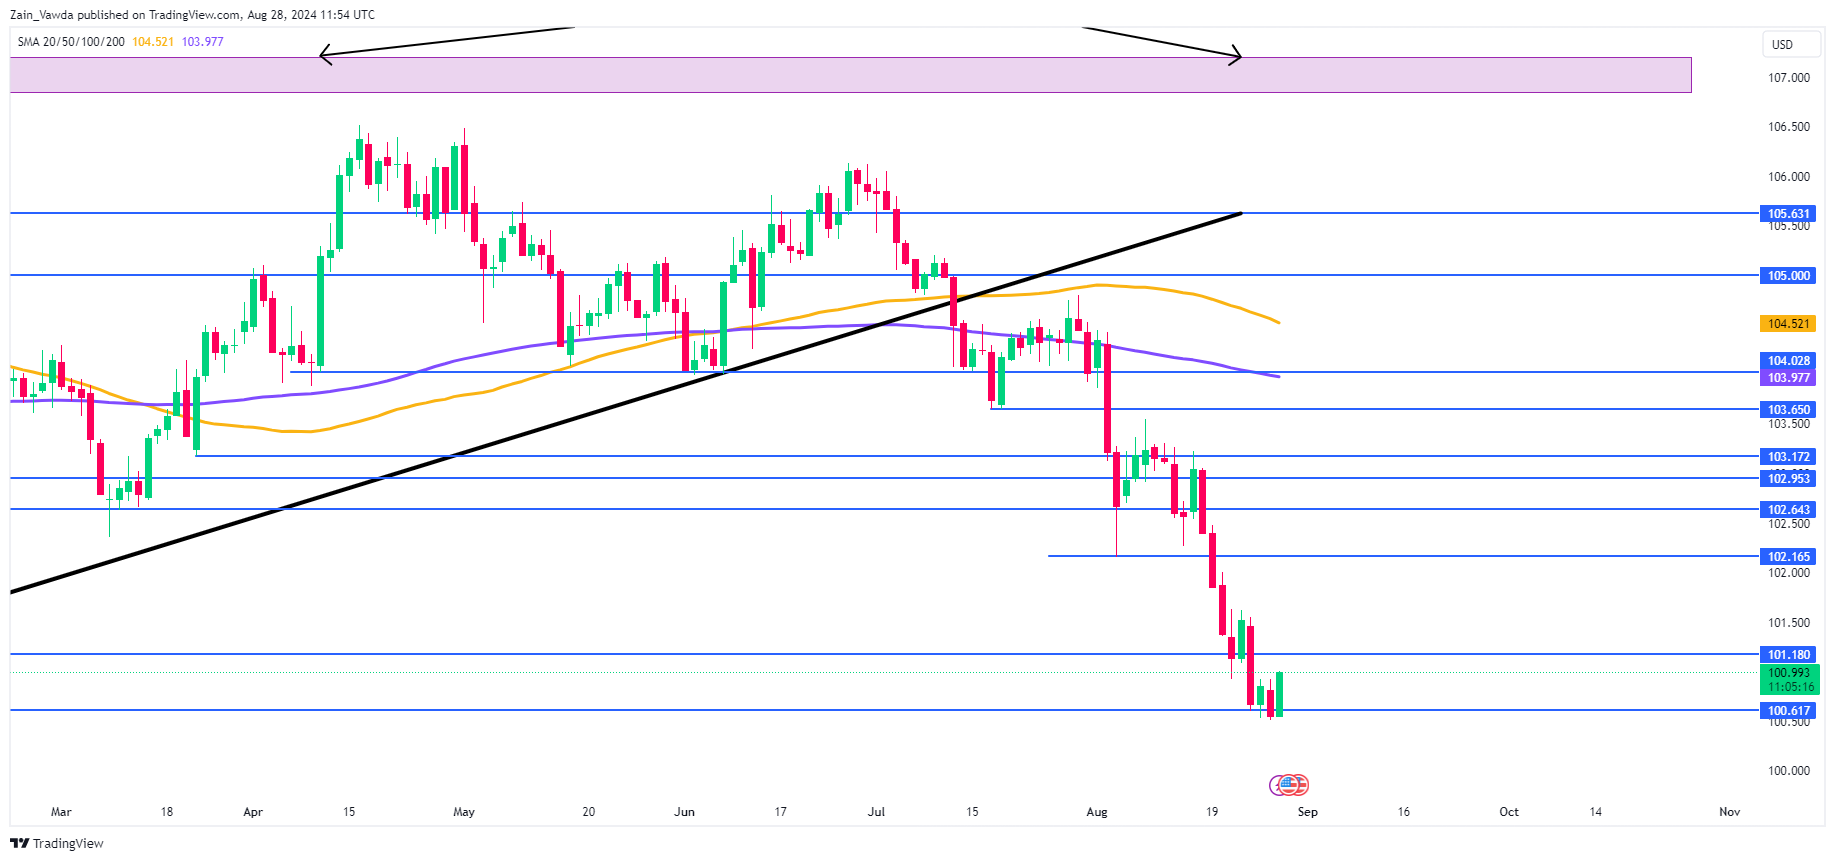
Source:TradingView
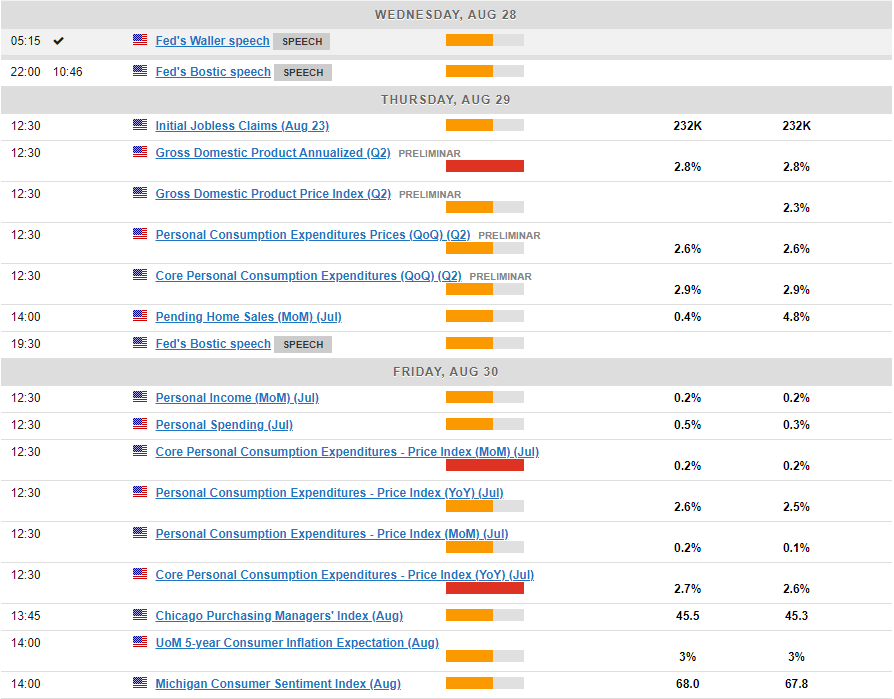
On the data front, it’s another quiet day for US economic data with the highlight being comments from Federal Reserve policymaker Rafael Bostic. It will be interesting to gauge where the Atlanta Fed President stands regarding a potential 50 bps rate cut in September.
Any hint that Bostic is in favor of a 50 bps cut could add to the dollar’s woes and likely lead to a renewed selloff. Whether this will last however remains to be seen given the US data on Thursday and Friday.
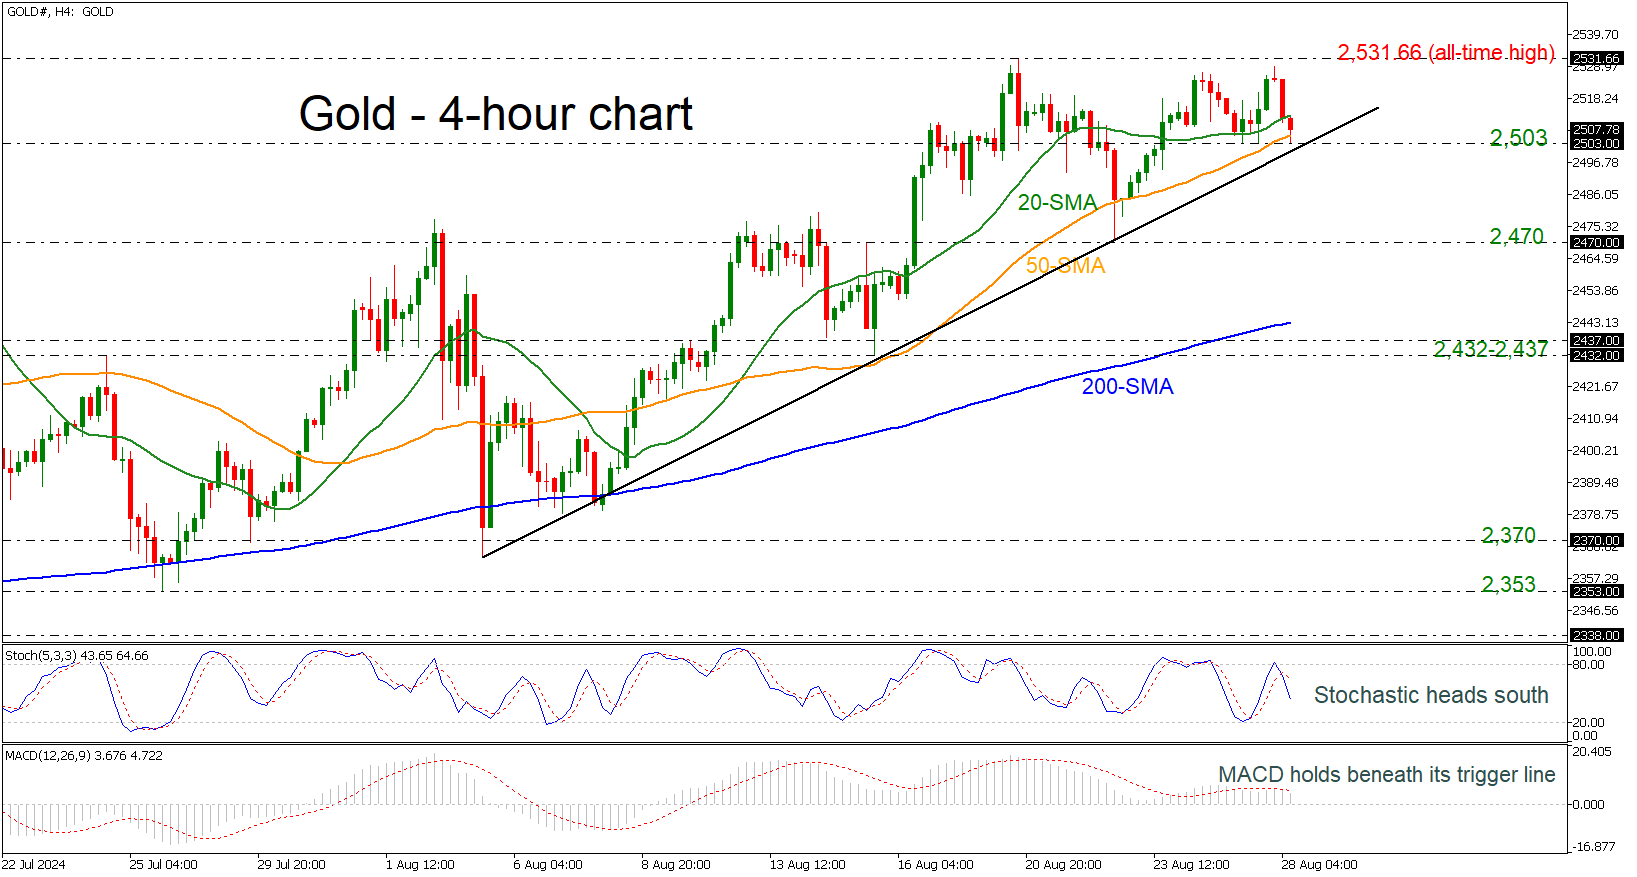
Technical Analysis Gold (XAU/USD)
From a technical perspective, the four-hour Gold chart is currently noteworthy. During the US session yesterday, Gold surged close to its all-time high and appeared set to climb further overnight as the Dollar Index weakened.
However, this morning witnessed a rebound in the US Dollar, which has contributed to a $30 decline in Gold prices, bringing them back to the $2500/oz level.
The H4 chart reveals an intriguing triangle pattern that has decisively broken to the downside. This breakout suggests a potential $60-$70 decline in gold prices, targeting support near the $2440/oz mark according to the pattern’s guideline.
Nonetheless, geopolitical risks remain a concern, as previous technical patterns have failed to manifest as expected for this precious metal. Will this instance prove to be different?
GOLD (XAU/USD) Four-Hour (H4) Chart, August 28, 2024
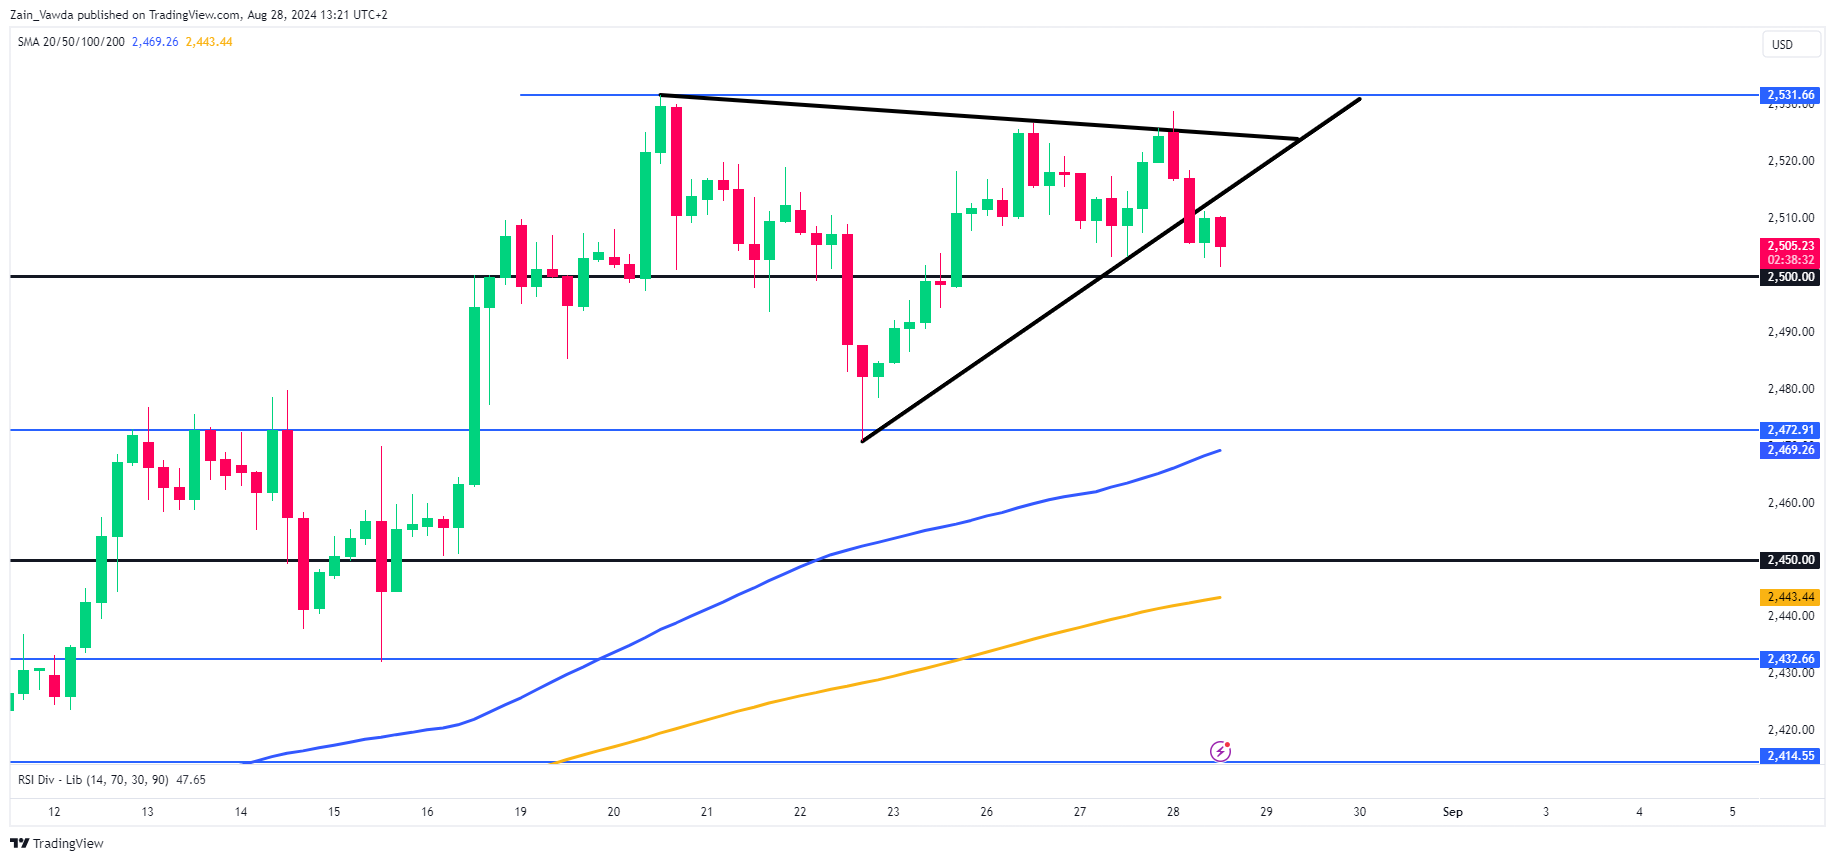
Source: TradingView (click to enlarge)
Support
- 2484
- 2472
- 2450
Resistance
- 2514
- 2531.66
- 2550
Aussie Tries to Escape from Down Under
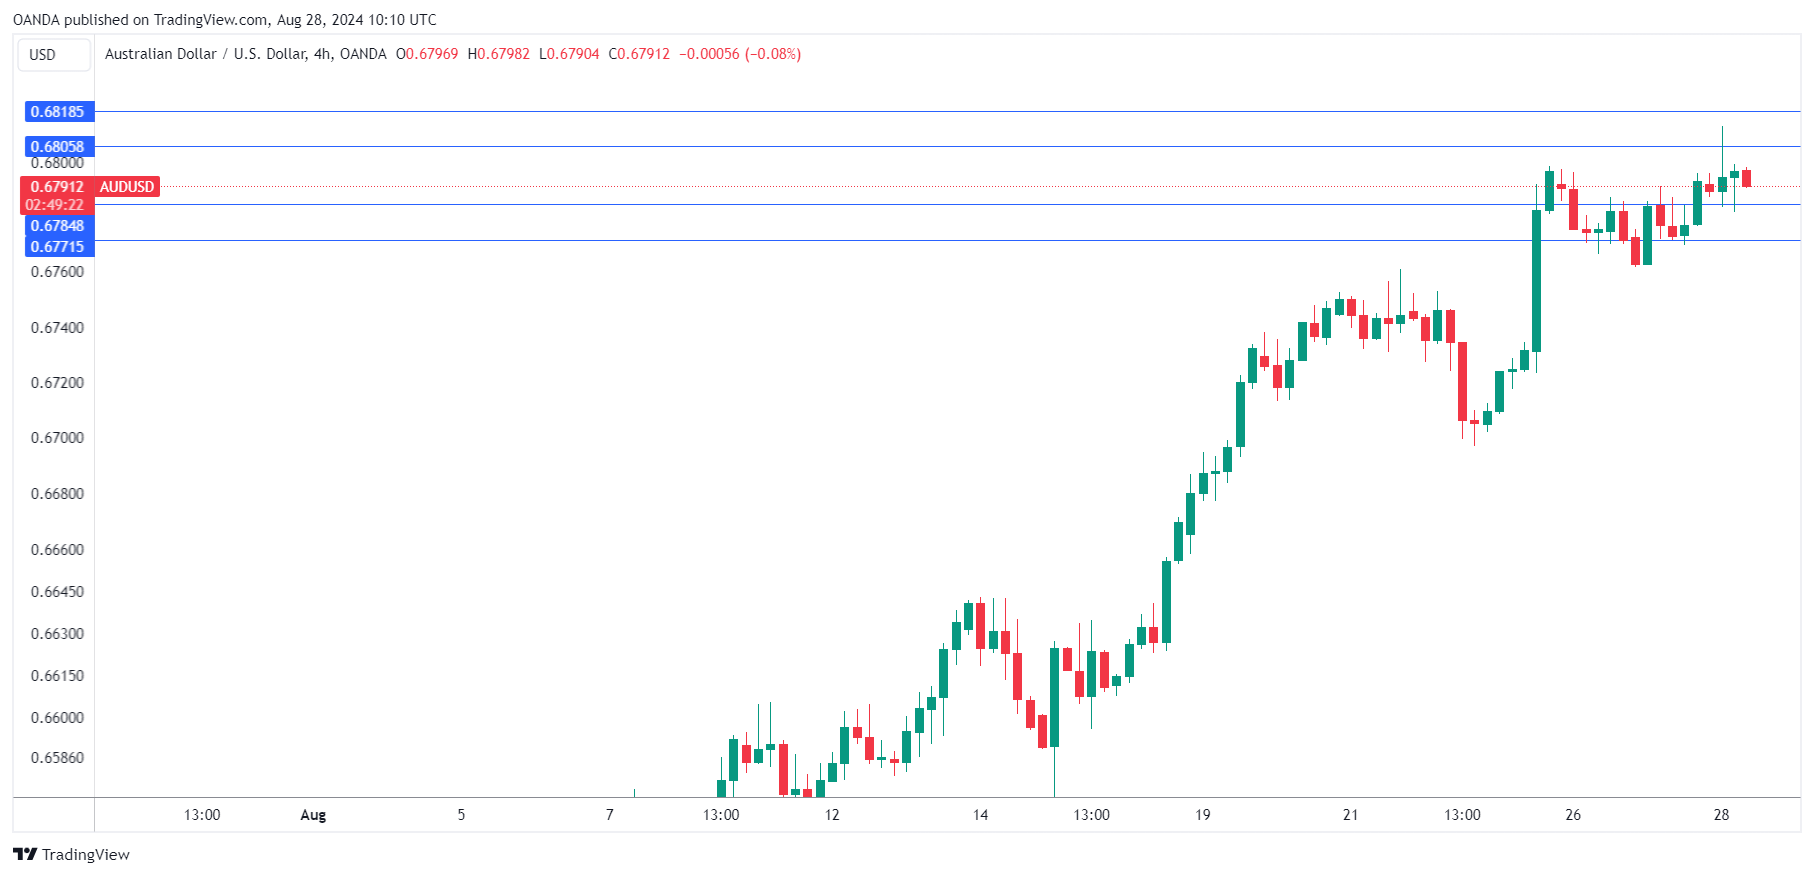
The Australian dollar hit its highest level since December 2023 against the US dollar, briefly topping 0.6800 following the release of the monthly inflation report.
The Australian Bureau of Statistics reported that consumer price growth slowed to 3.5% y/y in July from 3.8% the previous month. Despite the slowdown, this indicator was higher than the expected 3.4%, further reducing the chances of a quick monetary policy reversal. Key drivers were housing costs (4%), food and non-alcoholic beverages (3.8%) and tobacco and alcohol (+7.2%).
Australia also took measures to combat rising house prices by restricting the number of international students. In addition, electricity bill rebates were resumed in July (-5.1% y/y vs. +7.1% y/y in June). With these measures in place, inflation looks resilient.
This is good news for the Australian currency, which has rebounded impressively since the sell-off in early August. The RBA’s hawkish tone, higher inflation, and a rebound in global risk appetite have contributed to the recovery.
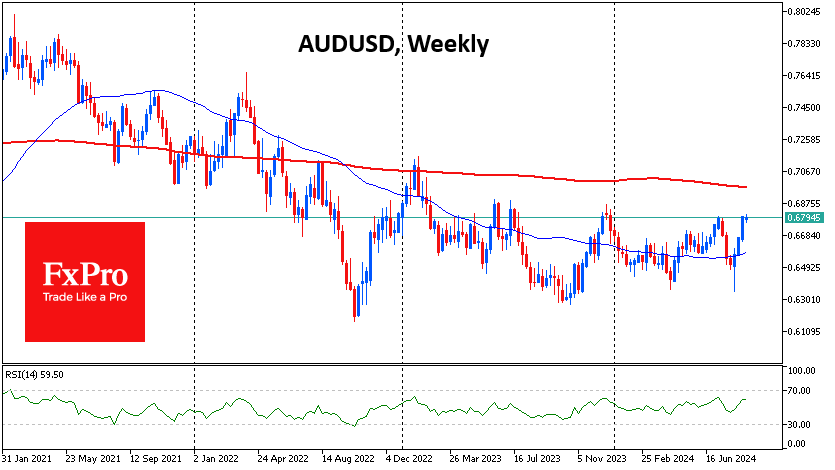
The AUDUSD is testing the upper boundary of its 18-month trading range near 0.6800. In early August, the 0.6350 area reaffirmed its role as the turning point from decline to growth, as it has done over the last two years. The focus now is on whether the Aussie can break out of its long consolidation by breaking through a key resistance level.
This move could be an important indicator of a recovery in risk appetite and a resumption of the carry trade to which the Australian currency is sensitive. It could also signal a global shift in the dollar’s trading regime, sending it in search of a lower bottom.
Australian CPI Falls But Markets Not Impressed
The Australian dollar continues to have a quiet week. AUD/USD is trading at 0.6796 in the European session, up 0.06% on the day at the time of writing.
Australian CPI dips to 3.5%
Australia’s inflation rate continued to decelerate in July, although the markets were hoping for more. CPI rose 3.5%, down from 3.8% in June but above the market estimate of 3.4%. This was the lowest figure since March but much of the decline was driven by electricity rebates which artificially lowered electricity prices.
Core inflation eased but goods inflation remained flat. The markets weren’t impressed with the inflation data and the odds of a rate cut in November fell to 48%, down from 58% prior to the inflation release.
The markets are more dovish than the Reserve Bank of Australia, which has discussed raising rates at recent meetings. The central bank is not satisfied with the pace of underlying inflation and has projected that it won’t return to the target band of 2% to 3% until the end of 2025. Governor Bullock has said that the Bank has no plans to cut for at least six months, but the markets are betting that the RBA won’t stay on the sidelines while the Fed and other major central banks are lowering rates.
The financial markets are hanging onto every word from FOMC members and we’ll hear from members Christopher Waller later today and Rafael Bostic early on Thursday. As well, the US releases second estimate GDP for the second quarter on Thursday.
The initial estimate showed the economy powering ahead with a 2.8% gain, double the 1.4% pace in Q1. The second estimate is expected to confirm the initial reading and confirm that the economy remains in solid shape, despite concerns about a weak employment labor which led to a market meltdown earlier this month.
AUD/USD Technical
- AUD/USD is testing support at 0.6784. Below, there is support at 0.6771
- 0.6805 and 0.6818 are the next resistance lines
WTI Outlook: Fresh Fall of Oil Price Signals an End of Corrective Phase
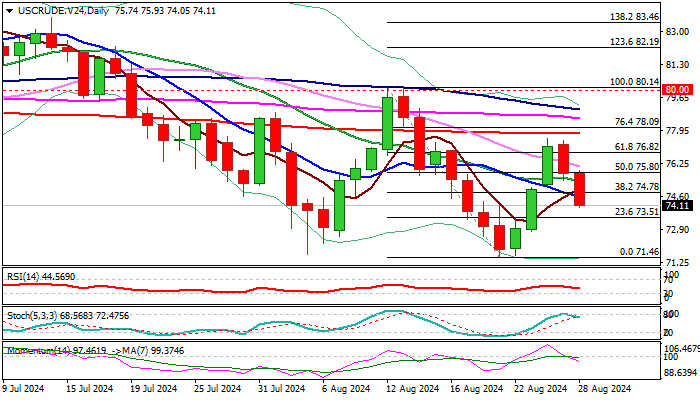
Oil price declines for the second straight day after recent three-day strong recovery rally was repeatedly rejected just under 200DMA ($77.80).
Subsequent weakness generated reversal signal following a break below pivotal support at $74.51 (50% retracement of $71.46 / $77.57 recovery leg, reinforced by 10DMA).
Daily studies weakened (MA’s are back to full bearish setup and 14-d momentum dipped to negative territory) adding to downside risk.
Quick change in the sentiment from increasingly bullish (on Libya supply concerns and geopolitical tensions) to negative, was mainly influenced by growing demand worries and elevated risk of broader economic slowdown.
This signals high volatility and points to fundamentals as currently key market drivers, which can quickly reverse direction, despite encouraging technical picture.
Res: 74.51; 75.24; 75.93; 76.13.
Sup: 73.79; 72.90; 72.19; 71.46.
NZD/USD Reaches Annual High Amid USD Weakness
The NZD/USD pair has climbed to the highest level since 15 January 2024, continuing its trajectory within an ascending channel towards a target of 0.6233. The New Zealand dollar's growth is primarily fuelled by the weakening US dollar, mirroring trends observed with other currencies such as the AUD and CAD.
Investor sentiment is buoyed by the anticipation that the US Federal Reserve will begin easing monetary policy at its September meeting. Debates about whether the rate cut will be 25 or 50 basis points are ongoing. The decision is seen as imminent given the current inflationary environment in the US and the need to support the employment market.
Conversely, the Reserve Bank of New Zealand (RBNZ) has already taken proactive steps by lowering its interest rate earlier this month. The RBNZ has also signalled a potential reduction in lending costs by up to 75 basis points by year-end, marking a fairly aggressive stance on rates. This transparent approach to monetary policy is helping to shape market expectations and bolster the NZD.
Technical analysis of NZD/USD
On the H4 chart, NZD/USD has completed a growth wave to 0.6250 and is now forming the initial decline phase towards 0.6128. After reaching this target, a corrective movement to 0.6191 might occur, testing it from below before initiating a further decline to 0.6065 and possibly extending to 0.6000. The MACD indicator, positioned above zero but trending downwards, supports this bearish outlook.
On the H1 chart, the pair is currently developing a decline structure towards 0.6222. Following this, a brief uptick to 0.6238 is expected, potentially leading to a consolidation around this level. A downward exit from this consolidation could signal the continuation of the downward trend towards 0.6128. This scenario is corroborated by the Stochastic oscillator, with its signal line below 50 and aiming towards 20, indicating a likely continuation of the downward movement.
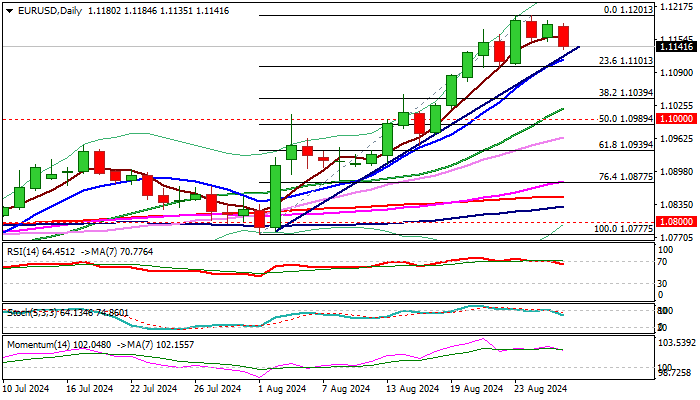
EUR/USD Outlook: Bulls Pausing Under 1.1200 Barrier
EURUSD edges lower on Wednesday after repeated failure to break 1.1200 barrier, but near-term action can be described as consolidation, as long as the price stays above first pivots at 1.1124/14 (trendline support/rising 10DMA) and 1.1100 (higher base/Fibo 23.6% of 1.0777/1.1201).
Negative signals are developing on daily chart (14-d momentum diverged from the price and heading south/RSI emerged from overbought territory) but still need confirmation.
Initial negative signals can be also seen on weekly chart (EURUSD is on track for weekly close in red after two long bullish weekly candlesticks/overbought conditions), but conflicting with firm bullish structure on monthly chart, as technical studies are in predominantly bullish setup and the pair is on track for the biggest monthly gain since November 2022.
Look for firmer direction signals on violation of either pivot (1.1100/1.1200).
Res: 1.1157; 1.1185; 1.1201; 1.1239.
Sup: 1.1124; 1.1114; 1.1100; 1.1039.
Gold Flirts With Short-Term Uptrend Line
- Gold lies within near-term SMAs
- Momentum oscillators head down
Gold unsuccessfully tested the all-time high of 2,531.66 again today, but it is still above the 2,500 round number and the short-term uptrend line.
Currently, the price is challenging the 20- and 50-period simple moving averages (SMAs) in the 4-hour chart, with the technical oscillators showing some weakening momentum. The stochastic is heading lower, while the MACD stands beneath its trigger line above the zero level.
In case of a decline beneath the 2,503 support which holds near the ascending trend line, then the next support could come from 2,470. If traders continue to sell the commodity, then it may challenge the 200-period SMA at 2,443.
On the other hand, a bounce off 2,503 may drive the price higher, flirting with the record peak of 2,531.66 before moving towards the next round number of 2,600.
All in all, the yellow metal is bullish in the short-and long-term timeframes as long as it stands above the 200-period SMAs.
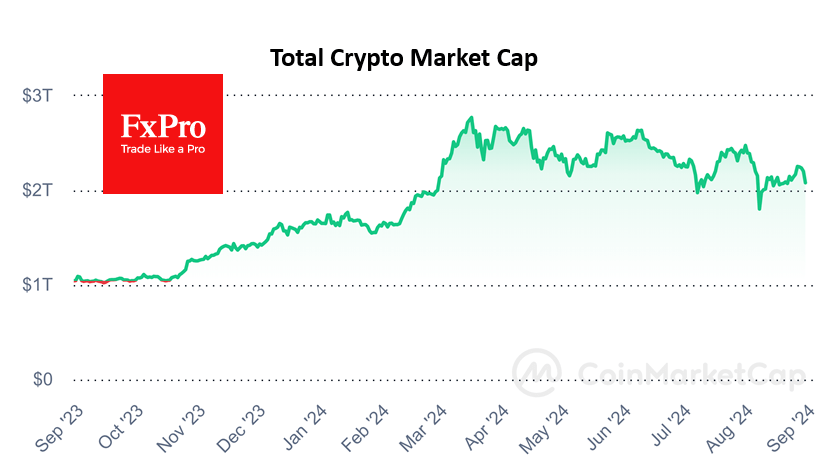
Faster Crypto Market Decline
Market picture
The cryptocurrency market has plunged 6% to a capitalisation of $2.08 trillion, its lowest level in nine days. Bitcoin is falling in line with the broader trend, while Ethereum and Solana are down 8.4% and 7.3%, respectively. Gold has also experienced an almost synchronised sell-off, losing around 1%, but equity markets remain generally positive and hopeful.
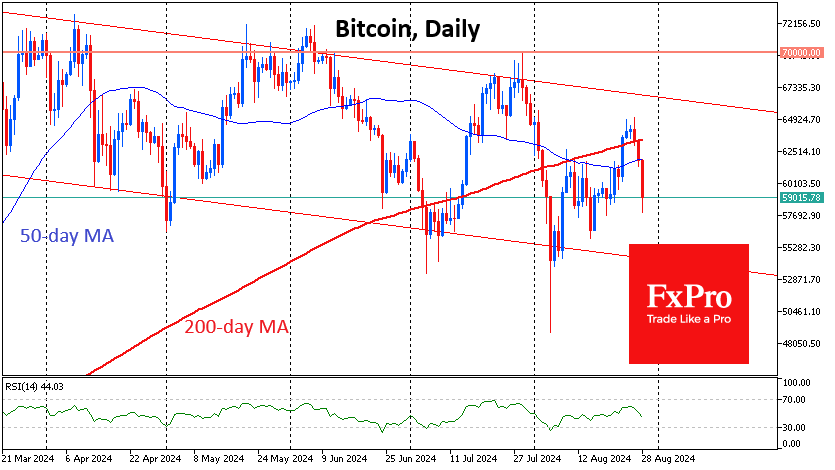
Bitcoin fell below $58K in thinly liquid trading early Wednesday afternoon but later recovered to $59K by the start of active trading in Europe. The sell-off intensified after a failed attempt to break above $65K early Monday afternoon, taking the price back below its 200- and 50-day moving averages. The first cryptocurrency may be heading towards the lower end of the trading range as it heads towards $54K. The market appears to be largely dragged down by automatic stop orders during light trading hours. Such sell-offs often take leveraged traders out of the market but also attract long-term buyers on dips.
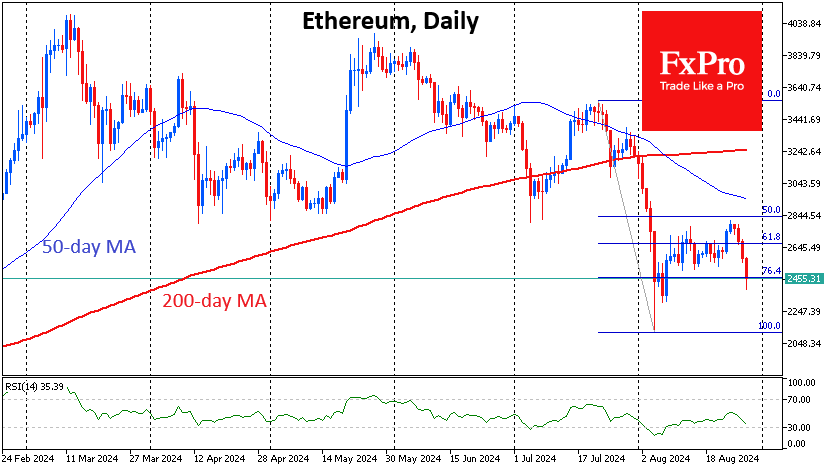
Ethereum briefly dipped below $2400, its lowest level since 8 August. There is a risk that this week’s sell-off is a second leg lower, following the collapse and subsequent consolidation of previous weeks. A drop below $2100 could confirm this hypothesis.
News background
CryptoQuant doubted that the bullish scenario would materialise soon due to the activation of large sellers. The bitcoin futures market also shows that traders are cautious.
According to Henley & Partners’ Crypto Wealth Report 2024, the number of investors holding at least one million dollars in cryptos reached 172,300, 95% more than a year earlier.
The trustee of Celsius, a bankrupt lending platform, distributed $2.5 billion in digital assets and fiat to creditors, paying off 93% of the company’s financial obligations.
Mining company Rhodium Enterprises filed for bankruptcy with debts of up to $100 million.