

Sample Category Title
GBP/USD Weekly Outlook
GBP/USD's fall from 1.3043 extended to 1.2706 last week but recovered since then. Initial bias remains neutral this week and further fall is in favor as long as 1.2863 resistance holds. Below 1.2706 will target 1.2612 support first. Decisive break there should confirm that rise from 1.2298 has completed. However, break of 1.2863 will turn bias back to the upside for retesting 1.3043 resistance instead.
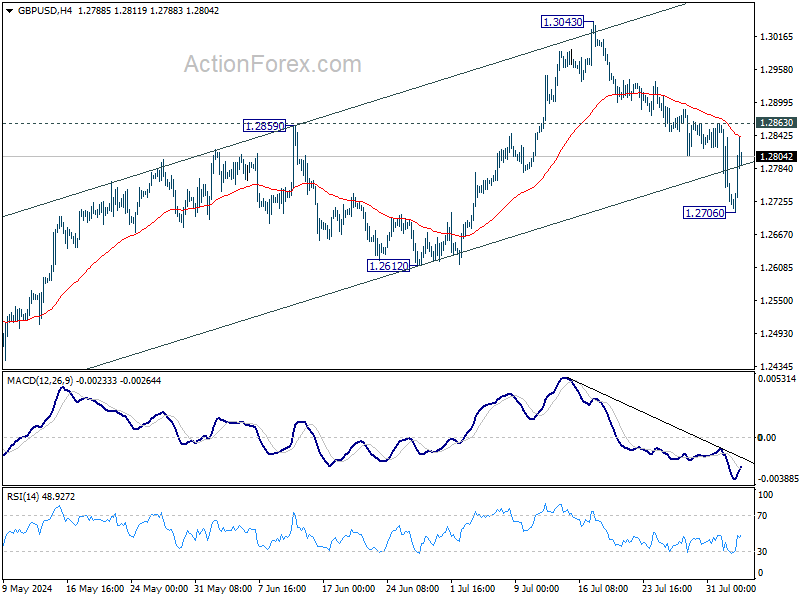
In the bigger picture, current development suggests that corrective pattern from 1.3141 is extending with fall from 1.3043 as another leg. Break of 1.2612 support would strengthen this case. But still, downside should be contained by 1.2036/2298 support zone even in case of deep decline. Rise from 1.0351 (2022 low) remains in favor to resume at a later stage.
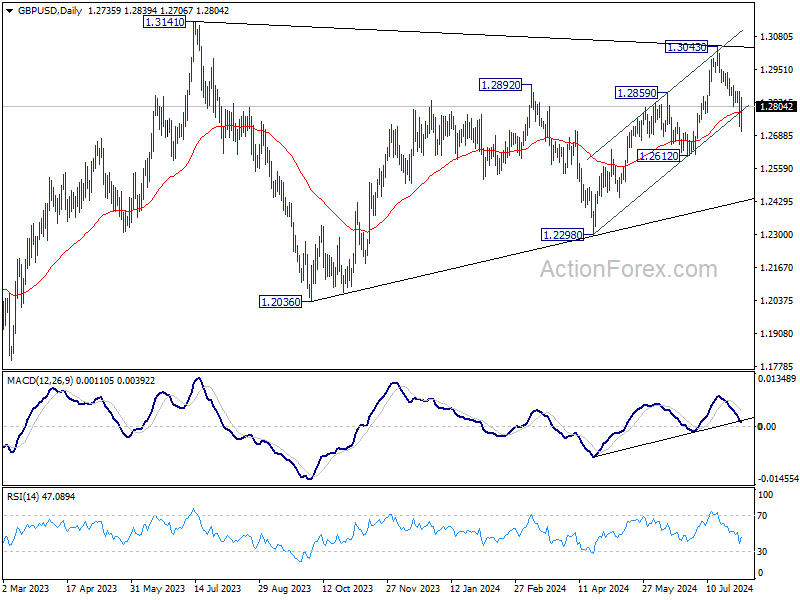
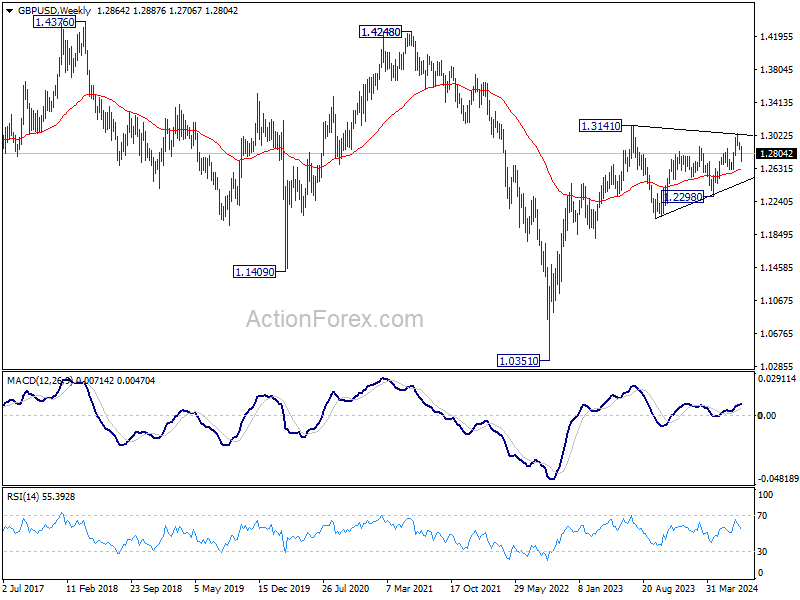
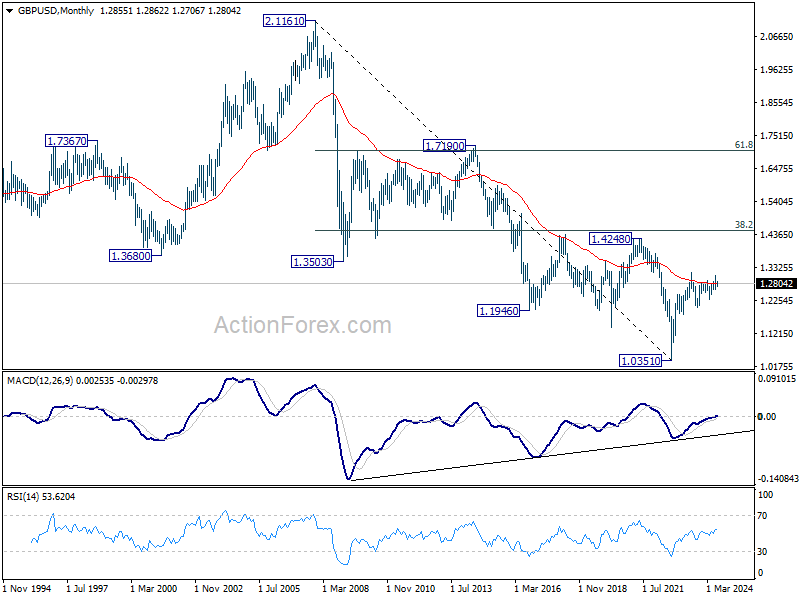
In the long term picture, as long as 1.2298 support holds, rise from 1.0351 long term bottom is expected to continue. But still, firm break of 1.4248 structural resistance is needed to indicate bullish trend reversal. Otherwise, price actions from 1.0351 are tentatively seen as a consolidation pattern only.
USD/CHF Weekly Outlook
USD/CHF's fall from 0.9223 accelerated lower last week and there is no sign of bottoming yet. Initial bias remains on the downside this week and deeper decline would be seen to retest 0.8332 low. On the upside, above 0.8662 minor resistance will turn intraday bias neutral and bring consolidations. But outlook will remain bearish as long as 0.8825 support turned resistance holds.
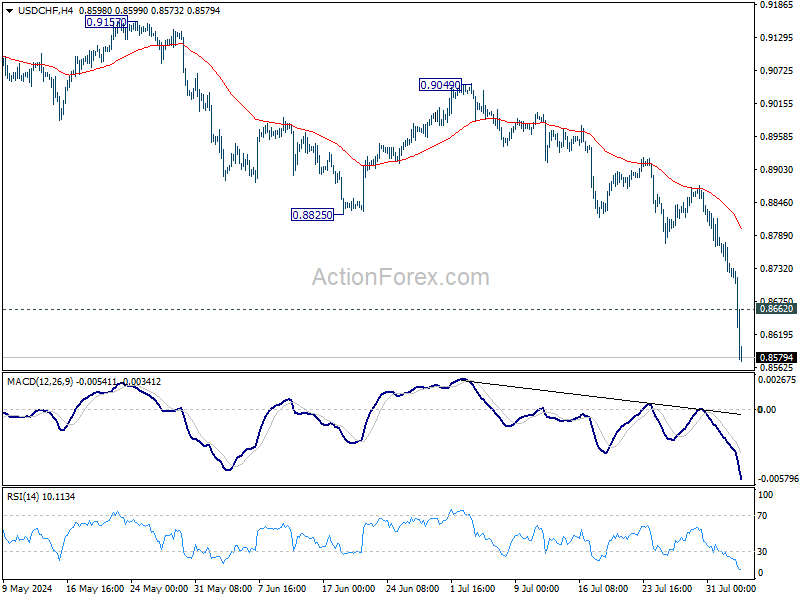
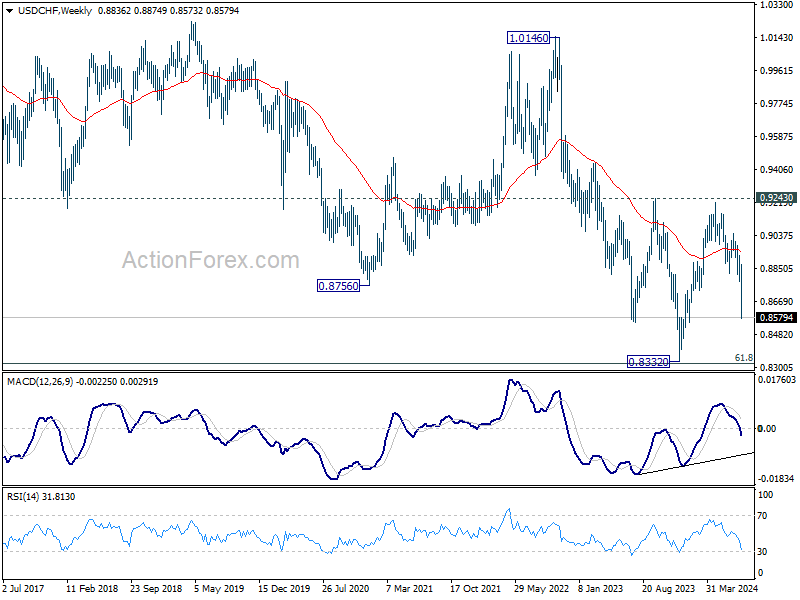
In the bigger picture, price actions from 0.8332 (2023 low) are currently seen as a medium term corrective pattern, with fall from 0.9223 as the second leg. Strong support could be seen from 0.8332 to bring rebound. Yet, overall outlook will continue to stay bearish as long as 0.9243 resistance holds. Firm break of 0.8332, however, will resume larger down trend from 1.0146 (2022 high).
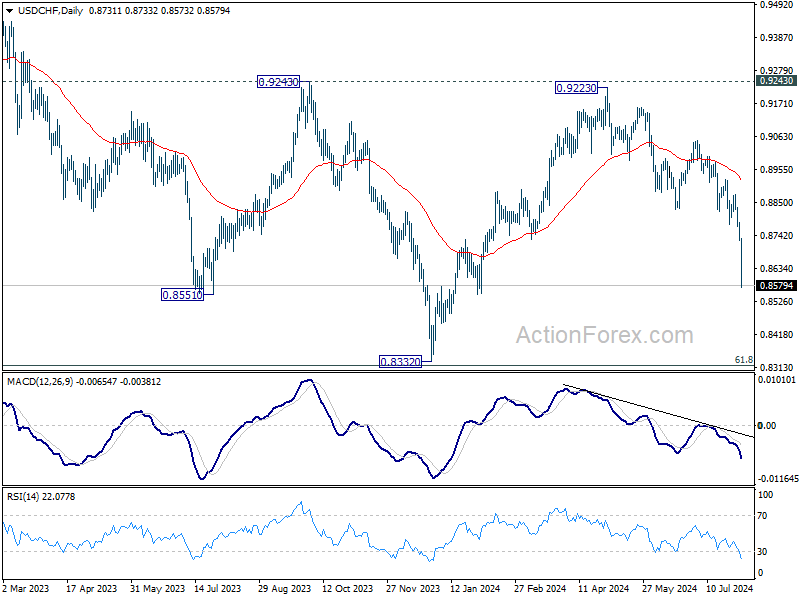
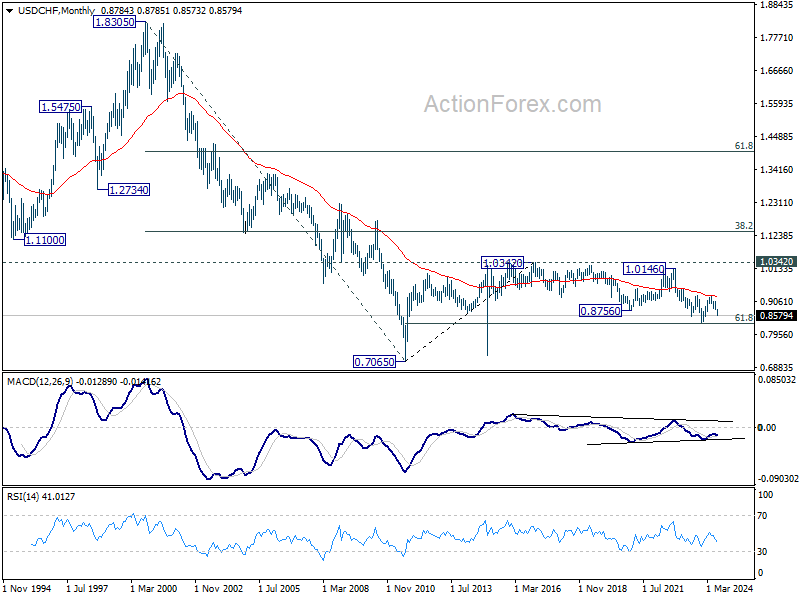
In the long term picture, price action from 0.7065 (2011 low ) are seen as a corrective pattern to the multi-decade down trend from 1.8305 (2000 high). Fall from 1.0342 (2016 high) is seen as the second leg. Rejection by 55 M EMA suggest that this fall is in progress. Break of 61.8% retracement of 0.7065 to 1.0342 at 0.8317 will pave the way back to 0.7065.
AUD/USD Weekly Report
AUD/USD edged lower to 0.6479 last week but turned sideway since then. Initial bias stays neutral this week for some more consolidations. But further decline is expected as long as 0.6609 minor resistance holds. Break of 0.6479 will resume the fall from 0.6798 to 0.6361 support next.
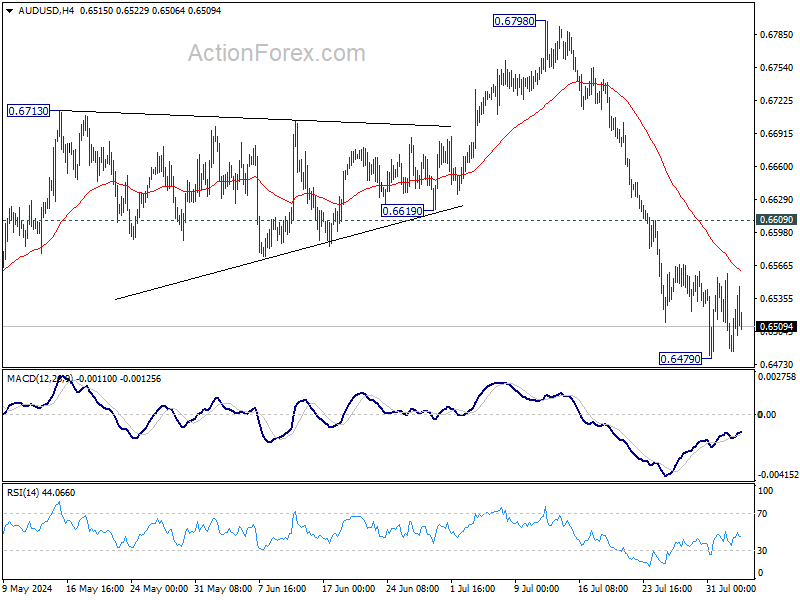
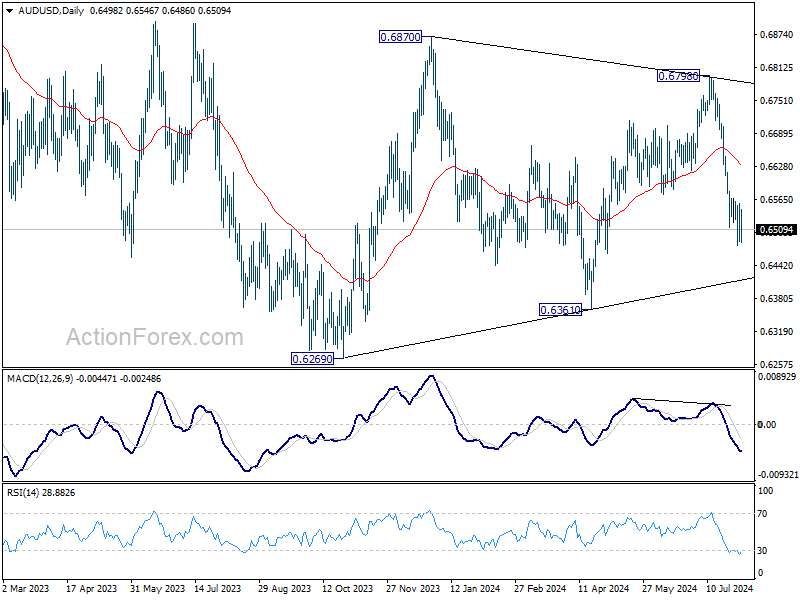
In the bigger picture, overall, price actions from 0.6169 (2022 low) are seen as a medium term corrective pattern, with fall from 0.6798 as another falling leg. Deeper fall could be seen to the lower side of the range between 0.6169/6361. But strong support should be seen there to contain downside. For now, risk will stay on the downside as long as 55 D EMA (now at 0.6633) holds, in case of rebound.
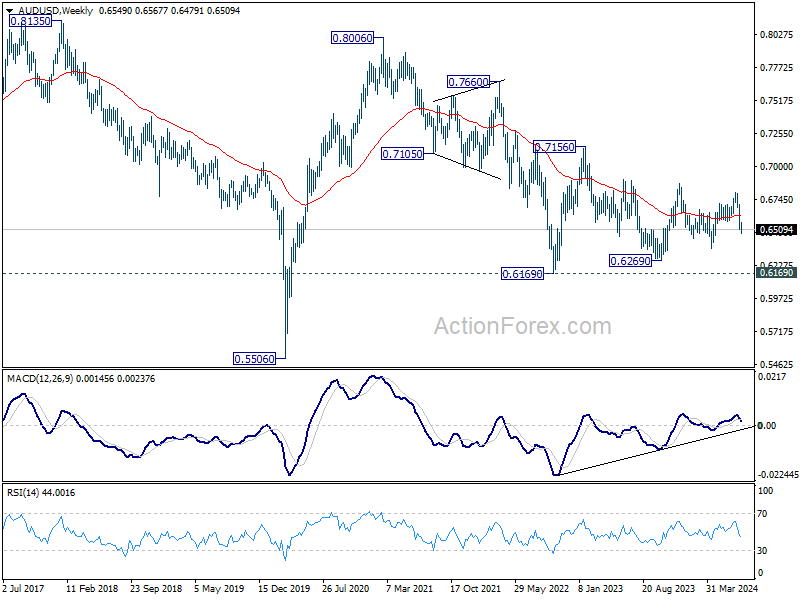
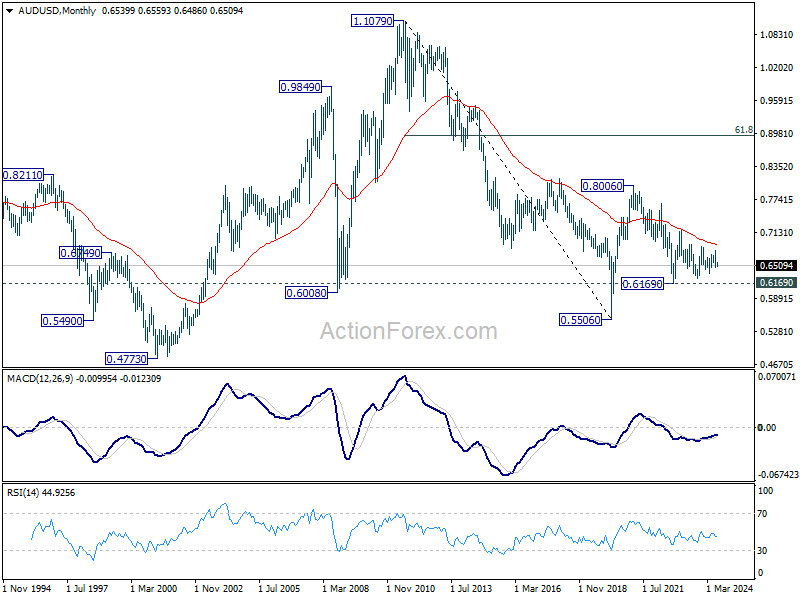
In the long term picture, the down trend from 1.1079 (2011 high) should have completed at 0.5506 (2020 low) already. It's unsure yet whether price actions from 0.5506 are developing into a corrective pattern, or trend reversal. But in either case, fall from 0.8006 is seen as the second leg of the pattern. Hence, in case of deeper decline, strong support should emerge above 0.5506 to bring reversal.
USD/CAD Weekly Outlook
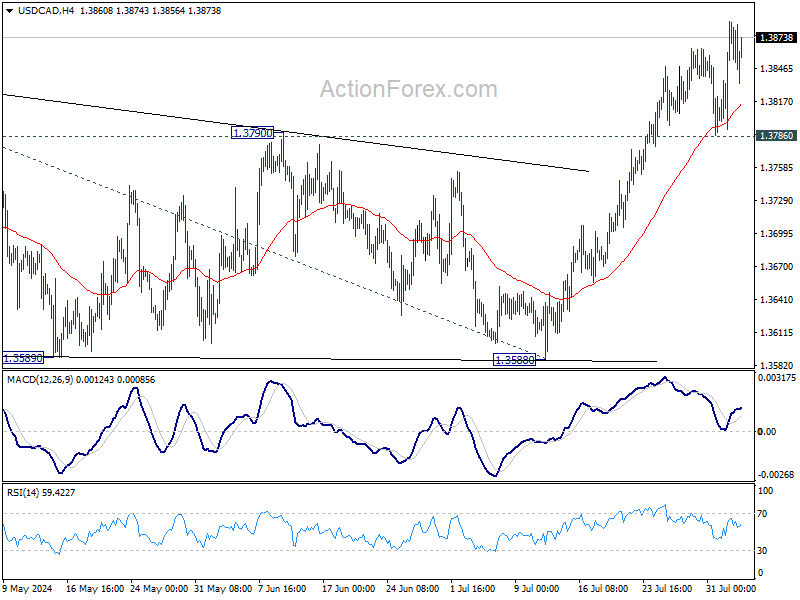
USD/CAD's rise from 1.3176 resumed by breaking through 1.3845 resistance last week. Initial bias stays on the upside this week for 61.8% projection of 1.3176 to 1.3845 from 1.3588 at 1.4025 next. For now break of 1.3786 support is needed to indicate short term topping. Otherwise, outlook will remain bullish in case of retreat.
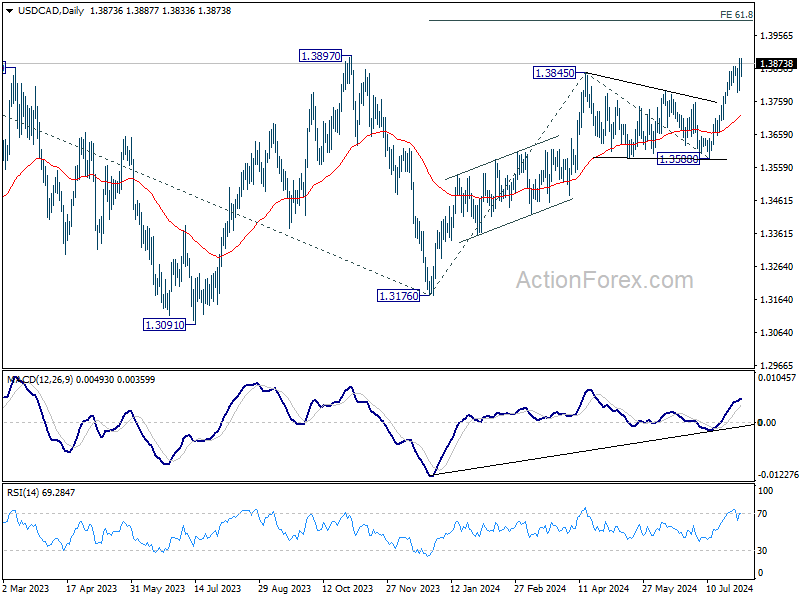
In the bigger picture, price actions from 1.3976 (2022 high) are viewed as a corrective pattern, that might have completed at 1.3176 (2023 low) already. Firm break of 1.3976 will confirm resumption of whole up trend from 1.2005 (2021 low). Next target is 61.8% projection of 1.2401 to 1.3976 from 1.3176 at 1.4149. This will be the favored case as long as 1.3588 support holds, in case of pullback.
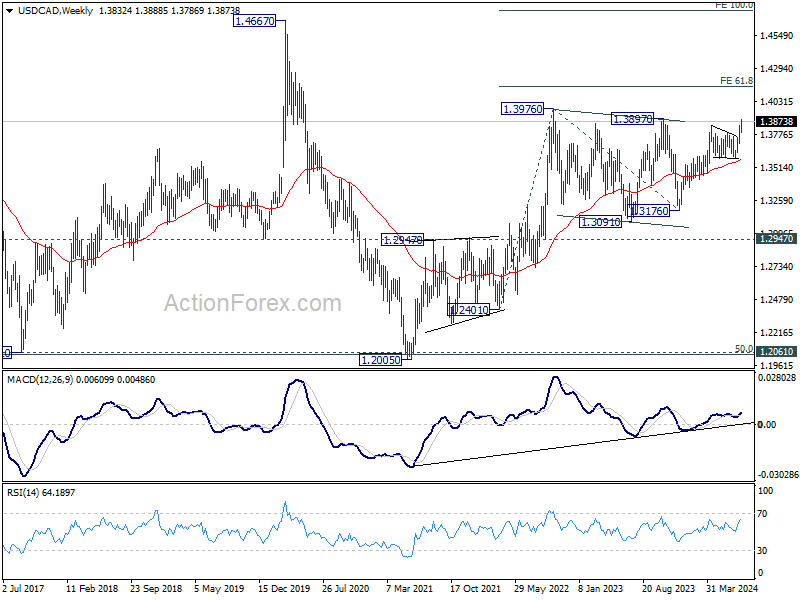
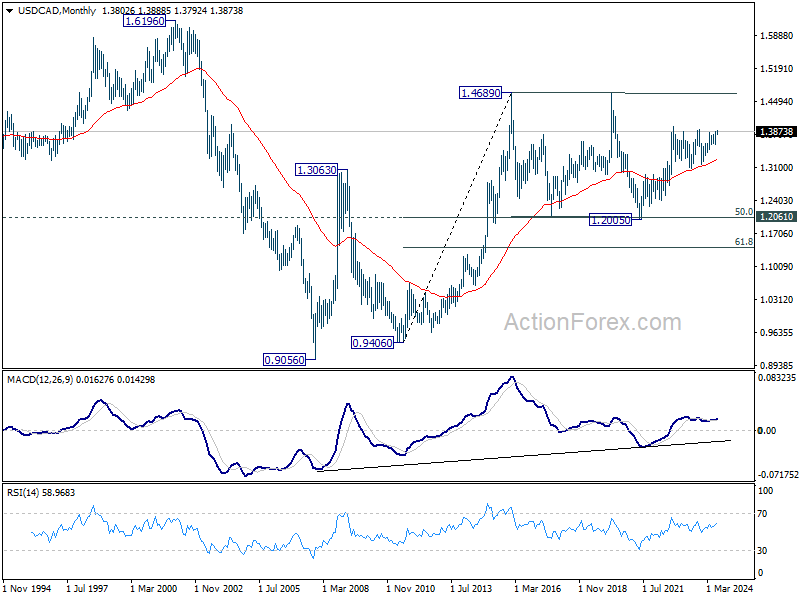
In the longer term picture, price actions from 1.4689 (2016 high) are seen as a consolidation pattern, which might have completed at 1.2005. That is, up trend from 0.9506 (2007 low) is expected to resume at a later stage. This will remain the favored case as long as 1.2947 resistance turned support holds.
GBP/JPY Weekly Outlook
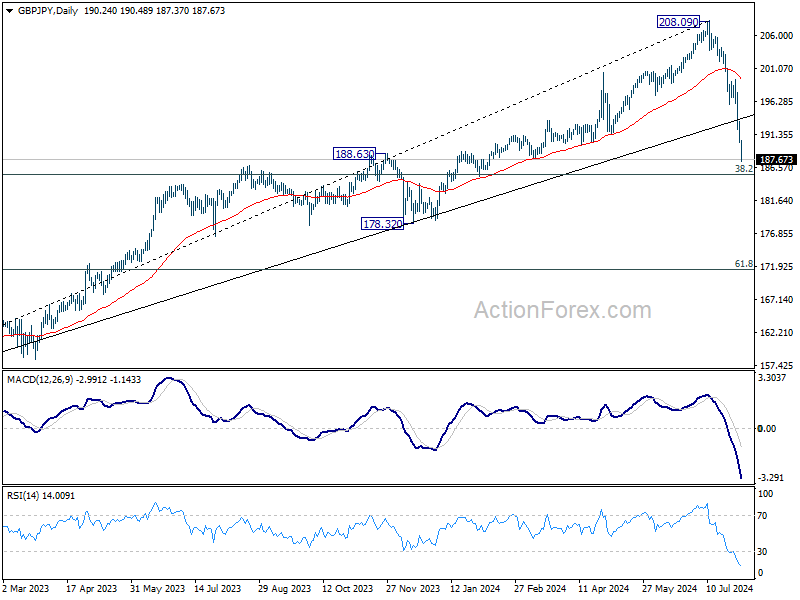
GBP/JPY's fall from 208.09 continued last week and accelerated further. This decline is as correcting the whole rally from 148.93. Initial bias stays on the downside this week for 185.49 fibonacci level. On the upside, above 193.23 minor resistance will turn intraday bias neutral and bring consolidations first, before staging another decline.
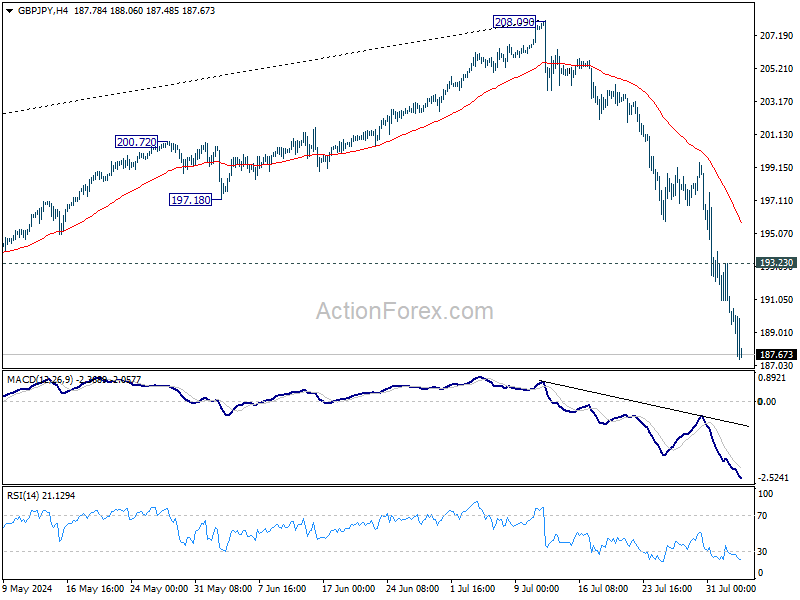
In the bigger picture, fall from 208.09 medium term top is seen as correcting the up trend from 148.93 (2022 low). Further decline should be seen to 38.2% retracement of 148.93 to 208.09 at 185.49. Decisive break there will argue that even larger scale correction is already underway. For now, risk will stay on the downside as long as 55 D EMA (now at 199.44) holds. in case of rebound.
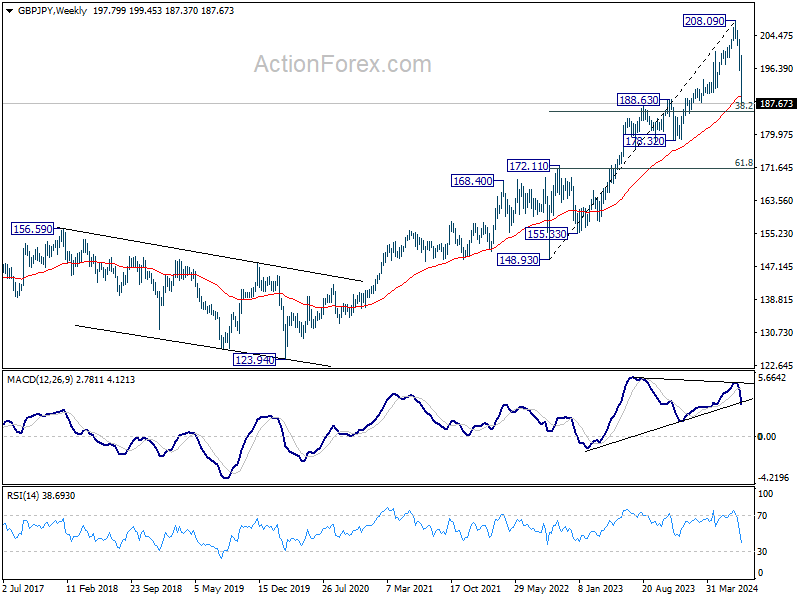
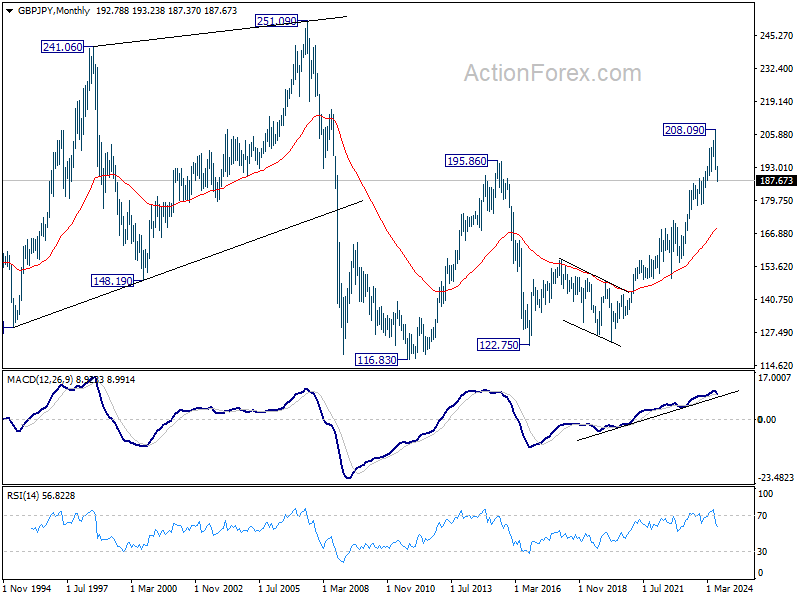
In the longer term picture, considering bearish divergence condition in W MACD, 208.09 is at least a medium term top. It's still early to conclude that the up trend from 122.75 (2016 low) has completed. But it's at least in a medium term corrective phase, with risk of correction to 55 M EMA (now at 169.23).
EUR/JPY Weekly Outlook
EUR/JPY's fall from 175.41 continued last week accelerated further. This decline is now seen as a larger scale correction. Initial bias remains on the downside for 155.91 fibonacci level next. On the upside, above 163.41 minor resistance will turn intraday bias neutral and bring consolidations first, before staging another decline.
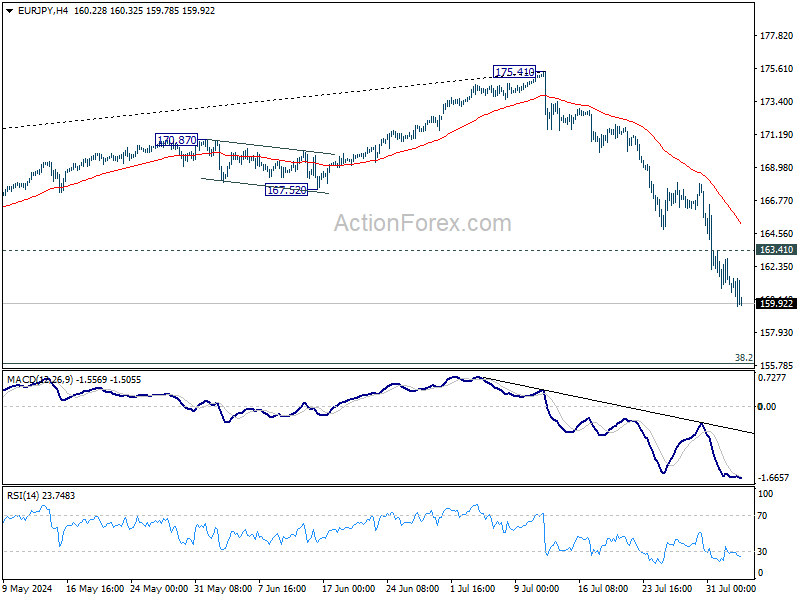
In the bigger picture, break of 164.29 resistance turned support indicates that fall from 175.41 medium term top is at least correcting the rise from 124.73, with risk of bearish trend reversal. Deeper decline would be seen to 38.2% retracement of 124.37 to 175.41 at 155.91. This will now remain the favored case as long as 55 D EMA (now at 168.81) holds, even in case of strong rebound.
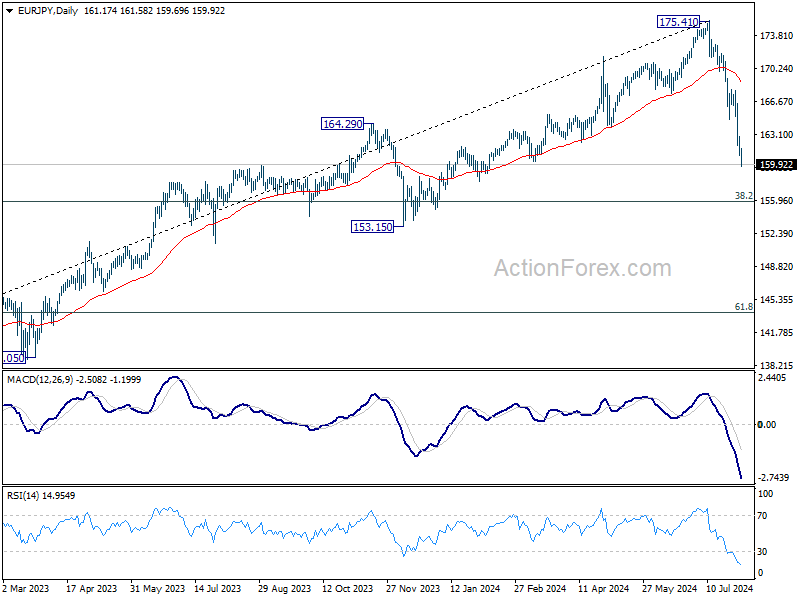
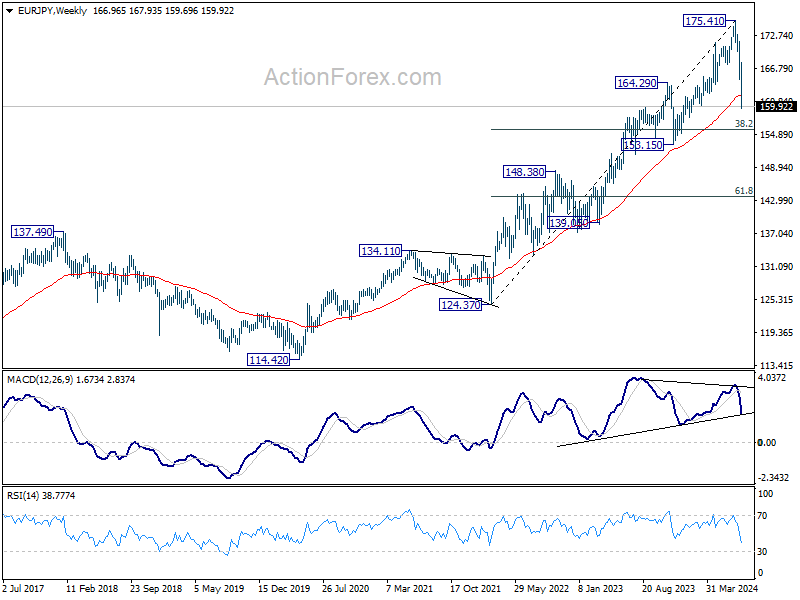
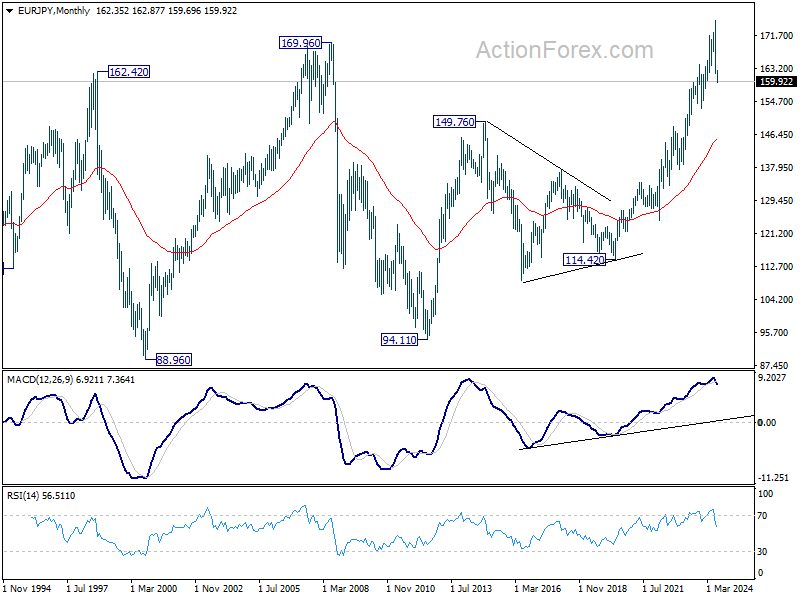
In the long term picture, considering bearish divergence condition in W MACD, 175.41 is at least a medium term top. It's still early to conclude that up trend from 94.11 (2012 low) has completed. But a medium term corrective phase is in progress with risk of deeper fall back to 55 M EMA (now at 145.46).
EUR/GBP Weekly Outlook
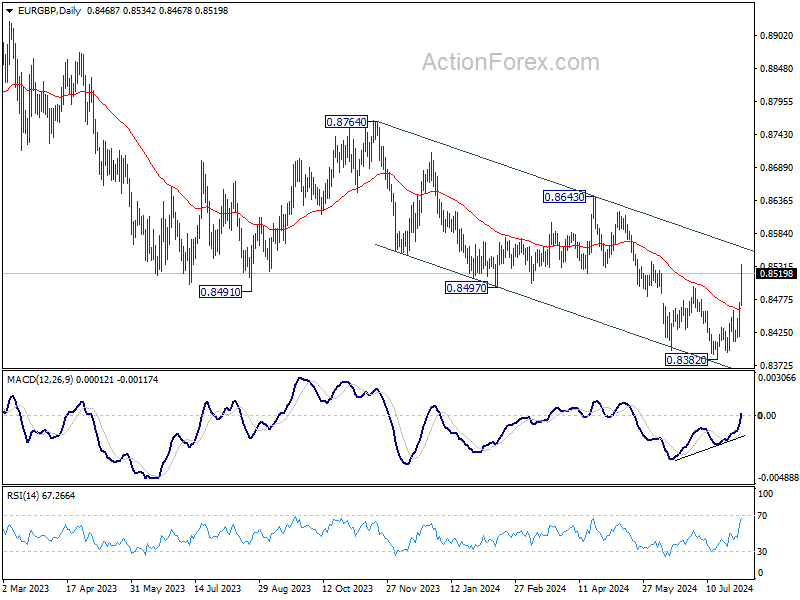
EUR/GBP's rise from 0.8382 accelerated higher last week and the strong break of 0.8498 resistance argues that fall form 0.8643 has completed with five waves down to 0.8382. Initial bias stays on the upside this week for channel resistance (now at (now at 0.8560). Sustained break there will raise the chance of larger bullish trend reversal and target 0.8643 resistance next. On the downside, below 0.8482 minor support will turn intraday bias neutral first.
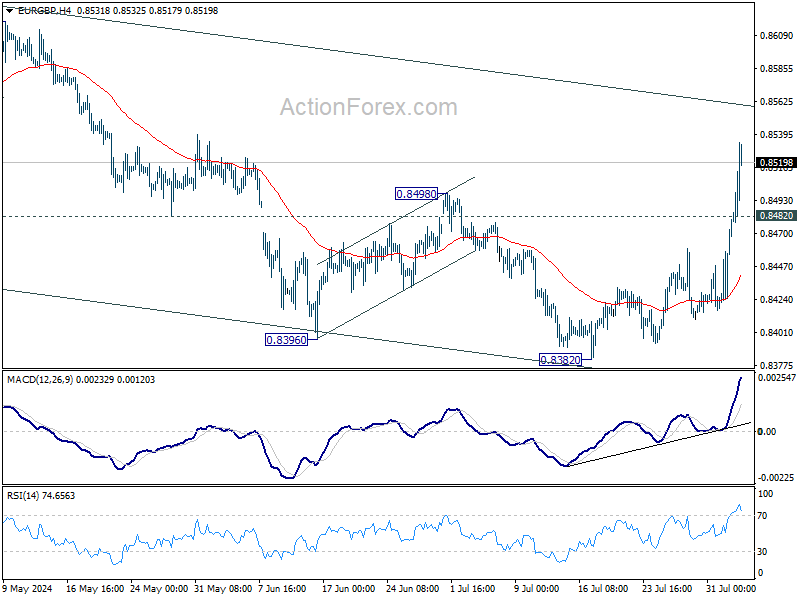
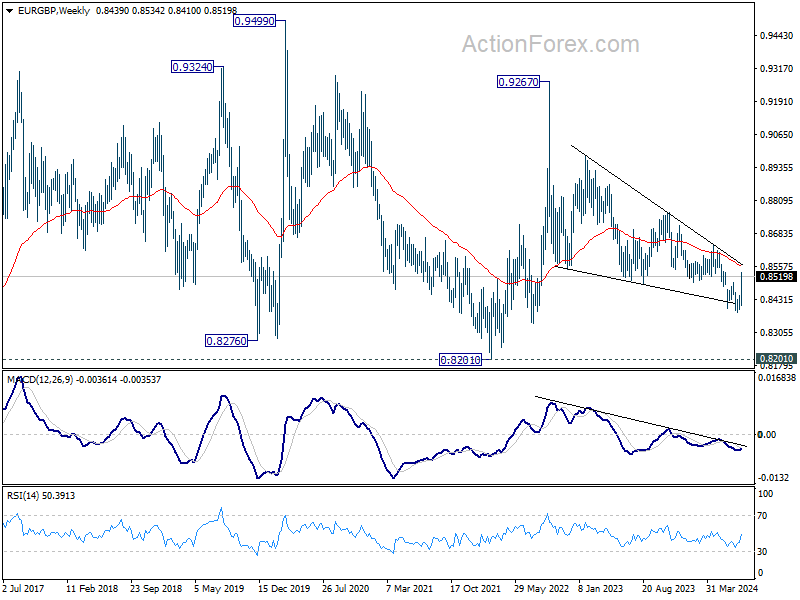
In the bigger picture, while the rebound from 0.8382 is strong, there is no confirmation of trend reversal yet. As long as 0.8643 resistance holds, down trend from 0.9267 could still resume through 0.8382 at a later stage. However, firm break of 0.8643 will indicate that such down trend has completed, and turn outlook bullish.
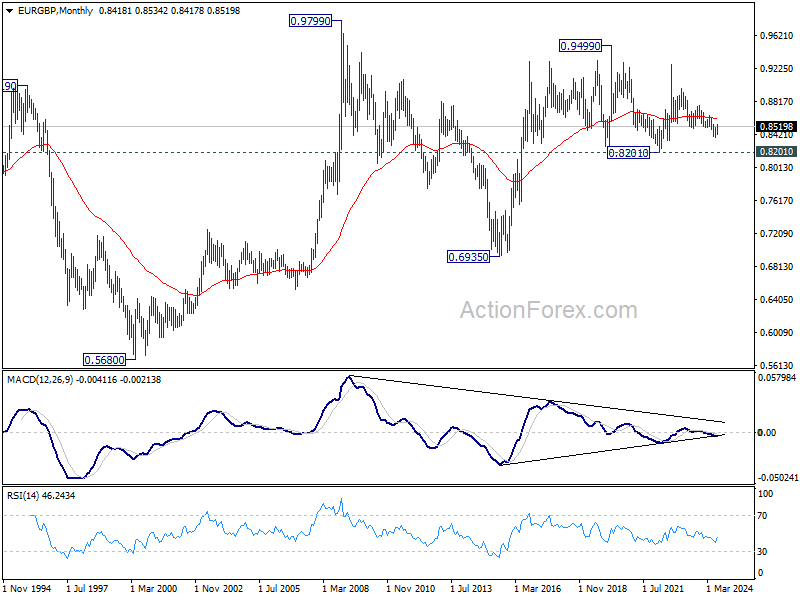
In the long term picture, price action from 0.9499 (2020 high) is seen as part of the long term range pattern from 0.9799 (2008 high). Range trading should continue between 0.8201 and 0.9499, until there is clear signal of imminent breakout.
EUR/AUD Weekly Outlook
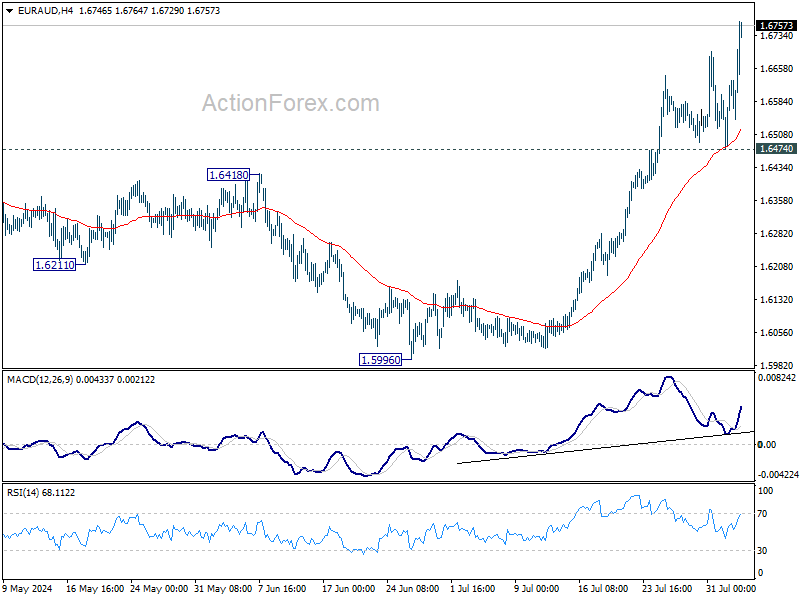
EUR/AUD's rise from 1.5996 extended through 1.6742 resistance last week despite interim pullback. The development strengthens the case that corrective fall from 1.7062 has completed with three waves down to 1.5998. Initial bias is on the upside this week for retesting 1.7062 high. On the downside, break of 1.6474 support is needed to indicate short term topping. Otherwise, outlook will remain bullish in case of retreat.
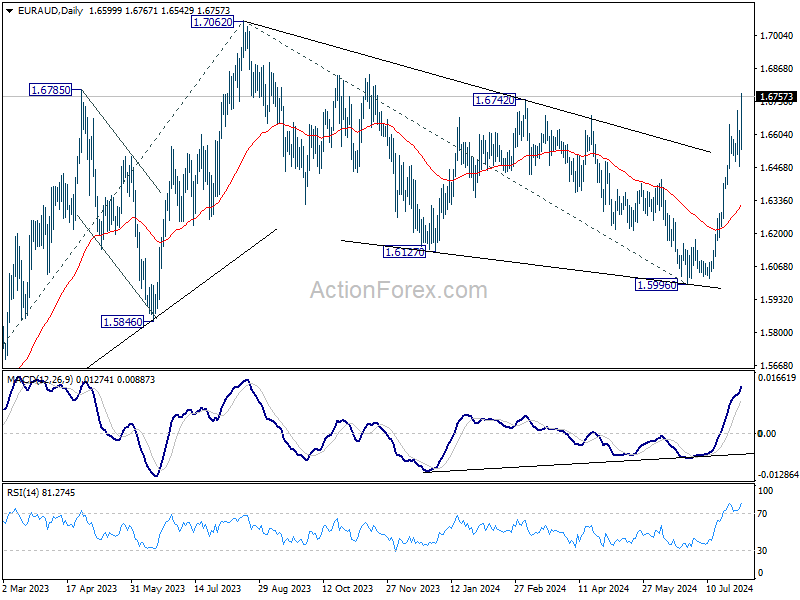
In the bigger picture, fall from 1.7062 medium term top is seen as a correction to the up trend from 1.4281 (2022 low) and could have completed after hitting 38.2% retracement of 1.4281 to 1.7062 at 1.6000. On resumption next target will be 61.8% projection of 1.4281 to 1.7062 from 1.5996 at 1.7715. This will now remain the favored case as long as 1.6474 support holds.
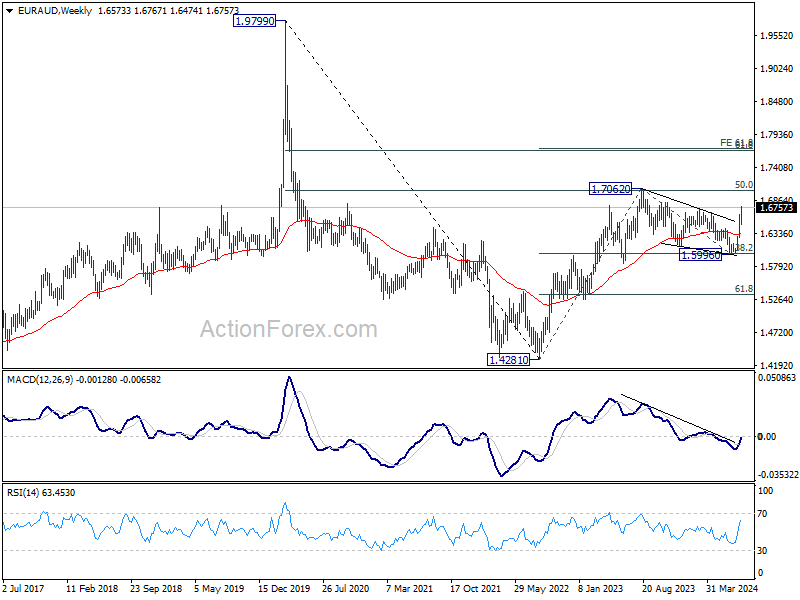
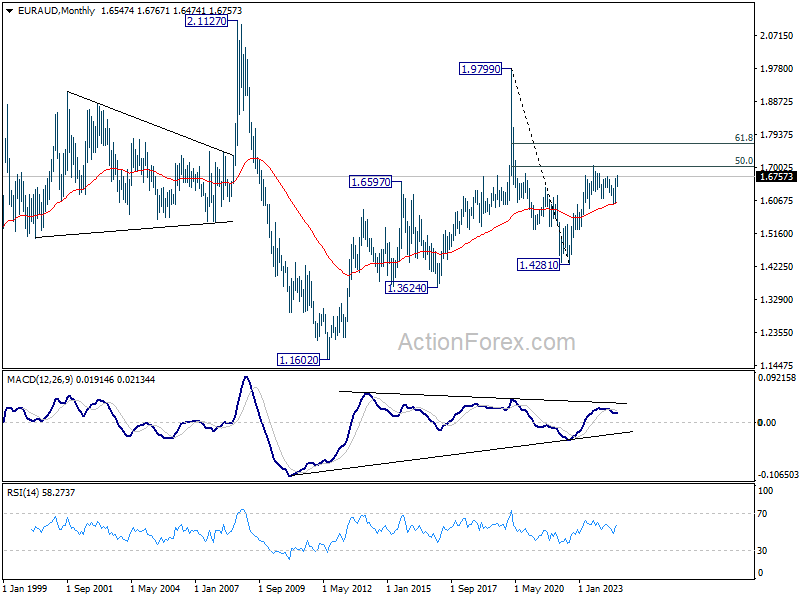
In the longer term picture, price actions from 1.9799 (2020 high) are seen as a long term decline at the same scale as the rise from 1.1602 (2012 low). Rebound from 1.4281 is seen as the second leg. As long as 55 M EMA (now at 1.5987) holds, this second leg could still extend higher. However, sustained trading below 55 M EMA will open up the bearish case for extending the decline through 1.4281 low.
EUR/CHF Weekly Outlook
EUR/CHF's decline form 0.9928 resumed last week and accelerated to as low as 0.9352. Initial bias remains on the downside this week for 100% projection of 0.9928 to 0.94767 from 0.9772 at 0.9320.Strong support could emerge above 0.9252 low to bring rebound. But near term outlook will now stay bearish as long as 0.9519 support turned resistance holds, in case of recovery.
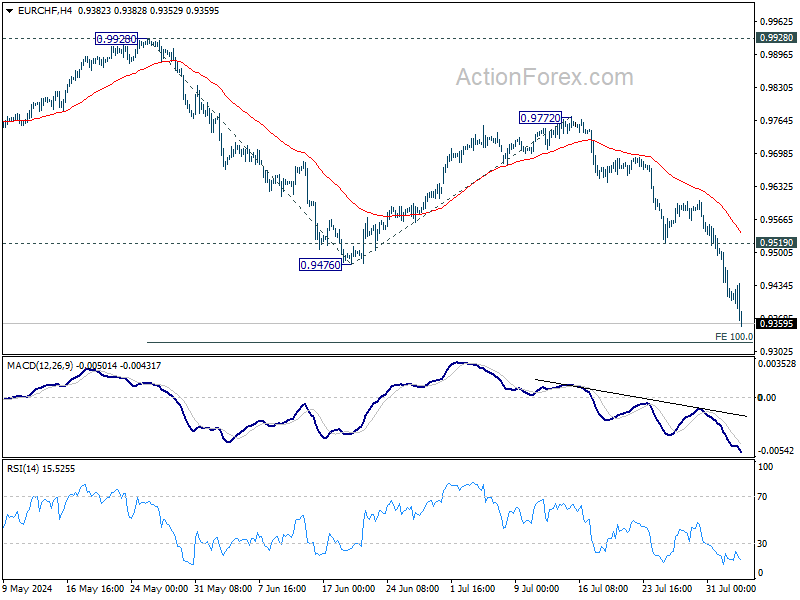
In the bigger picture, current downside acceleration argues that medium term corrective pattern from 0.9407 (2022 low) might have completed with three waves to 0.9928. Decisive break of 0.9252 (2023 low) will confirm long term down trend resumption. Next target will be 61.8% projection of 1.1149 to 0.9407 from 0.9928 at 0.8851. For now, outlook will stay bearish as long as 0.9928 resistance holds, even in case of strong rebound.
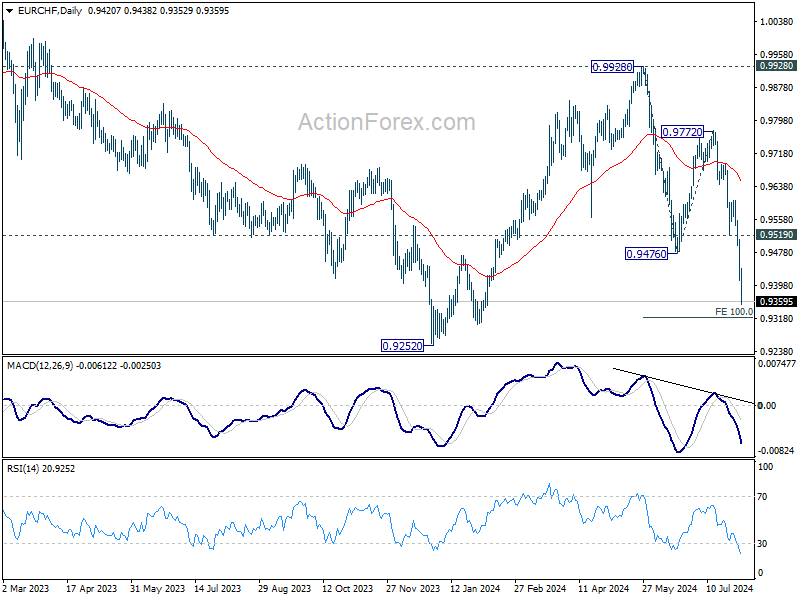
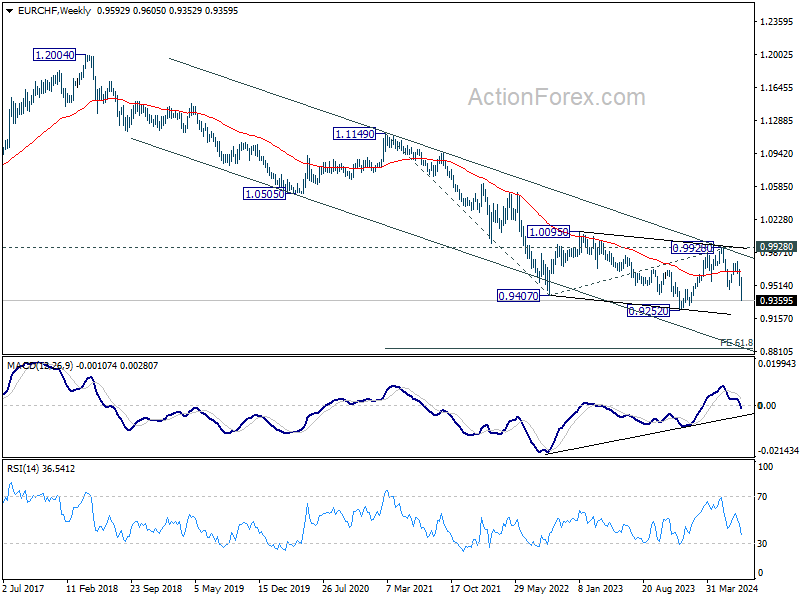
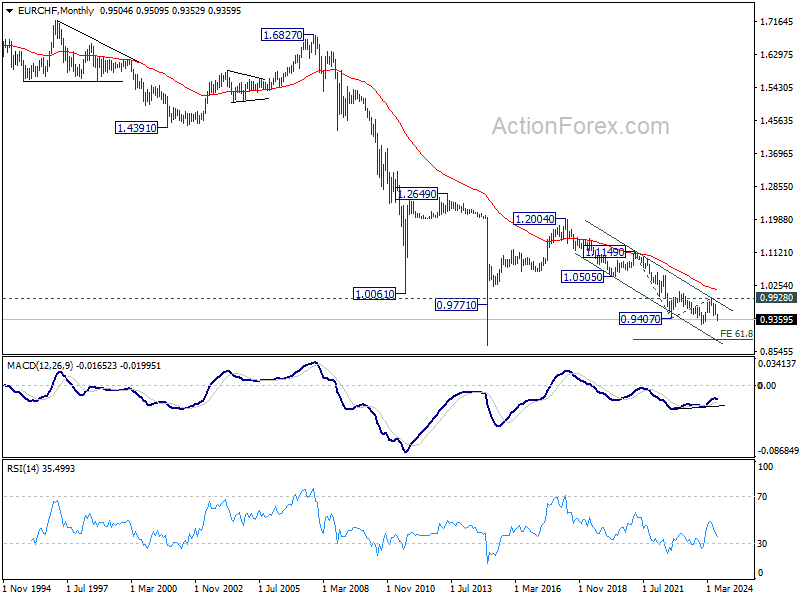
In the long term picture, fall from 1.2004 (2018 high) is part of the multi-decade down trend. Firm break of 0.9928 resistance is needed to be the first sign of long term bottoming. Otherwise, outlook will remain bearish.
Markets Weekly Outlook – Rising US Job Fears, Geopolitics in the Spotlight
- US jobs data underwhelmed, triggering the SAHM rule, signaling a likely recession.
- The Magnificent 7 tech companies have lost nearly $1.75 trillion in market capitalization over the past 10 days.
- Rate cut bets for the US face significant revisions with recessionary fears weighing on global markets.
- Reserve Bank of Australia (RBA) next week. Will the RBA deliver a dovish pivot.
Week in Review: US Unemployment Rate Triggers Recession Fears
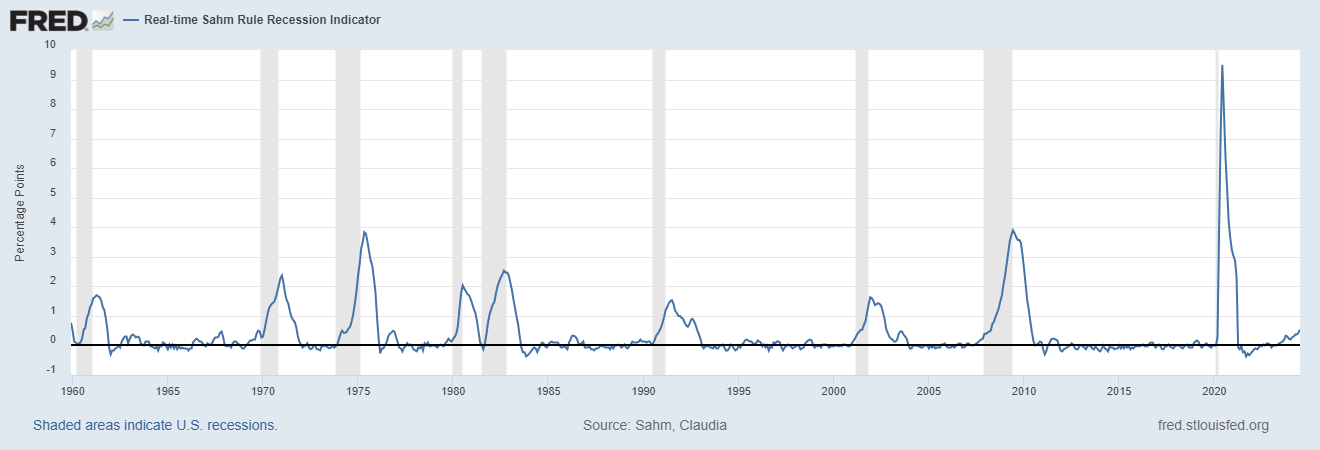
US jobs data underwhelmed on Friday triggering the SAHM rule, which is used to identify the start of a recession based on changes in the unemployment rate.
Named after economist Claudia Sahm, the SAHM rule specifies that a recession is likely underway if the three-month moving average of the national unemployment rate rises by 0.5 percentage points or more relative to its lowest point in the previous 12 months. This metric is designed to provide an early and reliable signal of economic downturns, enabling policymakers to respond more swiftly.
As you can see from the chart below, the July unemployment rate has seen the SAHM rule triggered hinting that the US is already in a recession with a print of 0.53.
Source: Federal Reserve Bank of St. Louis.
The unemployment rate rose to 4.3% while the NFP print missed estimates, coming in at a measly 114k with a downward revision of around 29k for the past two months. By my calculation we have now had downward revisions in 5 of the last 6 job reports with unemployment at a 3 year high.
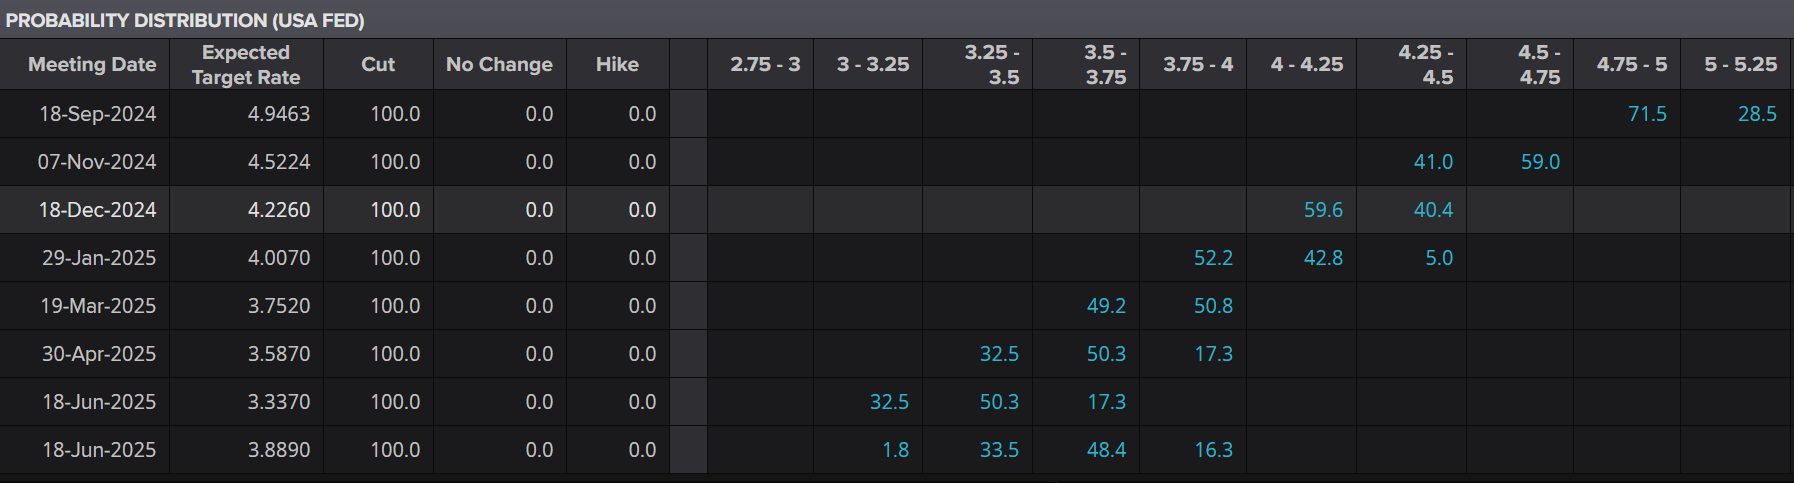
The impact of which has seen rate cut bets for the US face significant revisions with recessionary fears weighing on global markets. Market participants are now pricing in a 71.5% chance of a 50bps rate cut in September with further cuts at the November and December. The data accelerated the early week selloff in US Equities, with both the S&P 500 and Nasdaq 100 deep in the red for the day (at the time of writing.)
Source: LSEG
For context, the Magnificent 7 (Apple, Microsoft, Alphabet, Amazon, Nvidia, Tesla, and Meta) have collectively shed nearly $1.75 trillion in market capitalization over the past 10 days. To put that in perspective, this loss is almost 50% of Apple’s total market cap, the world’s largest company. On Wednesday alone, they experienced their biggest daily loss in history, totaling $750 billion.
On the FX front, the US Dollar finally broke below support at the 104.00 level, trading around 103.100 at the time of writing. This allowed the EUR and GBP to recoup some of their early-week losses against the greenback, finishing the week on a high note.
Commodities had a mixed day, with gold surging sharply toward the $2480/oz level following the jobs data, only to experience a significant selloff as the US session progressed. This rally was likely driven by substantial profit-taking ahead of the weekend. With the potential for escalating tensions in the Middle East, market participants may have been reluctant to hold significant positions over the weekend.
Overall, it was not the best week for markets, with mega-cap tech shares among the biggest losers along with the US dollar. It appears that market participants correctly anticipated rate cuts, while the Fed may be slower to act on reducing rates.
The Week Ahead: Rising Recessionary Fears, Geopolitics and Asia Pacific Data
The upcoming week promises to be intriguing given the recent developments. The weekend could bring additional complications if there are signs of escalating tensions in the Middle East. Such indications may boost the appeal of safe havens, potentially creating gaps in the US Dollar Index and gold prices.
Recessionary fears combined with a broader regional conflict could be key market drivers, especially with limited data releases from both the EU and the US next week. The primary data releases will come from the Asia Pacific region.
Asia Pacific Markets
In Asia, the week will start with the release of the Caixin Services PMI in China on Monday before the focus shifts to Australia. On Tuesday, the Reserve Bank of Australia (RBA) meeting takes center stage, particularly since the Australian central bank has been considering rate hikes at its previous two meetings.
Following this week’s rate decisions by the Bank of Japan (BoJ) and the Bank of England (BoE), market participants will be closely monitoring the RBA meeting. The possibility of a dovish pivot by the RBA remains a prominent topic of discussion.
Although the BoJ summary of opinions may not typically be a major economic release, it is expected to garner more attention than usual following the recent rate hike by the BoJ. Market participants will be eager to hear any plans for further hikes or insights into the BoJ’s expected future policy path.
Europe + UK + US
Looking ahead to the Euro Area, the US, and the UK, the economic calendar is relatively sparse. Markets are likely to focus on any hints from Fed policymakers following the recent series of weak data releases.
In the absence of high-impact data, geopolitical tensions are expected to be a significant factor influencing markets next week.
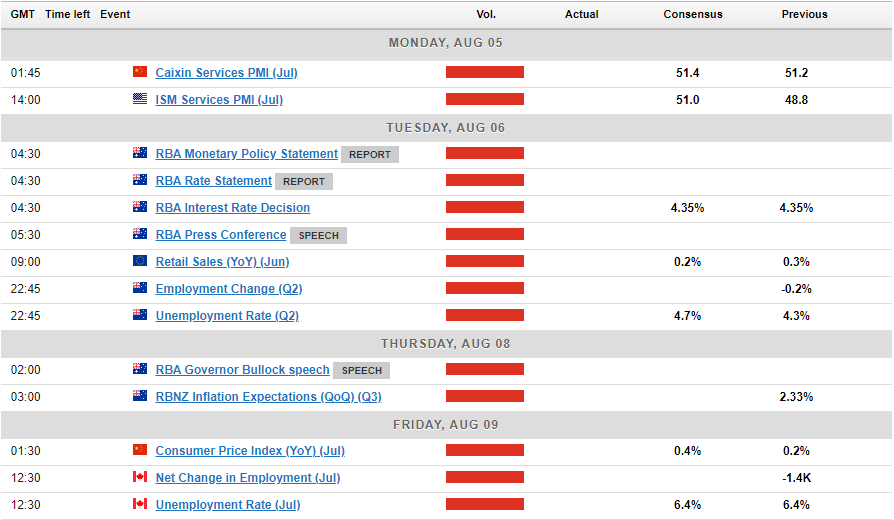
Chart of the Week
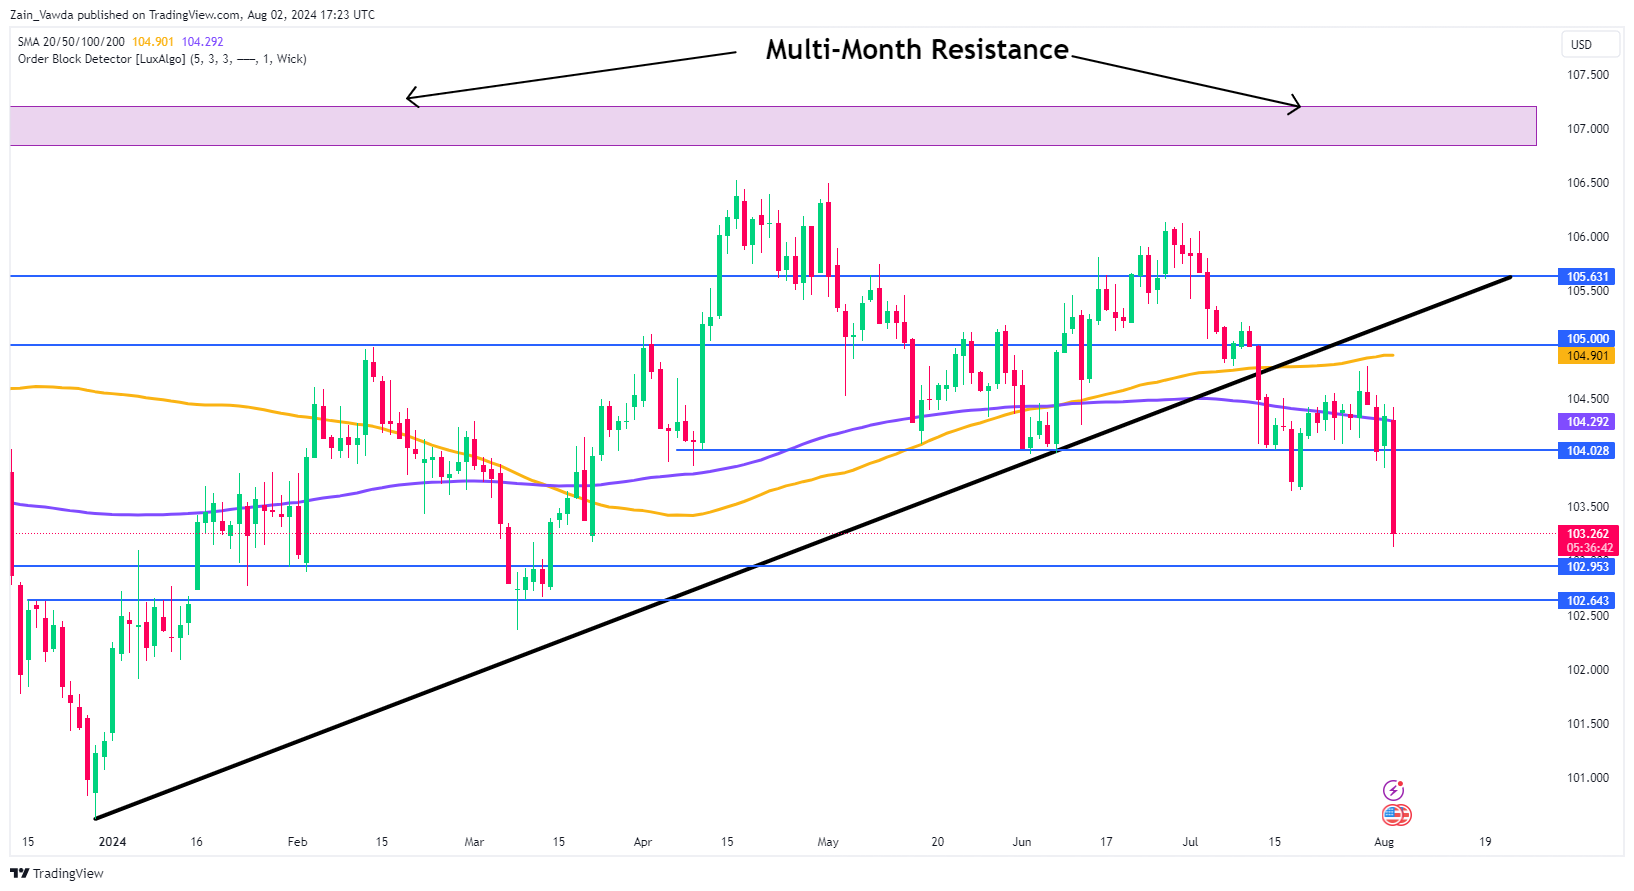
The chart of the week that I will be focusing on is the US Dollar Index (DXY). Following weak data prints and adjustments to rate cut expectations, next week could be crucial for the DXY.
Currently, the DXY is hovering just above a key support level at 103.00, with additional support around 102.64. A break below this could potentially lead to a retest of the psychological 100.00 level.
On the upside, any recovery attempt faces resistance around 103.50, followed by the 200-day moving average (MA) at 104.29. The 100-day MA is positioned just below the key psychological level of 105.00.
US Dollar Index (DXY) Daily Chart – June 28, 2024
Source:TradingView.Com (click to enlarge)
Key Levels to Consider:
Support:
- 103.00
- 102.64
- 101.50
Resistance:
- 103.50
- 104.29
- 105.00