

Sample Category Title
AUD/USD Weekly Report
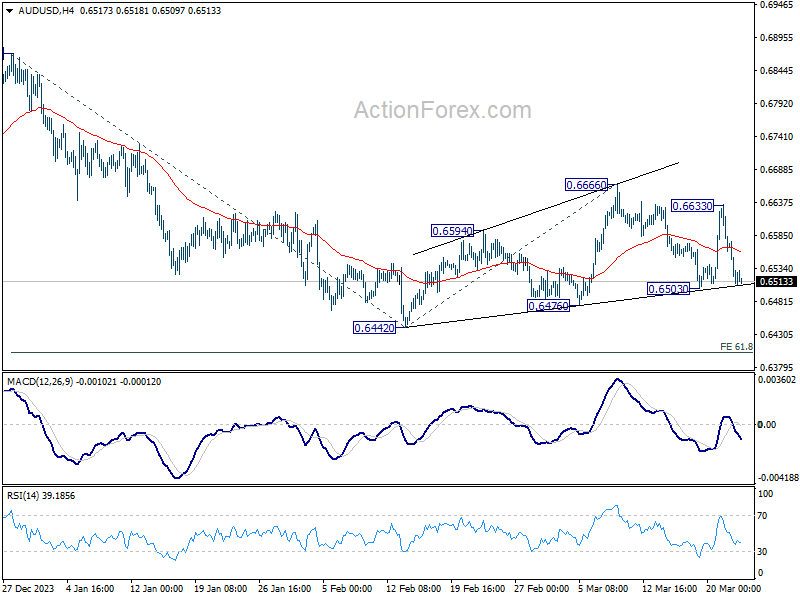
AUD/USD's strong was rebound last week was capped below 0.6666 resistance, and followed by equally steep decline. Initial bias remains neutral this week first, with focus on 0.6503 support. Decisive break there will indicate that larger fall from 0.6870 is ready to resume, and turn bias to the downside for 0.6442 low. For now, risk will stay on the downside as long as 0.6633 resistance holds, in case of recovery.
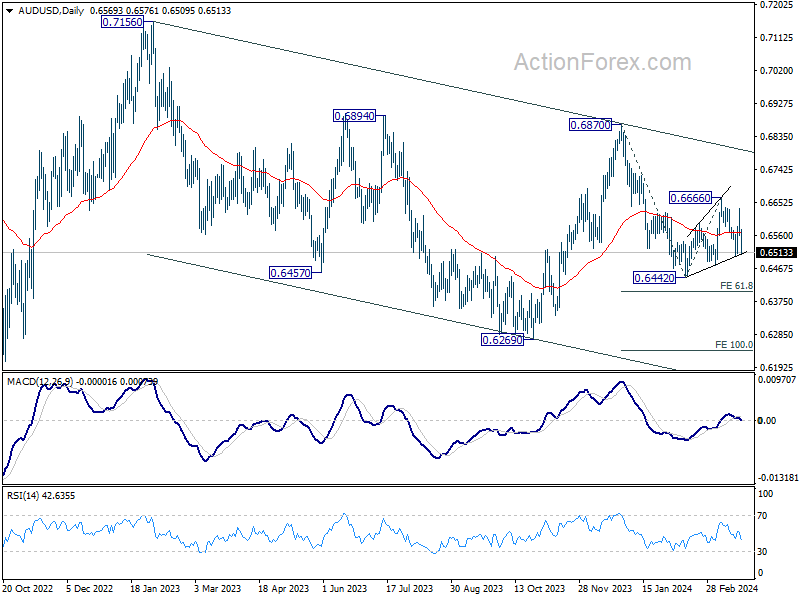
In the bigger picture, price actions from 0.6169 (2022 low) are seen as a medium term corrective pattern to the down trend from 0.8006 (2021 high). Fall from 0.7156 (2023 high) is seen as the second leg, which might still be in progress. Overall, sideway trading could continue in range of 0.6169/7156 for some more time. But as long as 0.7156 holds, an eventual downside breakout would be mildly in favor.
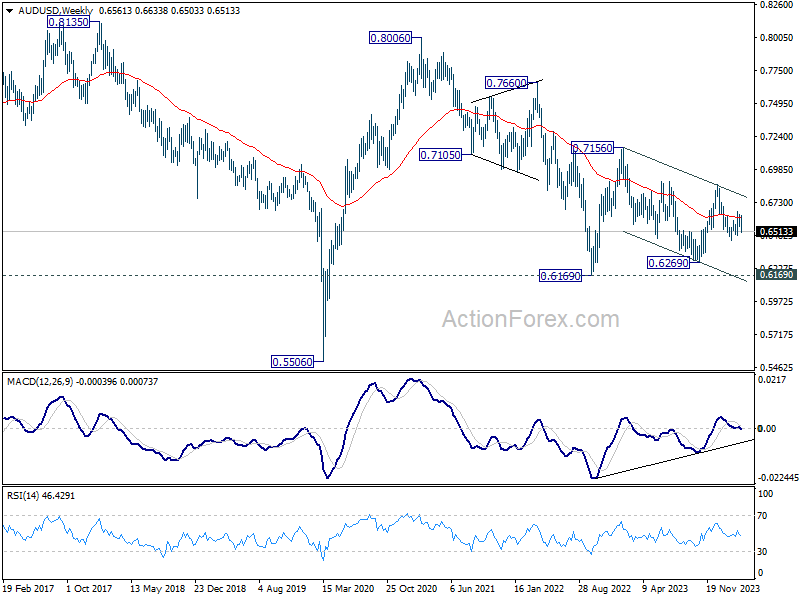
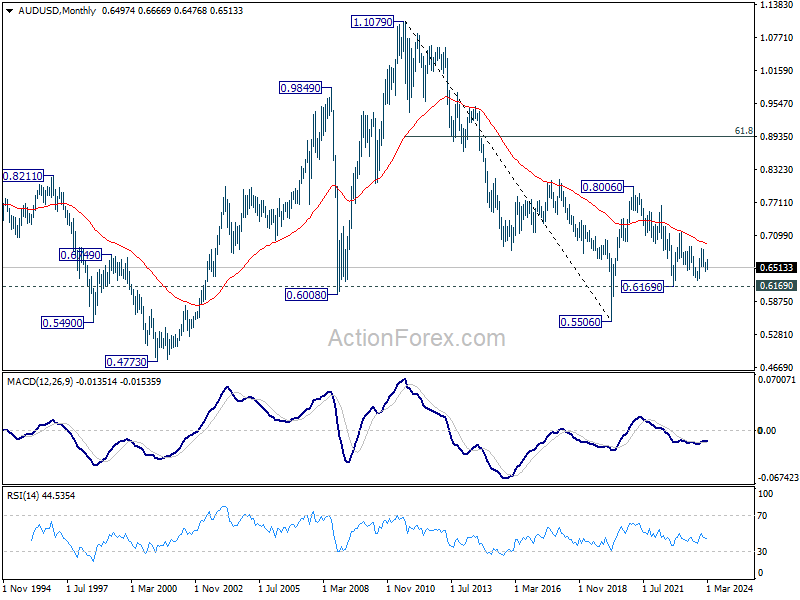
In the long term picture, the down trend from 1.1079 (2011 high) should have completed at 0.5506 (2020 low) already. It's unsure yet whether price actions from 0.5506 are developing into a corrective pattern, or trend reversal. But in either case, fall from 0.8006 is seen the second leg of the pattern. Hence, in case of deeper decline, strong support should emerge above 0.5506 to bring reversal.
USD/CAD Weekly Outlook
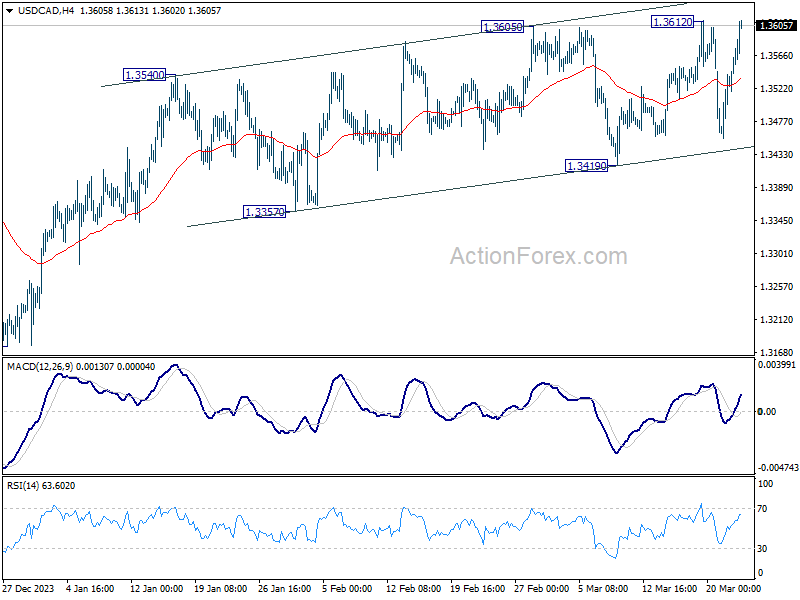
Much volatility was seen in USD/CAD last week. But after all, near term outlook remains bullish with 1.3419 support intact. Initial focus is now on 1.3612 resistance. Decisive break there will resume whole rise from 1.3176 towards 1.3897 resistance. On the downside, firm break of 1.3419 support will argue that rebound from 1.3176 has completed. Near term outlook will be turned bearish for 1.3357 support first.
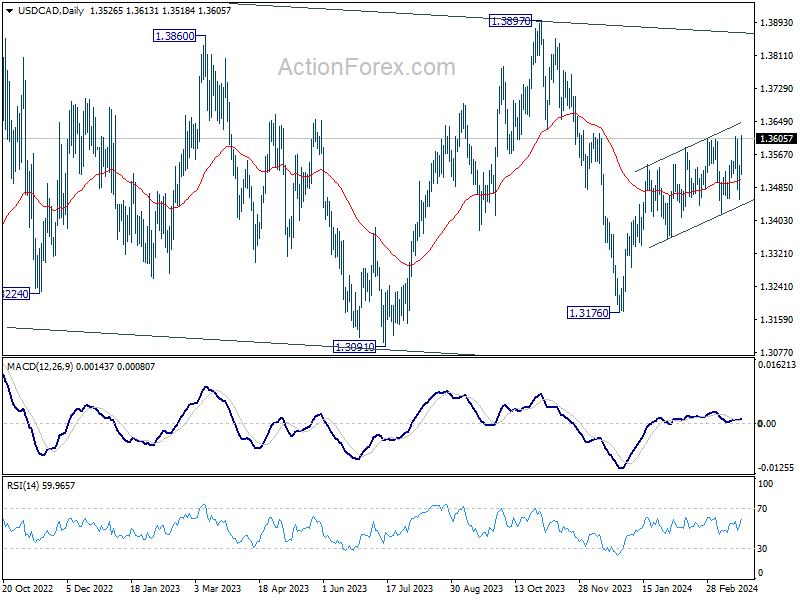
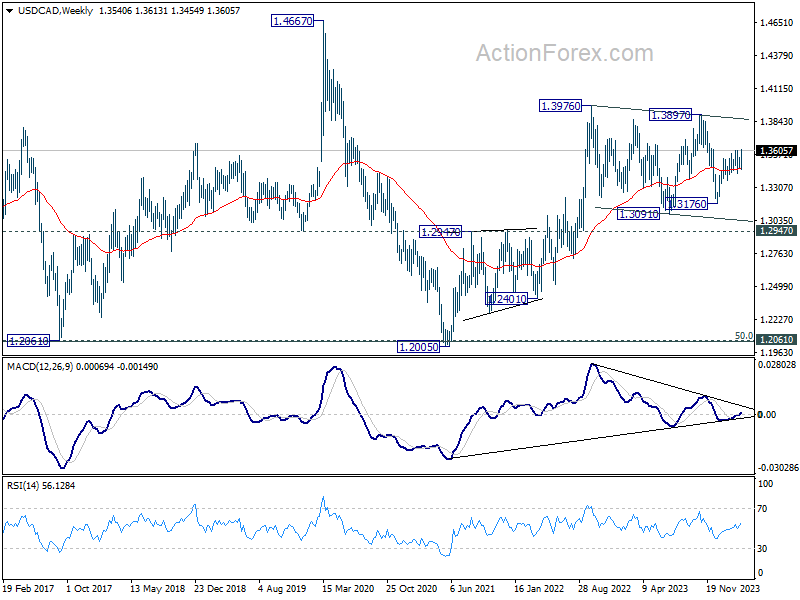
In the bigger picture, price actions from 1.3976 (2022 high) are viewed as a corrective pattern only. In case of another fall, strong support should emerge above 1.2947 resistance turned support to bring rebound. Overall, larger up trend from 1.2005 (2021 low) is still expected to resume through 1.3976 at a later stage.
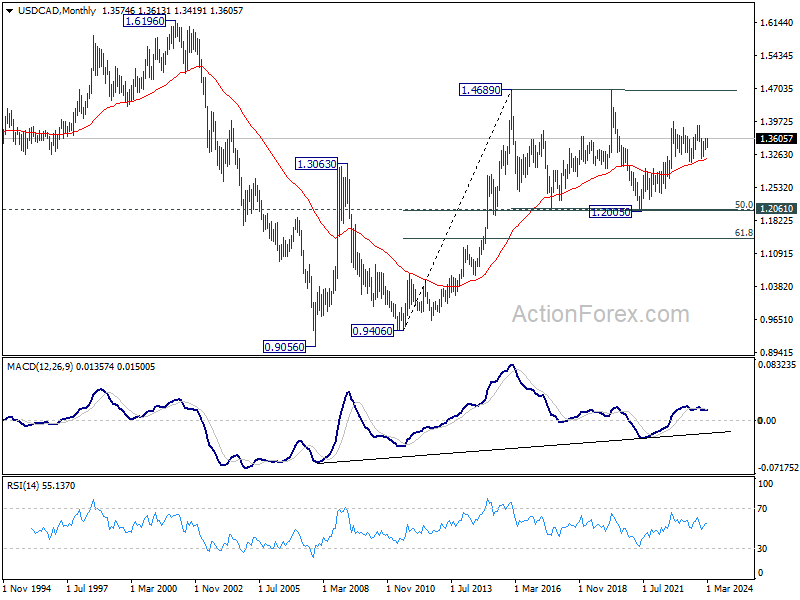
In the longer term picture, price actions from 1.4689 (2016 high) are seen as a consolidation pattern, which might have completed at 1.2005. That is, up trend from 0.9506 (2007 low) is expected to resume at a later stage. This will remain the favored case as long as 1.2947 resistance turned support holds.
GBP/JPY Weekly Outlook
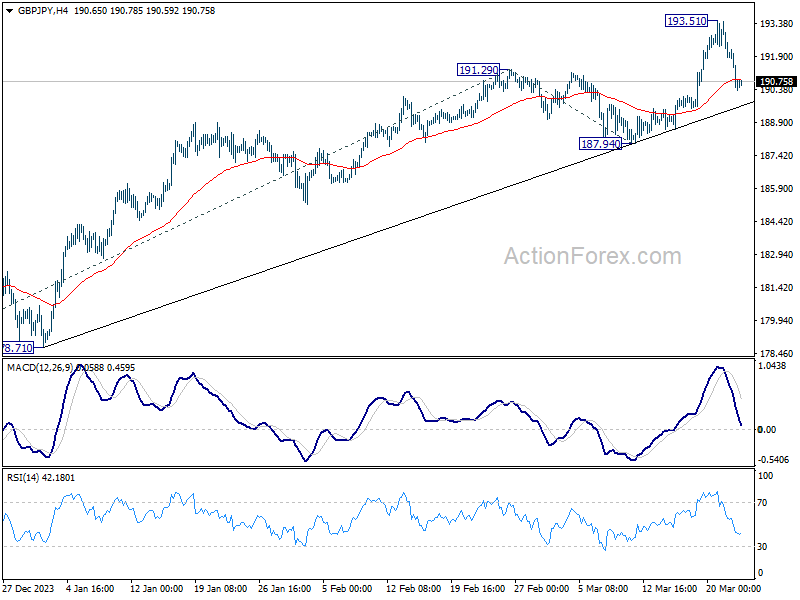
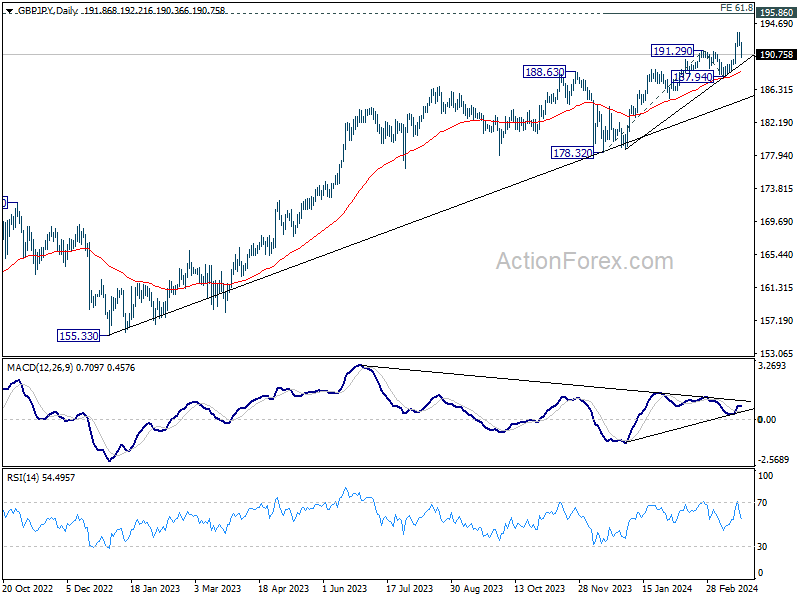
GBP/JPY's up trend resumed last week and surged to 193.51, but retreated notably since then. Initial bias remains neutral this week for more corrective trading. Nevertheless, outlook will stay bullish as long as 187.94 support holds. On the upside, break of 193.51 will resume larger up trend to 61.8% projection of 178.32 to 191.29 from 187.94 at 195.95, which is close to 195.86 long term resistance.
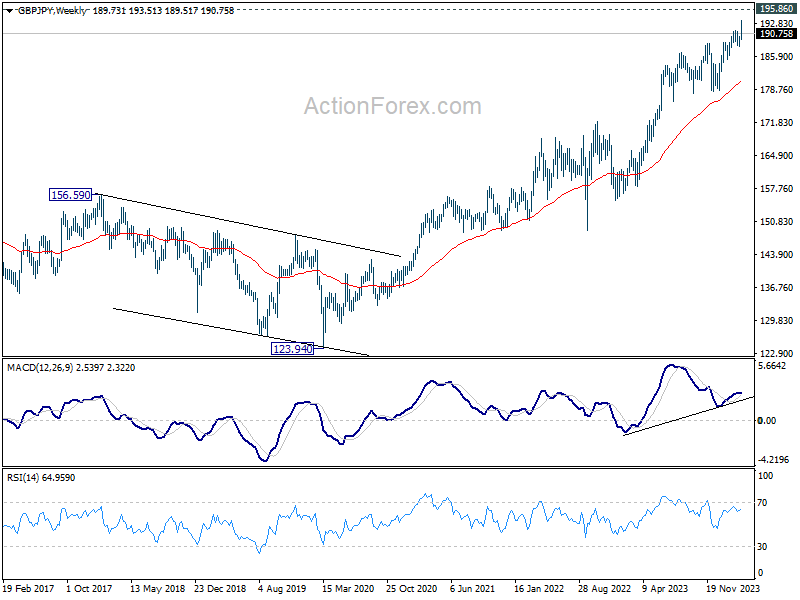
In the bigger picture, current rally is part of the up trend from 123.94 (2020 low), and is in progress for long term resistance (2015 high). Break of 187.94 support is needed to be the first sign of medium term topping. Otherwise, outlook will remain bullish in case of retreat.
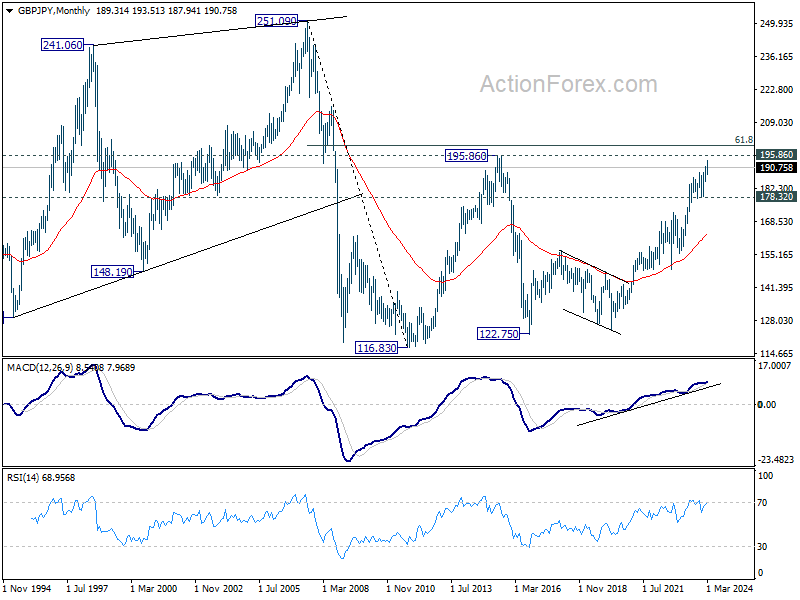
In the longer term picture, rise from 122.75 (2016 low) is seen as the third leg of the pattern from 116.83 (2011 low). Further rally will remain in favor as long as 178.32 support holds. Break of 195.86 (2015 high) is possible. But strong resistance could be seen from 61.8% retracement of 251.09 (2007 high) to 116.83 at 199.80 to limit upside, at least on first attempt.
EUR/JPY Weekly Outlook
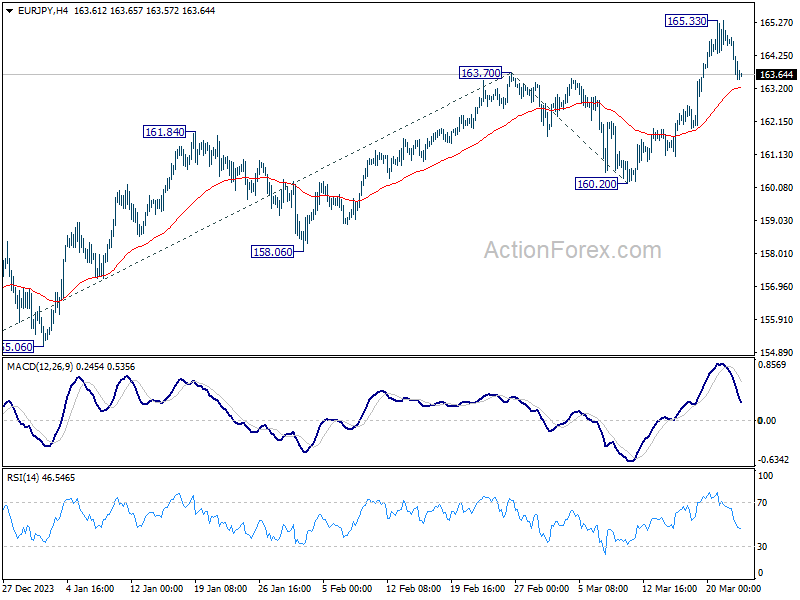
EUR/JPY's up trend resumed last week and surged to 165.33. But as a temporary top was formed with subsequent retreat, initial bias stays neutral this week for more consolidations. Downside should be contained by 55 4H EMA (now at 163.23) to bring rebound. On the upside, break of 165.33 will resume larger up trend to 61.8% projection of 153.15 to 163.70 from 160.20 at 166.71.
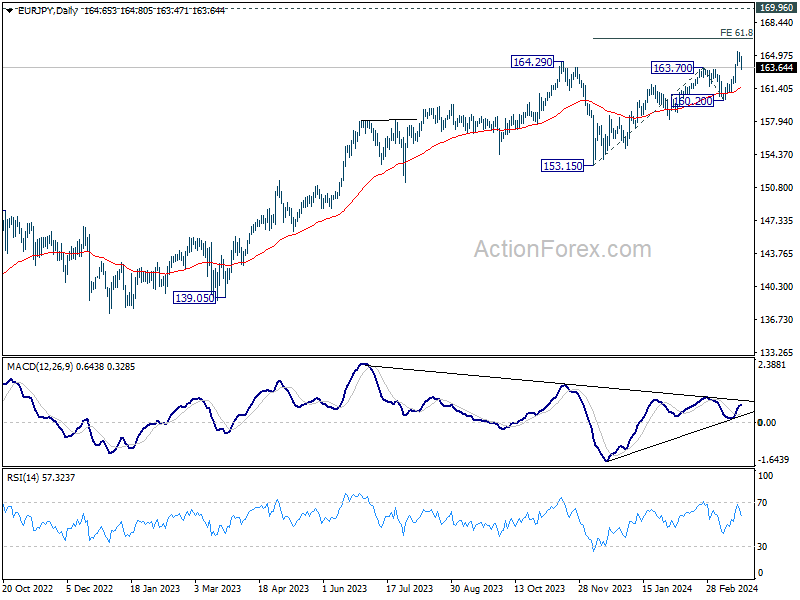
In the bigger picture, current rally is part of the up trend from 114.42 (2020 low), which is still in progress. Next target is 169.96 (2008 high). Break of 160.20 support is needed to be the first sign of medium term topping. Otherwise, outlook will stay bullish in case of retreat.
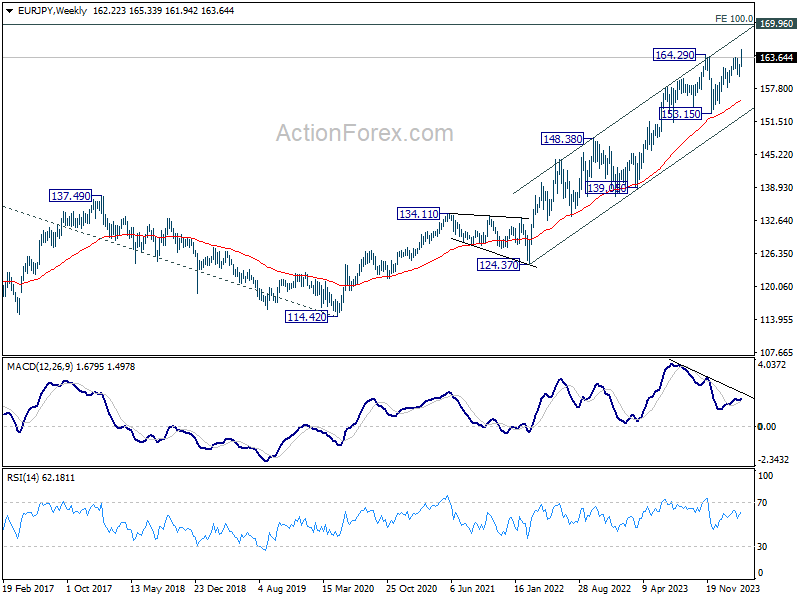
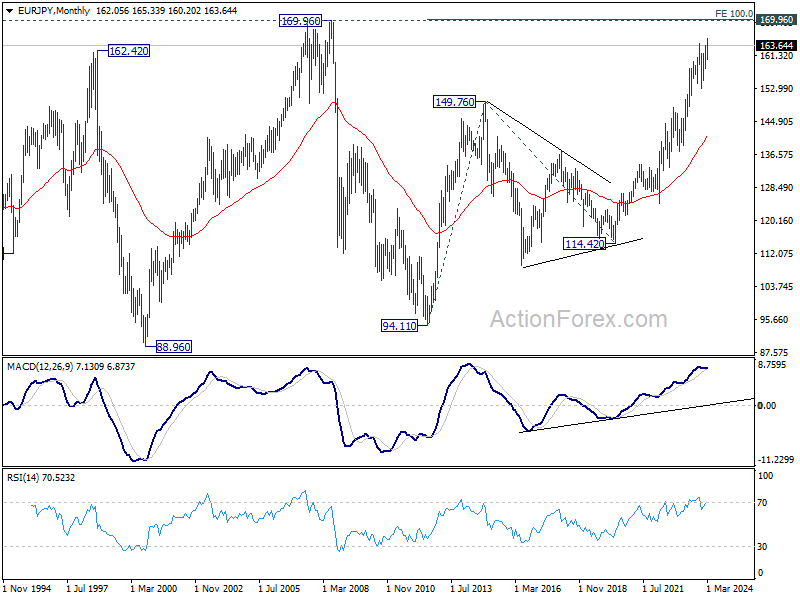
In the long term picture, rise from 114.42 (2020 low) is seen as the third leg of the whole up trend from 94.11 (2012 low). Next target is 100% projection of 94.11 to 149.76 from 114.42 at 170.07 which is close to 169.96 (2008 high). This will remain the favored case as long as 153.15 support holds.
EUR/GBP Weekly Outlook
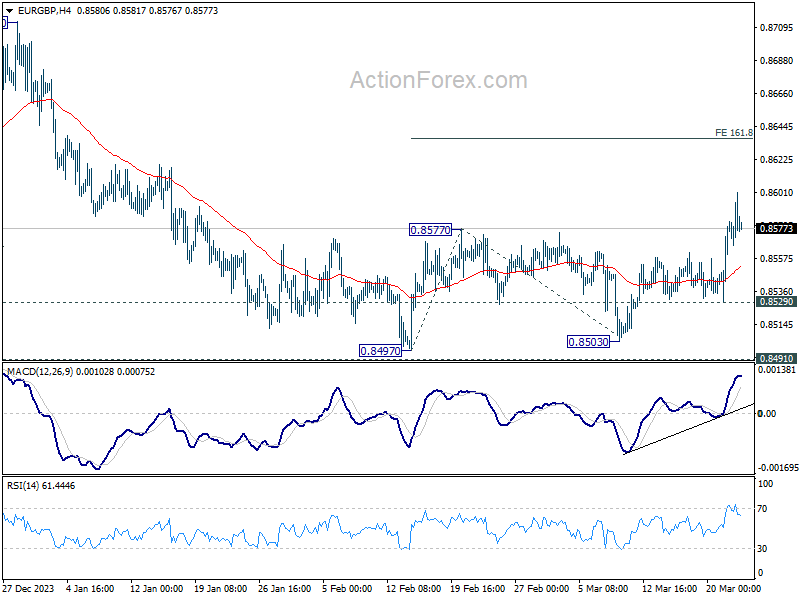
EUR/GBP's break of 0.8577 resistance and 55 D EMA (now at 0.8562) last week suggest that rebound from 0.8497 is at least correcting the fall from 0.8764. Initial bias is now on the upside this week for 161.8% projection of 0.8497 to 0.8577 from 0.8503 at 0.8632. For, further rise will remain in favor as long as 0.8529 minor support holds, in case of retreat.
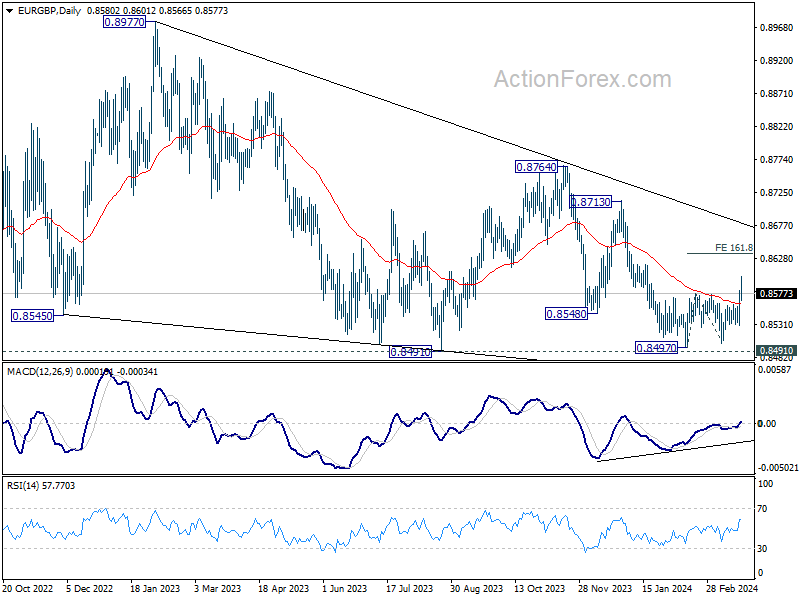
In the bigger picture, there is no clear sign that down trend from 0.9267 has completed, despite loss of downside momentum as seen in D MACD. As long as 0.8713 resistance holds, the down trend will remain in favor to resume through 0.8491 low at la later stage.
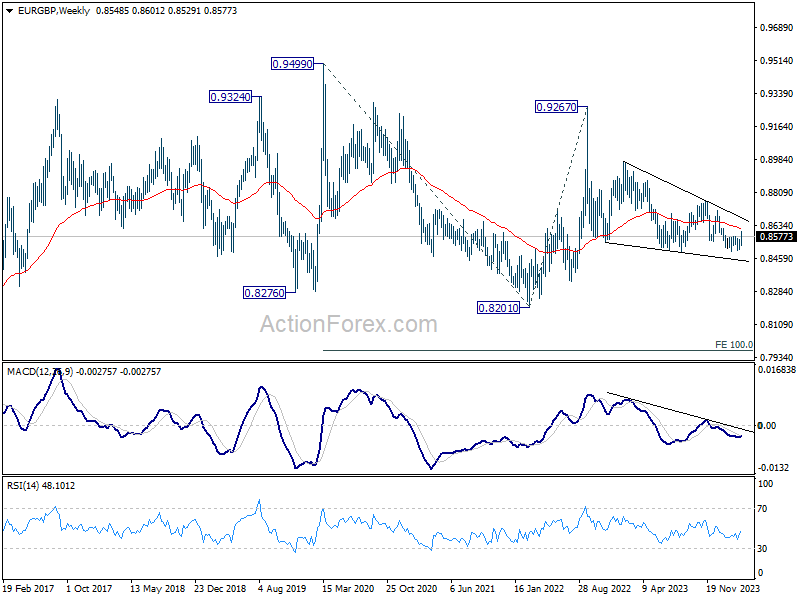
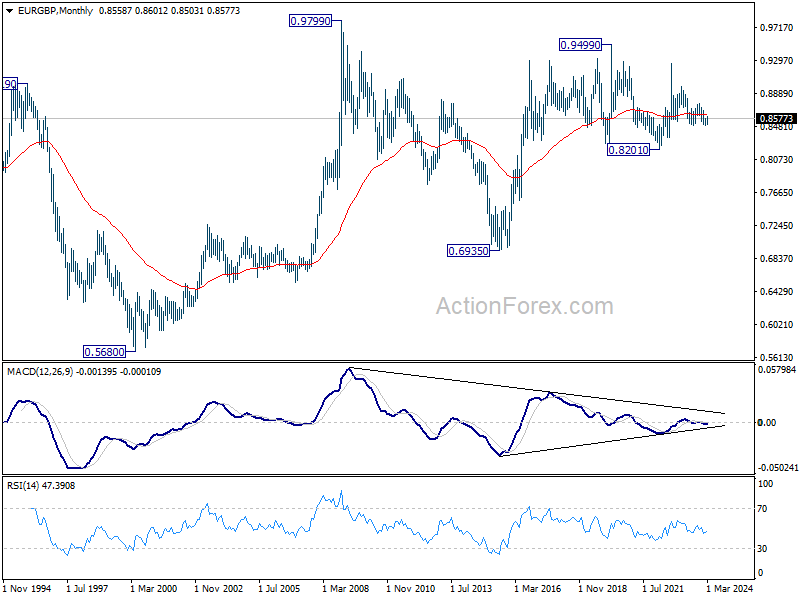
In the long term picture, price action from 0.9499 (2020 high) is seen as part of the long term range pattern from 0.9799 (2008 high). Fall from 0.9267 is the third leg of the pattern from 0.9499. Break of 0.8201 (2022 low) will target 100% projection of 0.9499 to 0.8201 from 0.9267 at 0.7969.
EUR/AUD Weekly Outlook
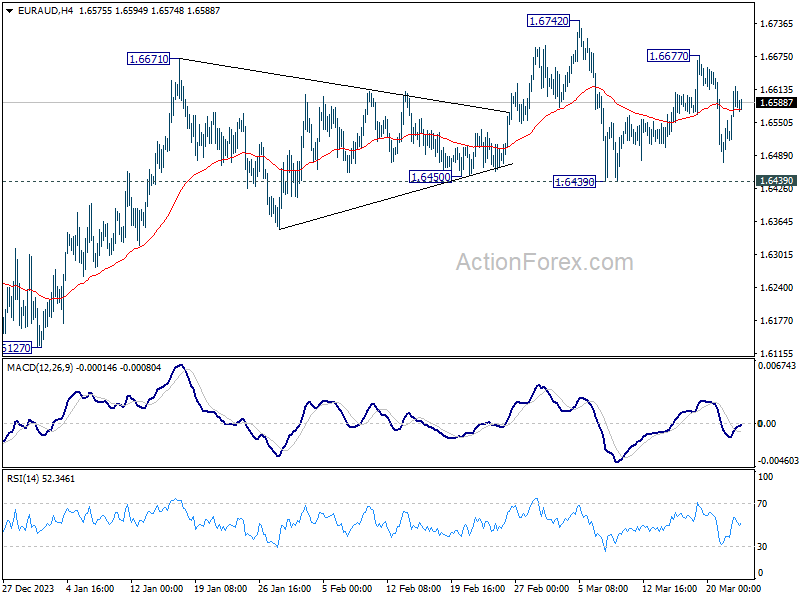
EUR/AUD stayed in consolidation in range of 1.6439/6742 last week and outlook is unchanged. Initial bias remains neutral this week first. Near term outlook will stay cautiously bullish as long as 1.6439 support holds. On the upside, above 1.6677 will target 1.6742 first. Decisive break there will resume whole rise from 1.6127 and target 1.6844 resistance next.
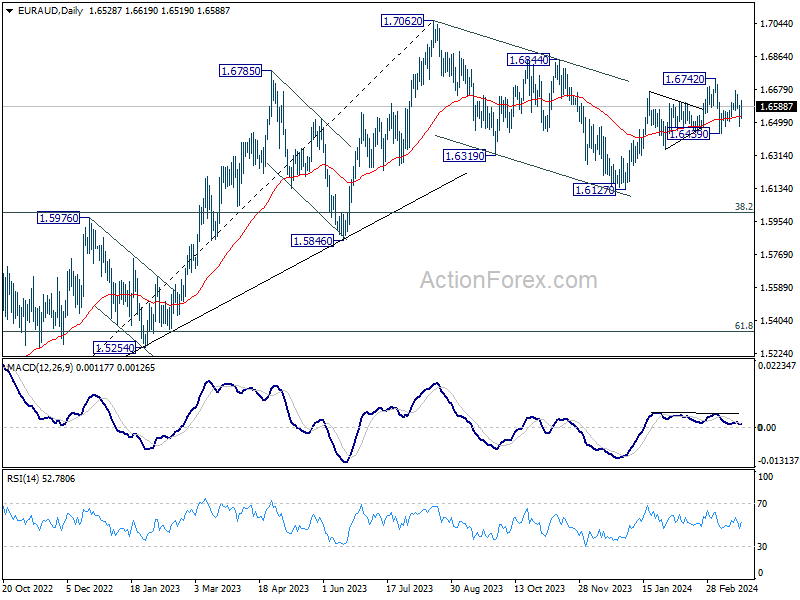
In the bigger picture, fall from 1.7062 medium term top is seen as a correction to the up trend from 1.4281 (2022 low). Break of 1.6844 resistance will argue that this up trend is ready to resume through 1.7062 high. In case of another fall, strong support should be seen around 1.5846 and 38.2% retracement of 1.4281 to 1.7062 at 1.6000 to bring rebound.
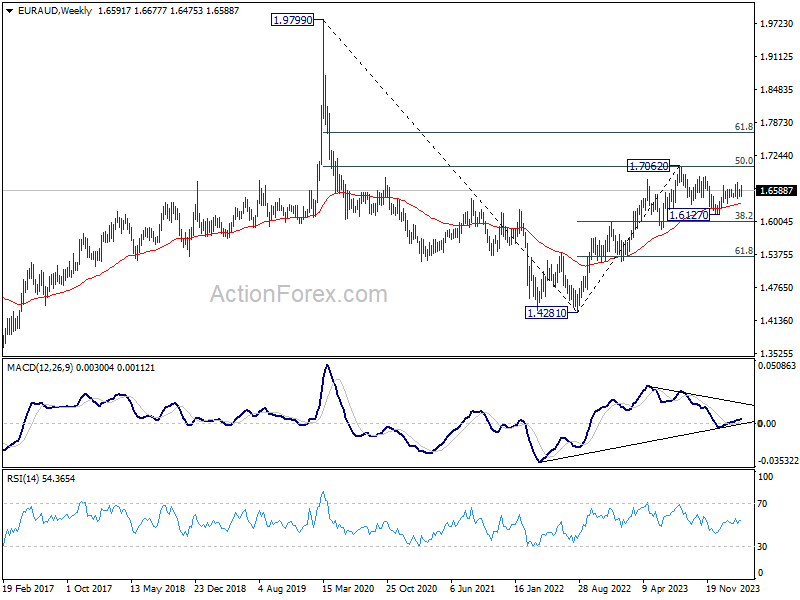
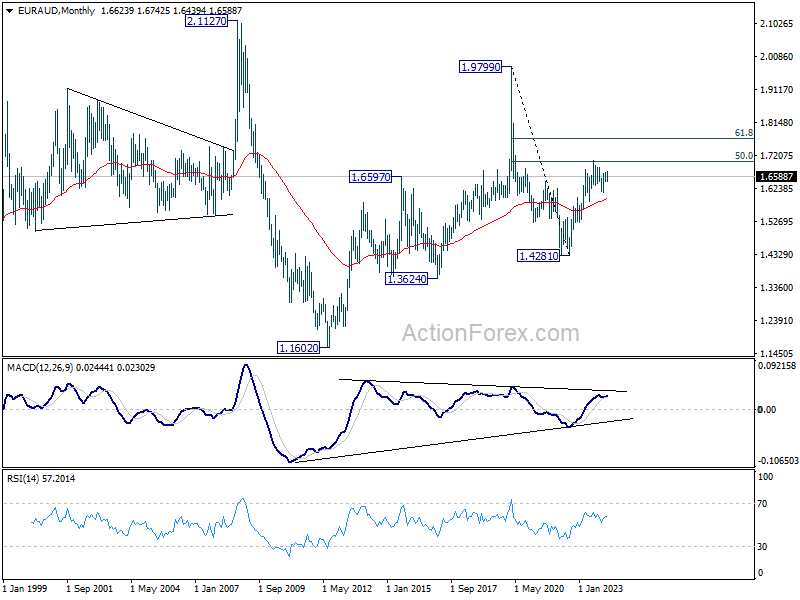
In the longer term picture, price actions from 1.9799 (2020 high) are seen as a long term decline at the same scale as the rise from 1.1602 (2012 low). Rebound from 1.4281 is seen as the second leg. As long as 55 M EMA (now at 1.5932) holds, this second leg could still extend higher. However, sustained trading below 55 M EMA will open up the bearish case for extending the decline through 1.4281 low.
EUR/CHF Weekly Outlook
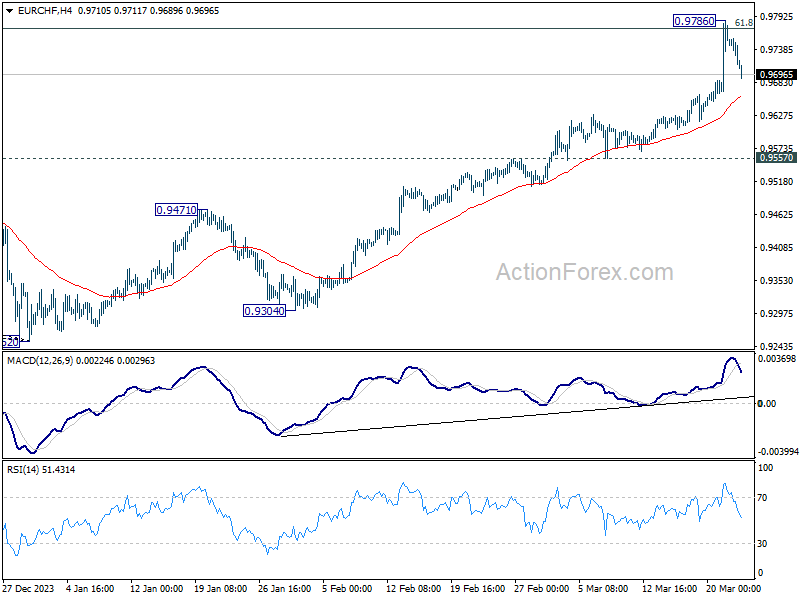
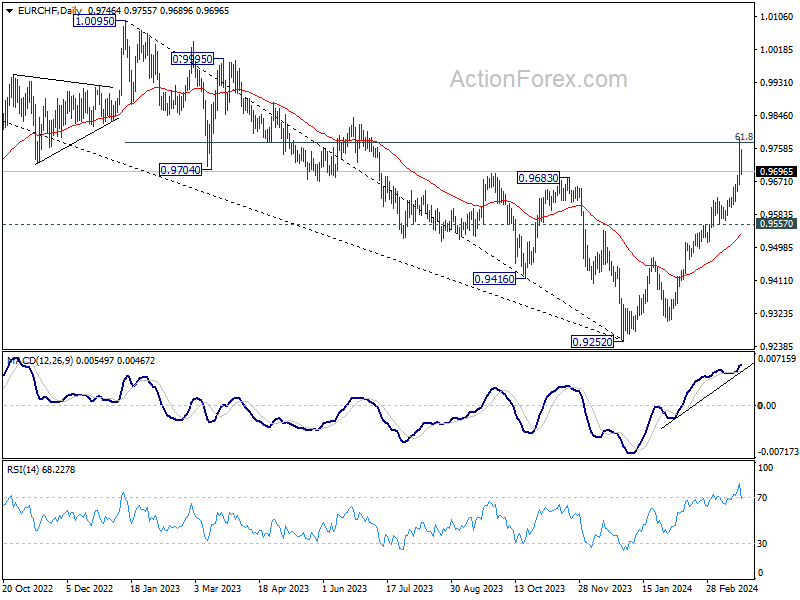
EUR/CHF's rally accelerated to as high as 0.9786 last week. But a temporary top should be formed after hitting 61.8% retracement of 1.0095 to 0.9252 at 0.9773. Initial bias is turned neutral this week for some consolidations. Downside of retreat should be contained by 0.9557 support to bring rebound. On the upside, above 0.9786 will resume the rally towards 1.0095 resistance next.
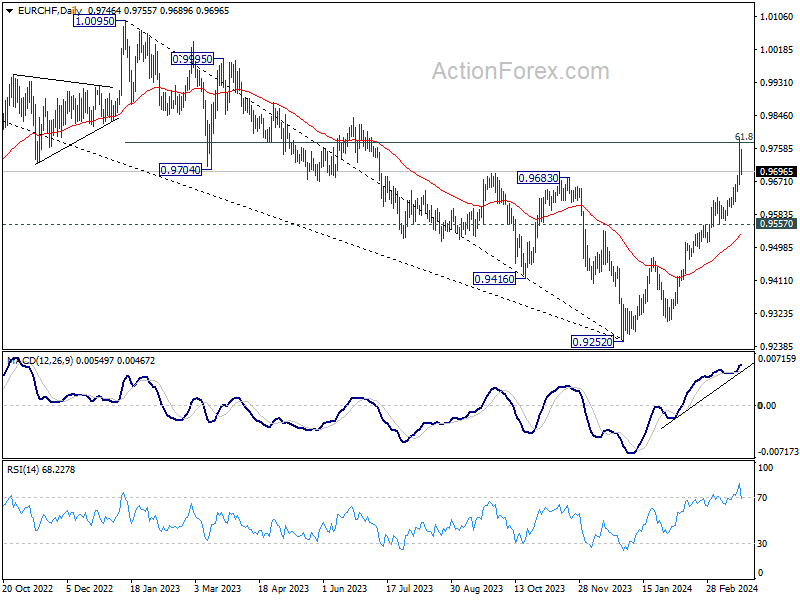
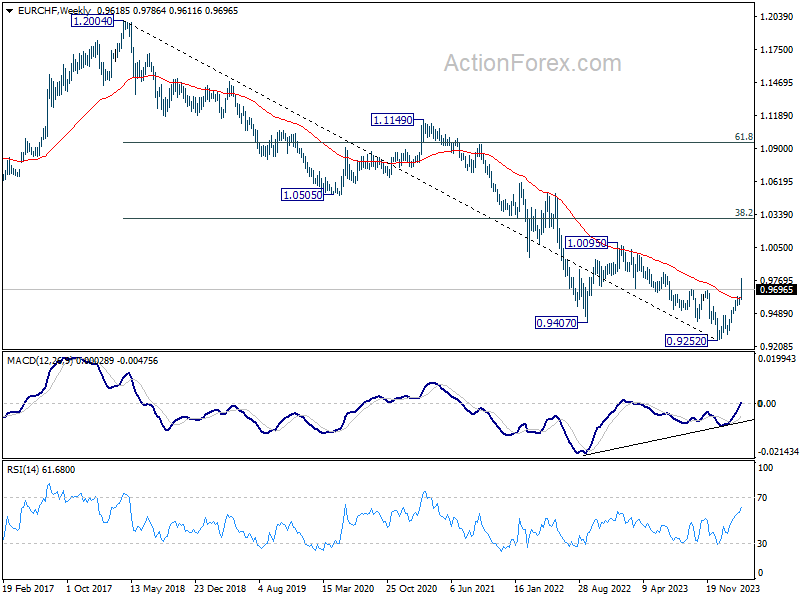
In the bigger picture, a medium term bottom should be in place at 0.9252 already, on bullish convergence condition in W MACD. Rise from there would now target 38.2% retracement of 1.2004 (2018 high) to 0.9252 (2023 low) at 1.0303, even as a correction to the down trend from 1.2004. This will remain the favored case as long as 55 D EMA (now at 0.9535) holds.
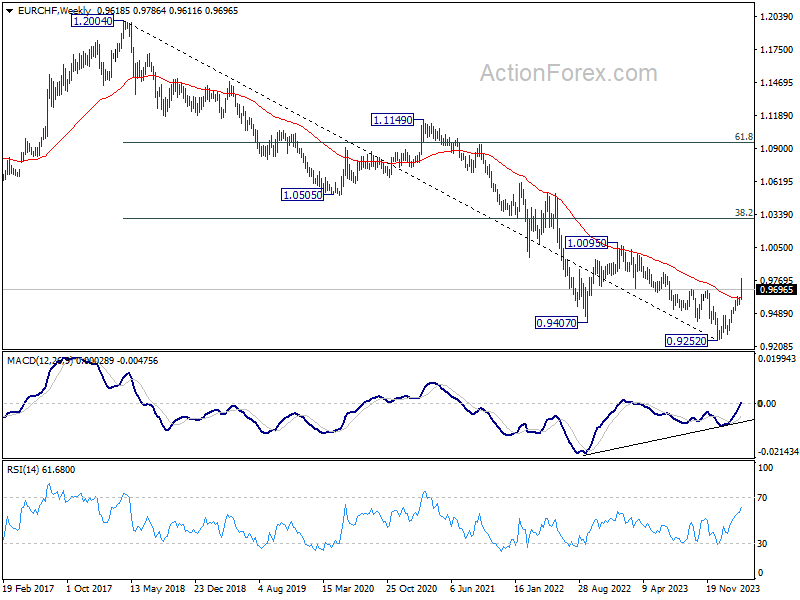
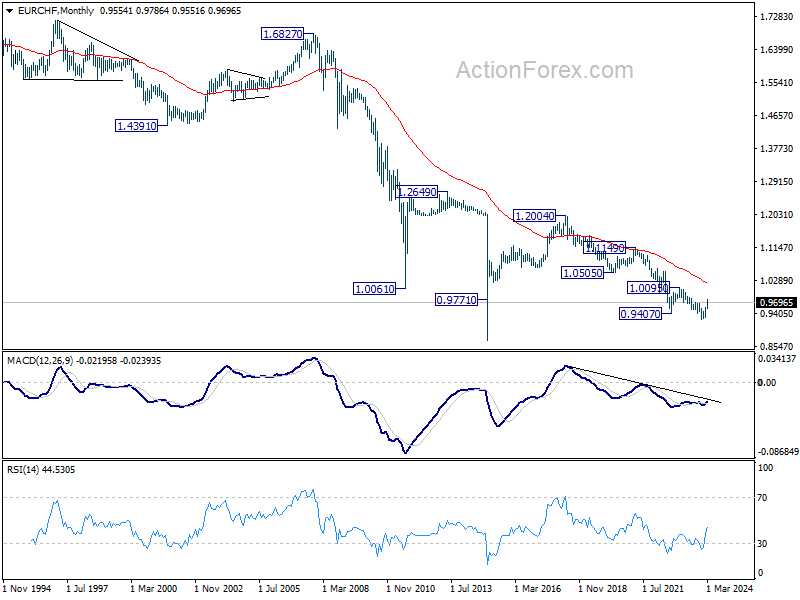
In the long term picture, fall from 1.2004 (2018 high) is part of the multi-decade down trend. Firm break of 1.0095 resistance is needed to be the first sign of long term bottoming. Otherwise, outlook will remain bearish.
Dollar Triumphs Following a Turbulent Week of Central Bank Shocks
The past week in the currency markets was a dramatic whirlwind, marked by pivotal moves from major central banks across the globe. From BoJ's unexpected hike to SNB's surprise cut, from Fed's hawkish leaning projections to BoE's dovish voting, they collectively orchestrated a much volatile than usual trading environment.
Amidst this chaos, Dollar emerged victorious as the best performer. The technical picture in Dollar index suggests that more upside is likely in the greenback for the near term. Conversely, Swiss Franc and Japanese Yen bore the brunt of these developments, ending the week as the two worst performers by a mile. However, their late recovery indicate short-term stabilization, offering a reprieve from their downward spirals.
As the dust settles, attention shifts towards identifying the next currency at risk of an intensified downturn. British Pound is a candidate following BoE's dovish pivot, which has ignited speculation about rate cut as soon as June. At least, it's probably now already in a near term bearish reversal against Euro.
Furthermore, while New Zealand Dollar has already been under pressure due to concerns over the nation's economic outlook, as voiced by New Zealand's Finance Minister, Australian Dollar might be next in line. The steep plunge in Chinese Yuan last week, if sustained, could precipitate a broader sell-off in the stock markets of China and Hong Kong, adversely affecting Aussie in the process.
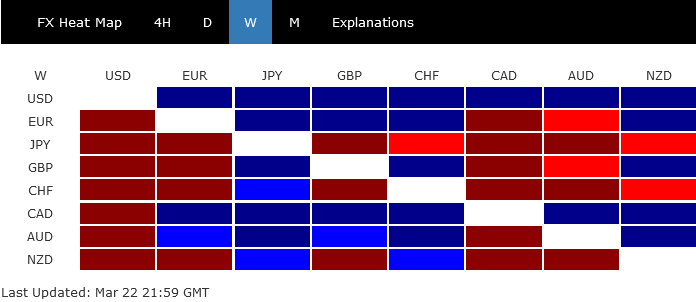
Dollar Dominates After Fed's Hawkish Tilt
Following a turbulent week, Dollar eventually asserted its dominance and ended as the stronger performer. The new dot plot accompanying Fed's rate decision to keep rate steady at 5.25-5.50% might have initially perceived as dovish. Fed maintained the projection of three rate cuts this year, tentatively placing the first reduction in June.
Upon a more detailed review, however, it became apparent that Fed's stance had subtly shifted towards a more hawkish orientation instead. This shift is illustrated by a nearly even split among FOMC members, with nine anticipating two rate cuts and ten forecasting three within the year—a notable change from December's 8-11 split. Furthermore, Fed's projections suggest a more gradual path to easing, with the federal funds rate expected to decrease to 3.875% by the end of 2025 (vs prior 3.625%) and 3.125% by the end of 2026 (vs prior 2.875%). This revised outlook, including a slight increase in the long-term federal funds rate estimate from 2.5% to 2.6%, indicates that the projections are clearly not dovish at all.
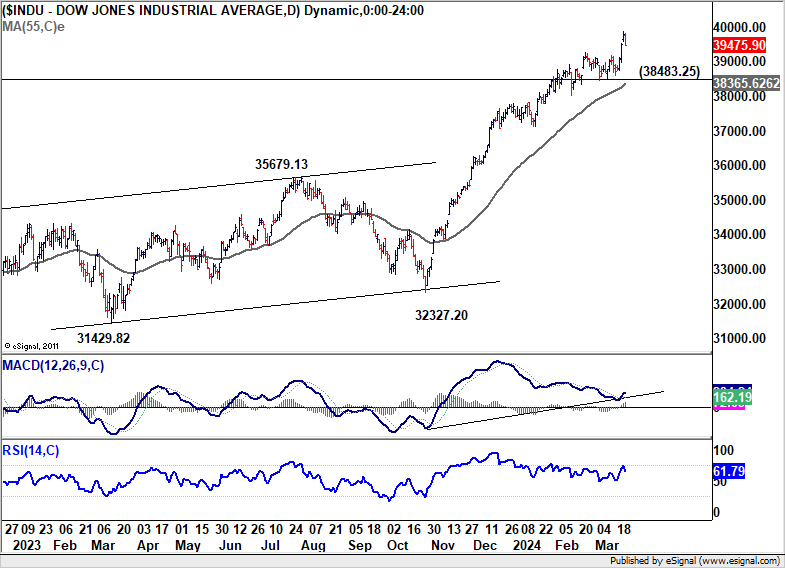
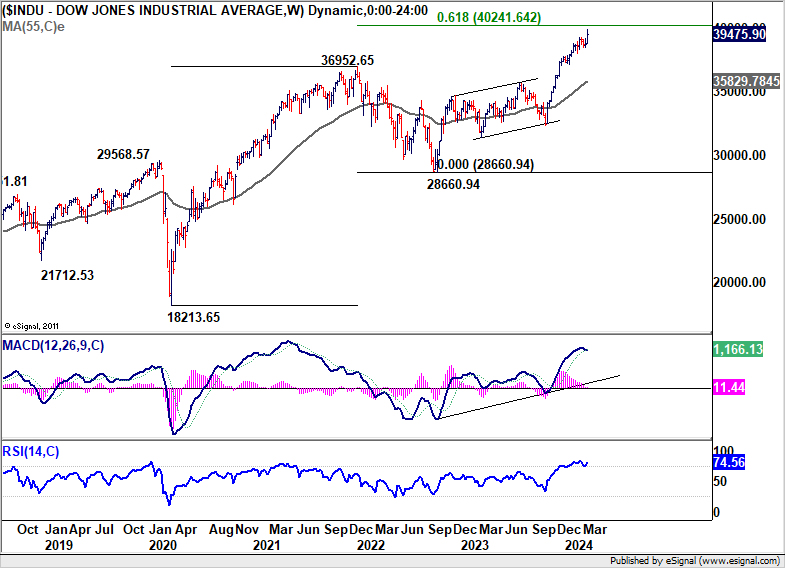
Regarding market reactions, DOW surged to new record high at 39889.05 last week. While DOW ended -305 pts lower on Friday, it still notched the best week since December. Next term outlook will stay bullish as long as 38483.25 support holds. The question is whether DOW has enough momentum to rise through 40k handle sustainably, considering that 61.8% projection of 18213.65 to 36952.65 from 28550.94 at 40251.64 is around.
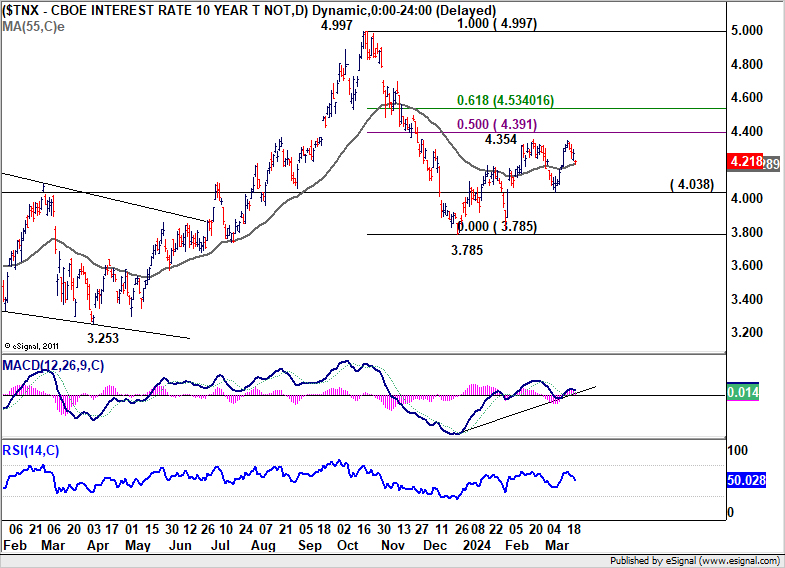
10-year yield failed to break through 4.354 resistance and restreated to close at 4.218. For now, it looks like the range is set for some sideway trading for the near term, between 4.038 and 50% retracement of 4.997 to 3.785 at 4.391. Or in short, the range is set between 4.0-4.4. Break of 4.000 is unlikely until there is firm indication that Fed' easing has started.
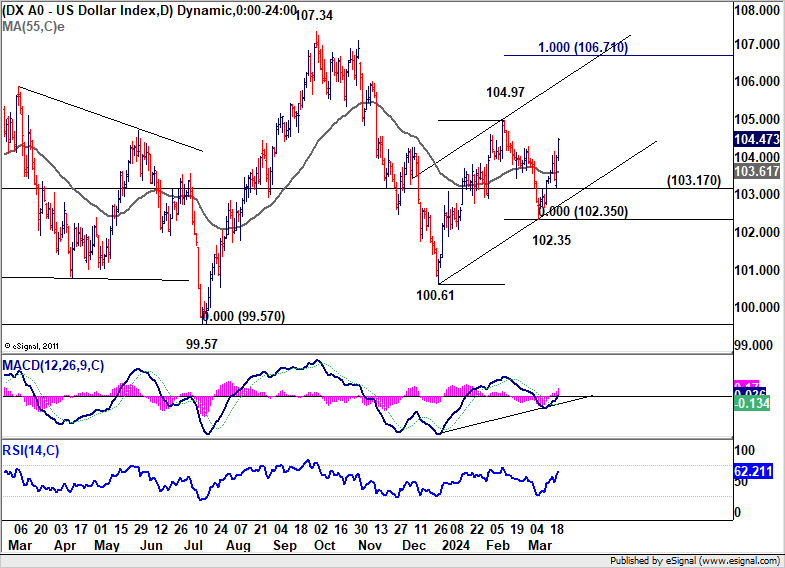
Dollar Index's strong rally suggests that pull back from 104.97 has completed at 102.35 already. Rise from there is likely resuming the rise from 100.61, which is the third leg of the pattern from 99.67 low. Near term outlook will stay cautiously bullish as long as 103.17 support holds. Break of 104.97 should pave the way to 100% projection of 100.61 to 104.97 from 102.35 at 106.71.
BoJ's Rate Increase Marks a Historic Shift, Yet Steady Tightening Is Not Imminent
Investors responded very positively to BoJ's surprised move to raise its interest rate to 0-0.1% and conclude its long-standing Yield Curve Control policy. This historic adjustment sent shockwaves through the markets, propelling Nikkei to unprecedented heights while concurrently sending Yen into a nosedive.
The reactions reflected market's interpretation of BoJ's actions as a strategic overhaul of the monetary policy framework, rather than the commencement of a sustained tightening cycle. While there are talks around the possibility of another rate hike in the latter half of the year, such discussions remain speculative at this juncture.
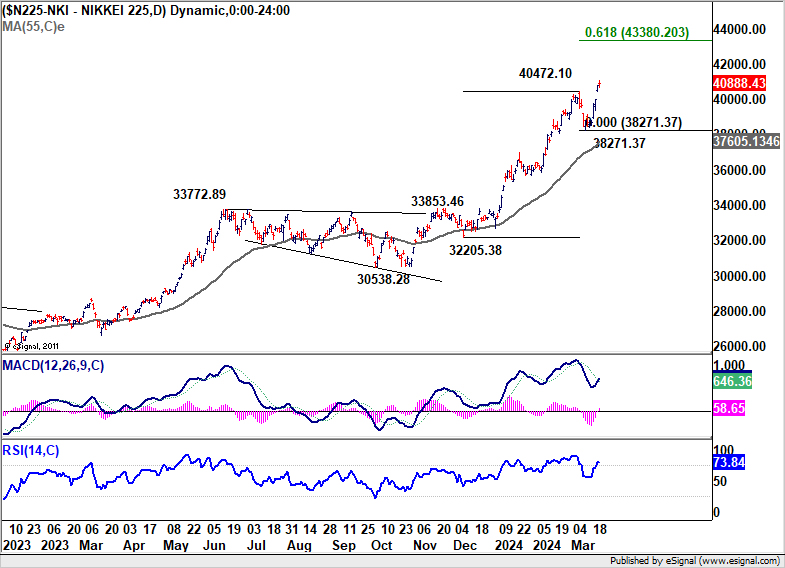
Nikkei's up trend resumed last week and hit as high as 41087.75. Near term outlook will stay bullish as long as 38271.37 support holds. Next target is 61.8% projection of 32205.38 to 40472.10 from 38271.37 at 43380.23. There is prospect of topping around this projection level to end the five wave rally from 30538.28, to start a medium term correction phase.
BoE's Dovish Pivot, FTSE Gains Momentum
While BoE left interest rate unchanged at 5.25% last week, the voting and subsequent comment from Governor Andrew Bailey were seen as a dovish pivot, setting the stage for the start of interest rate reduction later in the year. Firstly hawks Jonathan Haskel and Catherine Mann dropped their votes for hike this round, while Swati Dhingra advocating for a reduction again, making it an 8-1 split to stand pat.
Bailey's remarks reinforced this perspective, acknowledging the market's expectations for three rate reductions within the year as "reasonable." This commentary has led to increased speculation in financial markets, June is now seen as a possibility for the first cut, with bets now fully pricing in by August. Further, markets are anticipating a total of three reductions by the year's end, which would lower rates to 4.5% by December.
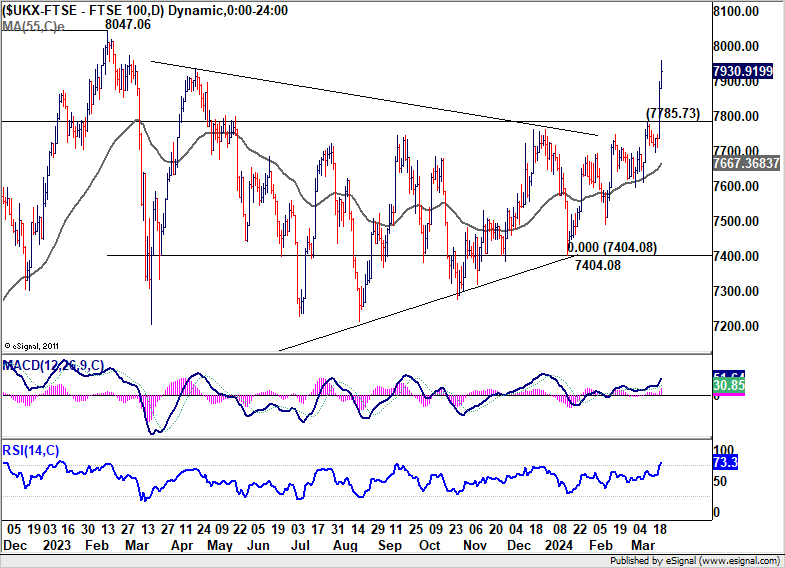
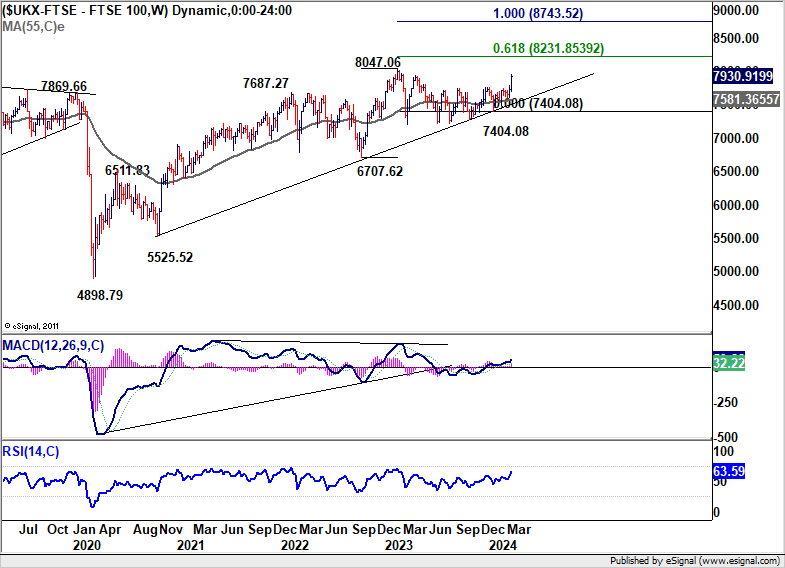
FTSE, the laggard index comparing to DOW, DAX and CAC, appeared to be finally catching up. The strong rally last week suggests that triangle consolidation from 8047.06 has completed, larger up trend could be ready to resume. Near term outlook will now stay bullish as long as 7785.73 resistance turned support holds. 61.8% projection of 6707.62 to 8047.06 from 7404.08 at 8231.85 would be the key level to determine FTSE's underlying medium term momentum.
Swiss Franc's Bearish Turn after SNB's Rate Cut
Swiss Franc was sold off deeply after SNB's surprised rate cut, and ended as the worst performer. Franc's late recovery may hint that the initial selling frenzy might have peaked. However, that could only offer a momentary respite for the France as the bearish trend has likely been established already.
EUR/CHF rose to as high as 0.9786 but retreated after hitting 61.8% retracement of 1.0095 to 0.9252 at 0.9773. Some consolidations would be seen below this level in the near term. But downside of retreat should be contained above 0.9557 support to bring rebound.
The strong break of 55 W EMA argues that a medium term bottom was formed at 0.8252 on bullish convergence condition in W MACD. Rise from there should now target 1.0095 resistance or further to 38.2% retracement of 1.2004 (2018 high) to 0.9252 (2023 low) at 1.0303, even as a corrective bounce in the long term down trend.
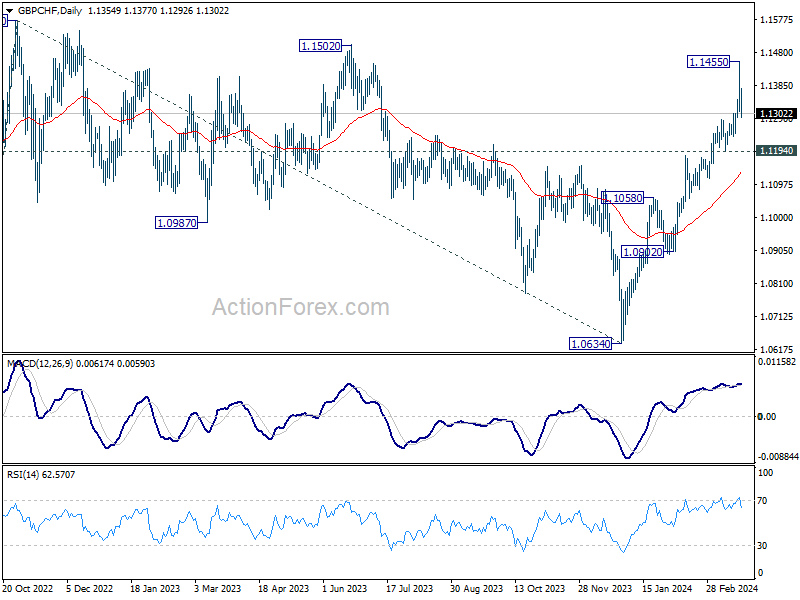
GBP/CHF also retreated after rising to 1.1455. Some consolidations is likely in the near term, but downside of retreat should be contained above 1.1194 support to bring rebound.
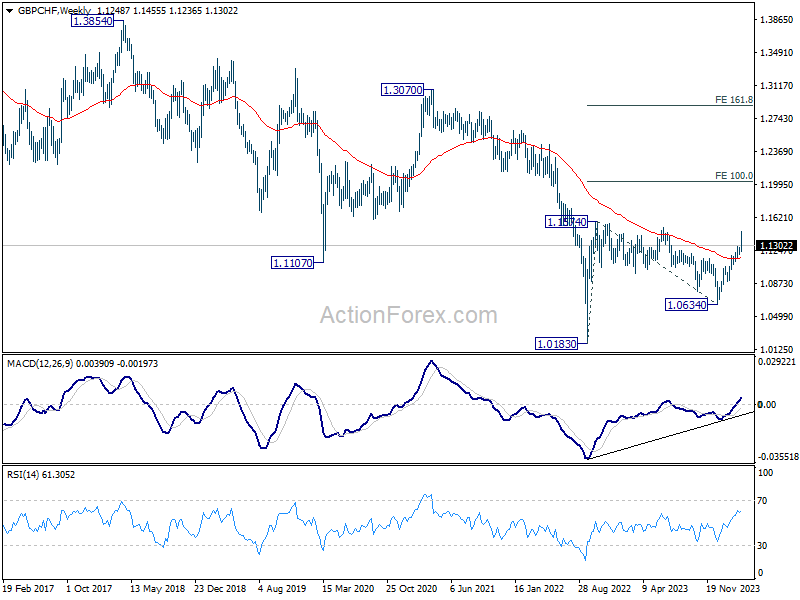
Current development affirms the case that rise from 1.0634 is resuming whole rally from 1.0183. Break of 1.1574 resistance will confirm and target 100% projection of 1.0183 to 1.1574 from 1.0634 at 1.2025 in the medium term.
AUD/USD Weekly Report
AUD/USD's strong was rebound last week was capped below 0.6666 resistance, and followed by equally steep decline. Initial bias remains neutral this week first, with focus on 0.6503 support. Decisive break there will indicate that larger fall from 0.6870 is ready to resume, and turn bias to the downside for 0.6442 low. For now, risk will stay on the downside as long as 0.6633 resistance holds, in case of recovery.
In the bigger picture, price actions from 0.6169 (2022 low) are seen as a medium term corrective pattern to the down trend from 0.8006 (2021 high). Fall from 0.7156 (2023 high) is seen as the second leg, which might still be in progress. Overall, sideway trading could continue in range of 0.6169/7156 for some more time. But as long as 0.7156 holds, an eventual downside breakout would be mildly in favor.
In the long term picture, the down trend from 1.1079 (2011 high) should have completed at 0.5506 (2020 low) already. It's unsure yet whether price actions from 0.5506 are developing into a corrective pattern, or trend reversal. But in either case, fall from 0.8006 is seen the second leg of the pattern. Hence, in case of deeper decline, strong support should emerge above 0.5506 to bring reversal.
Summary 3/25 – 3/29
Monday, Mar 25, 2024
| GMT | Ccy | Events | Consensus | Previous |
|---|---|---|---|---|
| 23:50 | JPY | BoJ Minutes | ||
| 14:00 | USD | New Home Sales Feb | 675K | 661K |
| 23:30 | AUD | Westpac Consumer Confidence Mar | 6.20% | |
| 23:50 | JPY | Corporate Service Price Index Y/Y Feb | 2.00% | 2.10% |
| GMT | Ccy | Events | |
|---|---|---|---|
| 23:50 | JPY | BoJ Minutes | |
| Forecast: | Previous: | ||
| 14:00 | USD | New Home Sales Feb | |
| Forecast: 675K | Previous: 661K | ||
| 23:30 | AUD | Westpac Consumer Confidence Mar | |
| Forecast: | Previous: 6.20% | ||
| 23:50 | JPY | Corporate Service Price Index Y/Y Feb | |
| Forecast: 2.00% | Previous: 2.10% | ||
Tuesday, Mar 26, 2024
| GMT | Ccy | Events | Consensus | Previous |
|---|---|---|---|---|
| 07:00 | EUR | Germany Gfk Consumer Confidence Apr | -27.8 | -29 |
| 12:30 | USD | Durable Goods Orders Feb | 1.30% | -6.20% |
| 12:30 | USD | Durable Goods Orders ex-Trans Feb | 0.40% | -0.40% |
| 12:30 | USD | Durable Goods Orders ex Defense Feb | 1.30% | -7.40% |
| 13:00 | USD | S&P/CS Composite-20 HPI Y/Y Jan | 6.20% | 6.10% |
| 13:00 | USD | Housing Price Index M/M Jan | 0.20% | 0.10% |
| 14:00 | USD | Consumer Confidence Mar | 107.2 | 106.7 |
| GMT | Ccy | Events | |
|---|---|---|---|
| 07:00 | EUR | Germany Gfk Consumer Confidence Apr | |
| Forecast: -27.8 | Previous: -29 | ||
| 12:30 | USD | Durable Goods Orders Feb | |
| Forecast: 1.30% | Previous: -6.20% | ||
| 12:30 | USD | Durable Goods Orders ex-Trans Feb | |
| Forecast: 0.40% | Previous: -0.40% | ||
| 12:30 | USD | Durable Goods Orders ex Defense Feb | |
| Forecast: 1.30% | Previous: -7.40% | ||
| 13:00 | USD | S&P/CS Composite-20 HPI Y/Y Jan | |
| Forecast: 6.20% | Previous: 6.10% | ||
| 13:00 | USD | Housing Price Index M/M Jan | |
| Forecast: 0.20% | Previous: 0.10% | ||
| 14:00 | USD | Consumer Confidence Mar | |
| Forecast: 107.2 | Previous: 106.7 | ||
Wednesday, Mar 27, 2024
| GMT | Ccy | Events | Consensus | Previous |
|---|---|---|---|---|
| 00:00 | AUD | Westpac Leading Index M/M Feb | -0.10% | |
| 00:30 | AUD | Monthly CPI Y/Y Feb | 3.50% | 3.40% |
| 09:00 | CHF | Credit Suisse Economic Expectations Mar | 10.2 | |
| 10:00 | EUR | Eurozone Economic Sentiment Indicator Mar | 96.1 | 95.4 |
| 10:00 | EUR | Eurozone Industrial Confidence Mar | -9 | -9.5 |
| 10:00 | EUR | Eurozone Services Confidence Mar | 7.8 | 6 |
| 10:00 | EUR | Eurozone Consumer Confidence Mar F | -14.9 | -14.9 |
| 14:30 | USD | Crude Oil Inventories | -2.0M | |
| 23:50 | JPY | BoJ Summary of Opinions |
| GMT | Ccy | Events | |
|---|---|---|---|
| 00:00 | AUD | Westpac Leading Index M/M Feb | |
| Forecast: | Previous: -0.10% | ||
| 00:30 | AUD | Monthly CPI Y/Y Feb | |
| Forecast: 3.50% | Previous: 3.40% | ||
| 09:00 | CHF | Credit Suisse Economic Expectations Mar | |
| Forecast: | Previous: 10.2 | ||
| 10:00 | EUR | Eurozone Economic Sentiment Indicator Mar | |
| Forecast: 96.1 | Previous: 95.4 | ||
| 10:00 | EUR | Eurozone Industrial Confidence Mar | |
| Forecast: -9 | Previous: -9.5 | ||
| 10:00 | EUR | Eurozone Services Confidence Mar | |
| Forecast: 7.8 | Previous: 6 | ||
| 10:00 | EUR | Eurozone Consumer Confidence Mar F | |
| Forecast: -14.9 | Previous: -14.9 | ||
| 14:30 | USD | Crude Oil Inventories | |
| Forecast: | Previous: -2.0M | ||
| 23:50 | JPY | BoJ Summary of Opinions | |
| Forecast: | Previous: | ||
Thursday, Mar 28, 2024
| GMT | Ccy | Events | Consensus | Previous |
|---|---|---|---|---|
| 00:00 | NZD | ANZ Business Confidence Mar | 34.7 | |
| 00:00 | AUD | Consumer Inflation Expectations Mar | 4.50% | |
| 00:30 | AUD | Retail Sales M/M Feb | 0.40% | 1.10% |
| 00:30 | AUD | Private Sector Credit M/M Feb | 0.40% | 0.40% |
| 07:00 | EUR | Germany Retail Sales M/M Feb | 0.30% | -0.40% |
| 07:00 | GBP | GDP Q/Q Q4 F | -0.30% | -0.30% |
| 07:00 | GBP | Current Account (GBP) Q4 | -21.5B | -17.2B |
| 08:00 | CHF | KOF Economic Barometer Mar | 102.3 | 101.6 |
| 08:55 | EUR | Germany Unemployment Rate Mar | 5.90% | 5.90% |
| 08:55 | EUR | Germany Unemployment Change Mar | 10K | 11K |
| 09:00 | EUR | Eurozone M3 Money Supply Y/Y Feb | 0.30% | 0.10% |
| 12:30 | CAD | GDP M/M Jan | 0.40% | 0.00% |
| 12:30 | USD | Initial Jobless Claims (Mar 22) | 211K | 210K |
| 12:30 | USD | GDP Annualized Q4 F | 3.20% | 3.20% |
| 12:30 | USD | GDP Price Index Q4 F | 1.70% | 1.70% |
| 13:45 | USD | ChicagoPMI Mar | 46.4 | 44 |
| 14:00 | USD | Pending Home Sales M/M Feb | -2.00% | -4.90% |
| 14:00 | USD | Michigan Consumer Sentiment Mar F | 76.5 | 76.5 |
| 14:30 | USD | Natural Gas Storage | 7B | |
| 23:30 | JPY | Tokyo CPI Y/Y Mar | 2.60% | |
| 23:30 | JPY | Tokyo CPI ex Fresh Food Y/Y Mar | 2.40% | 2.50% |
| 23:30 | JPY | Tokyo CPI ex Food Energy Y/Y Mar | 3.10% | |
| 23:30 | JPY | Unemployment Rate Feb | 2.40% | 2.40% |
| 23:50 | JPY | Industrial Production M/M Feb P | 1.40% | -6.70% |
| 23:50 | JPY | Retail Trade Y/Y Feb | 3.00% | 2.10% |
| GMT | Ccy | Events | |
|---|---|---|---|
| 00:00 | NZD | ANZ Business Confidence Mar | |
| Forecast: | Previous: 34.7 | ||
| 00:00 | AUD | Consumer Inflation Expectations Mar | |
| Forecast: | Previous: 4.50% | ||
| 00:30 | AUD | Retail Sales M/M Feb | |
| Forecast: 0.40% | Previous: 1.10% | ||
| 00:30 | AUD | Private Sector Credit M/M Feb | |
| Forecast: 0.40% | Previous: 0.40% | ||
| 07:00 | EUR | Germany Retail Sales M/M Feb | |
| Forecast: 0.30% | Previous: -0.40% | ||
| 07:00 | GBP | GDP Q/Q Q4 F | |
| Forecast: -0.30% | Previous: -0.30% | ||
| 07:00 | GBP | Current Account (GBP) Q4 | |
| Forecast: -21.5B | Previous: -17.2B | ||
| 08:00 | CHF | KOF Economic Barometer Mar | |
| Forecast: 102.3 | Previous: 101.6 | ||
| 08:55 | EUR | Germany Unemployment Rate Mar | |
| Forecast: 5.90% | Previous: 5.90% | ||
| 08:55 | EUR | Germany Unemployment Change Mar | |
| Forecast: 10K | Previous: 11K | ||
| 09:00 | EUR | Eurozone M3 Money Supply Y/Y Feb | |
| Forecast: 0.30% | Previous: 0.10% | ||
| 12:30 | CAD | GDP M/M Jan | |
| Forecast: 0.40% | Previous: 0.00% | ||
| 12:30 | USD | Initial Jobless Claims (Mar 22) | |
| Forecast: 211K | Previous: 210K | ||
| 12:30 | USD | GDP Annualized Q4 F | |
| Forecast: 3.20% | Previous: 3.20% | ||
| 12:30 | USD | GDP Price Index Q4 F | |
| Forecast: 1.70% | Previous: 1.70% | ||
| 13:45 | USD | ChicagoPMI Mar | |
| Forecast: 46.4 | Previous: 44 | ||
| 14:00 | USD | Pending Home Sales M/M Feb | |
| Forecast: -2.00% | Previous: -4.90% | ||
| 14:00 | USD | Michigan Consumer Sentiment Mar F | |
| Forecast: 76.5 | Previous: 76.5 | ||
| 14:30 | USD | Natural Gas Storage | |
| Forecast: | Previous: 7B | ||
| 23:30 | JPY | Tokyo CPI Y/Y Mar | |
| Forecast: | Previous: 2.60% | ||
| 23:30 | JPY | Tokyo CPI ex Fresh Food Y/Y Mar | |
| Forecast: 2.40% | Previous: 2.50% | ||
| 23:30 | JPY | Tokyo CPI ex Food Energy Y/Y Mar | |
| Forecast: | Previous: 3.10% | ||
| 23:30 | JPY | Unemployment Rate Feb | |
| Forecast: 2.40% | Previous: 2.40% | ||
| 23:50 | JPY | Industrial Production M/M Feb P | |
| Forecast: 1.40% | Previous: -6.70% | ||
| 23:50 | JPY | Retail Trade Y/Y Feb | |
| Forecast: 3.00% | Previous: 2.10% | ||
Friday, Mar 29, 2024
| GMT | Ccy | Events | Consensus | Previous |
|---|---|---|---|---|
| 05:00 | JPY | Housing Starts Y/Y Feb | -5.50% | -7.50% |
| 07:45 | EUR | France Consumer Spending M/M Feb | 0.20% | -0.30% |
| 12:30 | USD | Personal Income M/M Feb | 0.40% | 1.00% |
| 12:30 | USD | Personal Spending Feb | 0.40% | 0.20% |
| 12:30 | USD | PCE Price Index M/M Feb | 0.40% | 0.30% |
| 12:30 | USD | PCE Price Index Y/Y Feb | 2.50% | 2.40% |
| 12:30 | USD | Core PCE Price Index M/M Feb | 0.30% | 0.40% |
| 12:30 | USD | Core PCE Price Index Y/Y Feb | 2.80% | 2.80% |
| 12:30 | USD | Wholesale Inventories Feb P | 0.20% | -0.30% |
| 12:30 | USD | Goods Trade Balance (USD) Feb P | -89.6B | -90.5B |
| GMT | Ccy | Events | |
|---|---|---|---|
| 05:00 | JPY | Housing Starts Y/Y Feb | |
| Forecast: -5.50% | Previous: -7.50% | ||
| 07:45 | EUR | France Consumer Spending M/M Feb | |
| Forecast: 0.20% | Previous: -0.30% | ||
| 12:30 | USD | Personal Income M/M Feb | |
| Forecast: 0.40% | Previous: 1.00% | ||
| 12:30 | USD | Personal Spending Feb | |
| Forecast: 0.40% | Previous: 0.20% | ||
| 12:30 | USD | PCE Price Index M/M Feb | |
| Forecast: 0.40% | Previous: 0.30% | ||
| 12:30 | USD | PCE Price Index Y/Y Feb | |
| Forecast: 2.50% | Previous: 2.40% | ||
| 12:30 | USD | Core PCE Price Index M/M Feb | |
| Forecast: 0.30% | Previous: 0.40% | ||
| 12:30 | USD | Core PCE Price Index Y/Y Feb | |
| Forecast: 2.80% | Previous: 2.80% | ||
| 12:30 | USD | Wholesale Inventories Feb P | |
| Forecast: 0.20% | Previous: -0.30% | ||
| 12:30 | USD | Goods Trade Balance (USD) Feb P | |
| Forecast: -89.6B | Previous: -90.5B | ||
The Weekly Bottom Line: Counting Cuts
U.S. Highlights
- Markets let out a sigh of relief as the Fed’s Summary of Economic Projections reaffirmed expectations for three rate cuts this year.
- The Fed’s forecast for the economy is interesting, as it implies above trend growth in each of the next three years – despite interest rates that remain in restrictive territory.
- Forecasts for healthy growth and some renewal in the housing market set the stage for next week’s personal income and expenditures report.
Canadian Highlights
- Canadian inflation showed significant improvement in February, with heavy discounting apparent across the consumer basket.
- The Bank of Canada’s (BoC’s) core inflation measures also decelerated, following other underlying inflation gauges lower.
- The BoC was encouraged by the improvement, but likely wants to see a continuation of recent trends before it decides to cut rates.
U.S. – Counting Cuts
Markets let out a sigh of relief as the Fed’s Summary of Economic Projections reaffirmed expectations for three rate cuts this year – rather than sending a more hawkish message by pulling back to two. In response, longer-term yields have extended their declines, with the 10-year Treasury down about 10 basis points (at the time of writing) since last Friday. Equities rallied on the news of easier policy, up just short of 1% after the projections were released.
While avoiding sending an overtly hawkish signal, officials did upgrade both the economic outlook and expectations for the level of interest rates in 2025 and 2026. The forecast for the economy is interesting, as it implies above-trend growth in each of the next three years – despite interest rates that are in restrictive territory. Conversely, our forecast has the economy slowing in the latter half of 2024 as the cumulative effect of high rates and the drawdown of consumer savings begin to dent both job creation and spending (Chart 1).
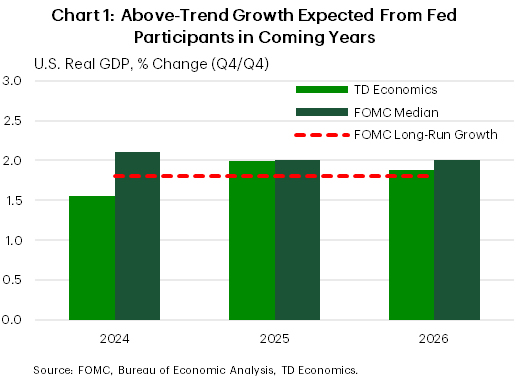
Admittedly, the risks remain skewed to the upside for the economy, inflation and interest rates. The U.S. consumer has thus far shrugged off all expectations for a slowdown. Real expenditures grew at roughly three percent through the back half of 2023, and the labor market expanded by an average of 265k jobs (SAAR) in the three months through February. All of this has the first quarter of 2024 looking like it’s going to be another healthy period of expansion.
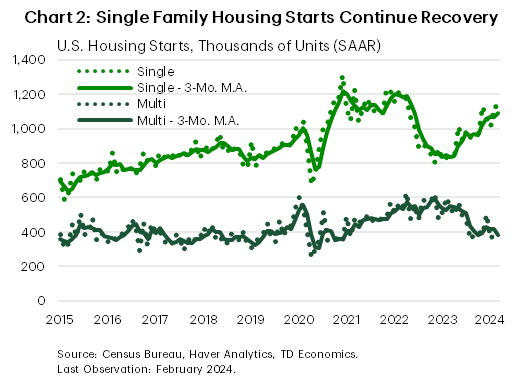
Even the housing sector, which has felt the brunt of a stagging rise in borrowing costs, has shown signs of life lately. Existing home sales and housing starts both left expectations in the rearview mirror. Moreover, the starts data reflect some rebalancing in the marketplace as single-family starts continue to grind higher adding units to a market starved for supply, while the multifamily segment slows down (Chart 2). Looking forward, increasing permitting activity suggests that there is some more room for improvement in housing construction.
Forecasts for healthy growth and some revival in the housing market set the stage for next week’s personal income and expenditures report. Markets will be on the lookout for signs that economic momentum carried through to February. Recall, January saw real spending contract, as weather weighed on economic activity, so a bounce-back is expected in February, with an accompanying uptick in headline inflation.
For policymakers, the focus will be on the core personal consumption expenditures (PCE) price deflator. Last month core prices gained 0.4% on the month. Expectations are for a 0.3% monthly advance in February. Remember, monthly price growth of below 0.2% is what is consistent with the 2.0% inflation target, so an upside surprise to prices would suggest a still significant amount of excess demand in the economy – an outcome we should all be used to by now.
Canada – CPIX Marks the Spot
Central bankers took the stage this week, but it was Canadian economic data that stole the show. A significant improvement in inflation for February and a weak reading on retail sales increased expectations for an earlier cut by the Bank of Canada (BoC). Adding to this was the release of the BoC’s March deliberations that confirmed the Bank is preparing to cut rates later this year. While the exact timing of the first rate cut is still uncertain, market pricing has rallied around June/July, matching expectations on timing for other major central banks.
The inflation reading this week showed a meaningful deceleration, with the headline measure remaining within the BoC 1% to 3% target band. But the big surprise was the heavy discounting on items like clothing, cell phone /internet plans, and food. For the latter, that was the first contraction in three years (seasonally adjusted)! As Deputy Governor Toni Gravelle said at a speech later in the week, this was “very encouraging”.
What was even more promising was the progress on the BoC’s preferred inflation metrics. While these have remained stubbornly high over the last few months, they too have started to ease and now sit just above the 3% band. These metrics are starting to follow other measures of inflation lower, including the Bank’s old preferred inflation measure, CPIX (Chart 1). This index excludes the eight most volatile inflation items such as mortgage interest costs. Importantly, this measure has now reached the BoC’s 2% target.
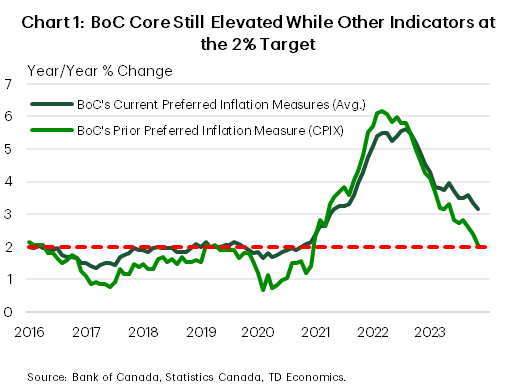
We have been arguing that the BoC should look outside of its preferred indicators of inflation, which are being influenced by structural issues related to shelter inflation. This is something the BoC has started to acknowledge. In recent communications, it has started to list a broad suite of inflation indicators that it will use to determine the state of underlying inflation. CPIX, as mentioned above, is one of them. But another measure that the Bank has started to rely on is the distribution of inflation. Here the BoC has stated that the percent of CPI items growing at 3% or more remains too high (Chart 2). It’s true that the distribution remains above 40%, which is more than the historical average of 35%. But we’d argue that it is getting close to more normal levels. The downward momentum in this index is apparent, and unless there is another supply-side shock to inflation, this measure will keep moving lower, bringing the slow moving BoC measures along with it.
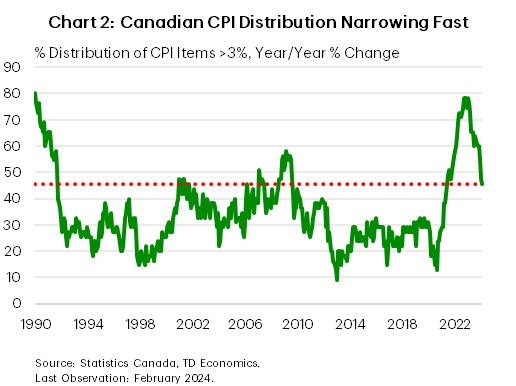
This is why market pricing has become more entrenched around an earlier start to rate cuts. And even though the Deputy Governor showed more optimism than we have seen from other BoC speakers, expect the Bank to keep its cards a little closer to its chest over the coming month. The BoC doesn’t want the market to get any further ahead of itself, as it can’t afford to stoke a spring housing market boom. Rather, the BoC is likely to wait until the spring rush has started to abate before it communicates that it is ready for rate cuts.