

Sample Category Title
Aussie Slides After RBA’s Pause
The Australian dollar is sharply lower on Tuesday. In the European session, AUD/USD is trading at 0.6507, down 0.80%. The Aussie is on a nasty slide and has declined by 1.7% since March 13.
RBA removes tightening bias
The Reserve Bank of Australia maintained the cash rate at 4.35% for a fourth straight time at today’s meeting. A pause was widely expected, which left the focus on the rate statement and Governor Bullock’s follow-up press conference.
The RBA statement noted that the “Board is not ruling anything in or out”, which was a change from the February statement which said “a further increase in interest rates cannot be ruled out”. The markets jumped on this slight variance, taking it as a signal that the RBA had removed its hiking bias. The Australian dollar has responded with sharp losses in the aftermath of the meeting.
The statement said that “encouraging signs that inflation is moderating”, but the RBA remains concerned that inflation still remains high and is worried about the uncertain economic outlook, both domestically and abroad. Household consumption remains weak and growth has slowed, and China’s economy remains a major concern.
The bottom line? Inflation is still too high and the RBA won’t be rushed into lowering rates until it sees a further drop in inflation. At her press conference, Governor Bullock tried to downplay the change in language in the statement, but the markets viewed this as a significant step towards trimming rates later this year.
In the US, it’s an unusually quiet week, with no tier-1 events on the data calendar. Investors will be focused on the Federal Reserve’s rate announcement on Wednesday. The Fed is virtually certain to maintain the benchmark rate of 5%-5.25%, and will be combing the rate statement for any insights about a date for an initial rate cut.
AUD/USD Technical
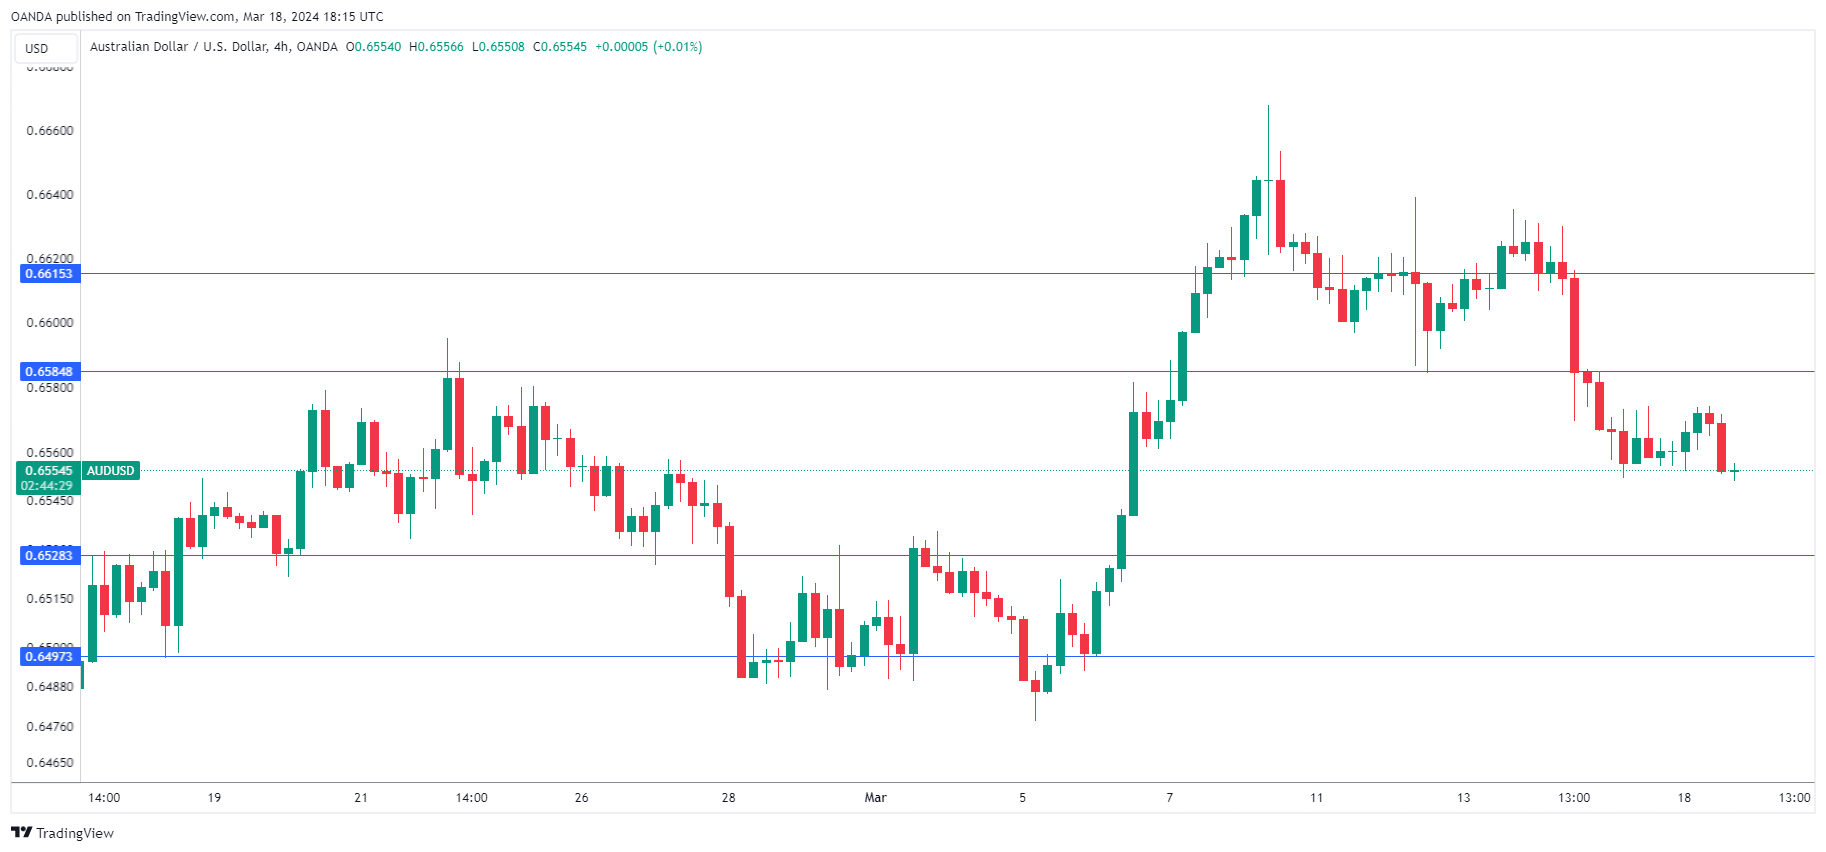
- AUD/USD has pushed below support at 0.6528 and is putting pressure on support at 0.6497
- There is resistance at 0.6584 and 0.6615
Will GBPJPY Enter Territories Last Seen in 2015?
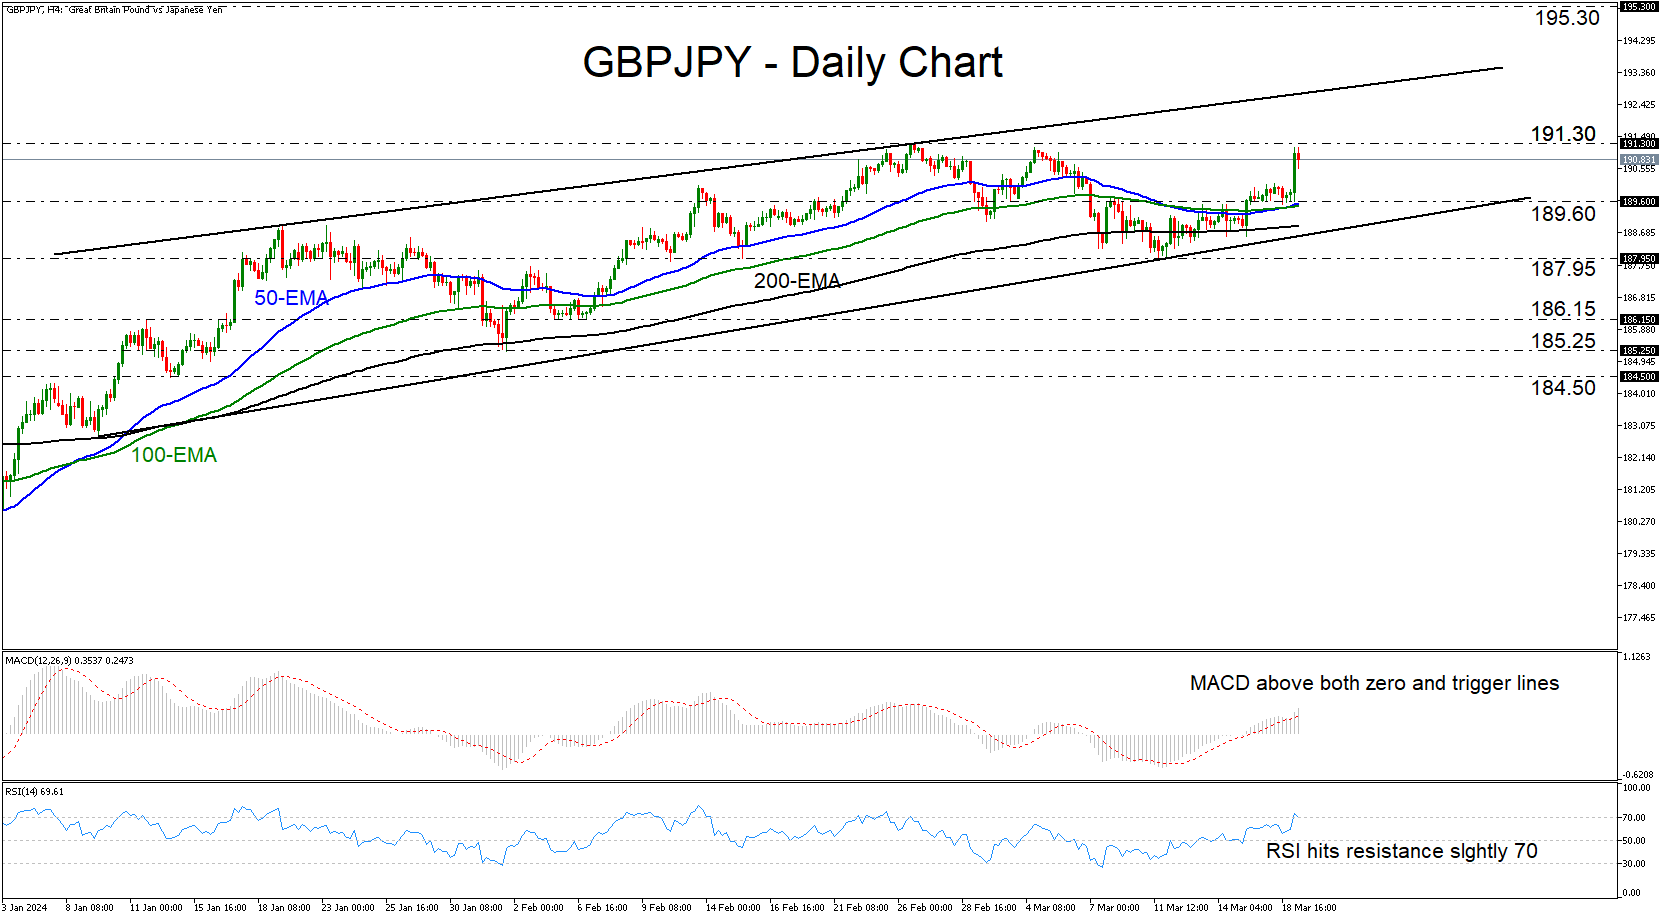
- GBPJPY trades higher and hits resistance near 191.30
- Remains in uptrend despite BoJ decision
- MACD and RSI detect positive momentum
- For the outlook to change, a dip below 187.95 may be needed
GBPJPY traded higher yesterday, but hit resistance near the 191.30 barrier today, marked by the high of February 26, and pulled back somewhat. Even after the BoJ took interest rates out of negative territory and abandoned yield curve control, the pair remains in an uptrend as denoted by the upward sloping trendline drawn from the low of January 9.
The short-term oscillators detect positive momentum corroborating the bullish outlook. The MACD is running above both its zero and trigger lines, while the RSI is lying within its above-70 zone, although it ticked down today. This means that some further retreat may be on the cards before the next leg north.
The bulls could take charge again from near the 189.60 zone, which coincides with the 50- and 100-period exponential moving averages (EMAs), and they may drive the action above 191.30, entering territories last tested in August 2015. The next resistance obstacle may be the upward sloping resistance line drawn from the high of January 19, but if traders are willing to overcome that line as well, they could take the pair all the way up to the 195.30 area, which acted as a ceiling during the whole summer of 2015.
For the near-term picture to shift to bearish, a decisive dip below 187.95 may be needed. Such a move will take GBPJPY below all the plotted moving averages and below the uptrend line taken from the low of January 9. The bears may then get encouraged to dive towards the 186.15 zone that offered support between February 5 and 7.
To sum up, GBPJPY remains in an uptrend despite the BoJ hiking interest rates and abandoning yield curve control. A break above 191.30 will confirm a higher high and take the pair into territories last tested in 2015.
GBPUSD Retreats Towards 50-day SMA
- GBPUSD generates fresh 2024 peak
- But declines sharply towards the 50-day SMA
- Momentum indicators weaken significantly
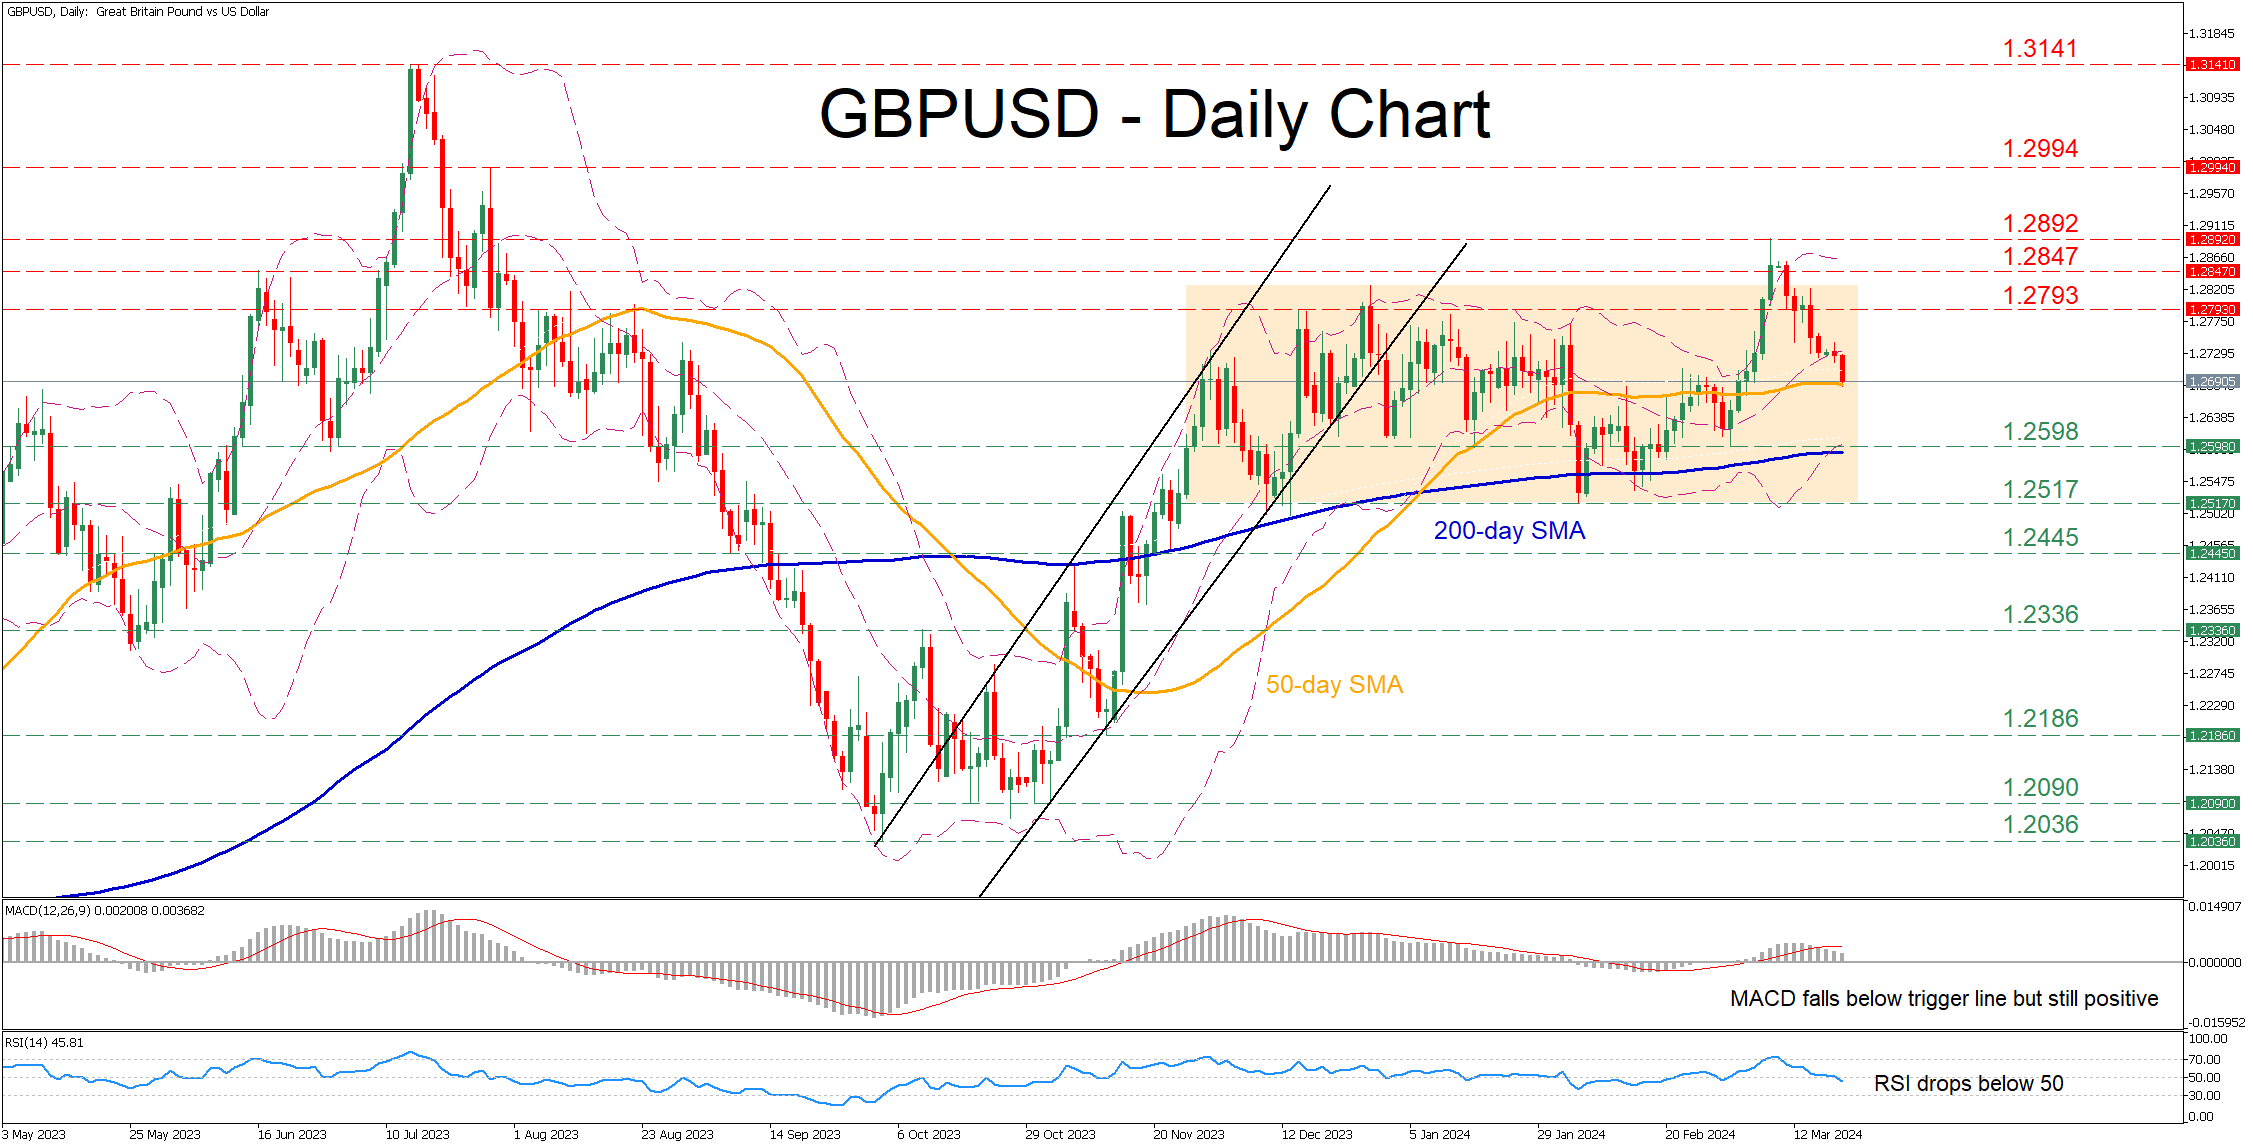
GBPUSD has been stuck in a rangebound pattern since mid-November, unable to adopt a clear directional impetus. Although the pair exploded higher and posted a fresh seven-month high after conquering the 50-day simple moving average (SMA), it quickly reversed back within its neutral structure.
Should bearish pressures persist, the pair could violate the 50-day SMA and challenge the March support of 1.2598, which lies very close to the 200-day SMA. A dive below that region could open the door for the 2024 low of 1.2517. Further declines could then cease at 1.2445, a region that provided both support and resistance throughout 2023.
On the flipside if the pair reverses back higher, the December resistance of 1.2793 could prove to be the first barricade for the price to overcome. Surpassing that zone, the price may test the June 2023 peak of 1.2847. Even higher, the recent seven-month peak of 1.2892 could come under scrutiny.
In brief, GBPUSD remains a prisoner within its sideways range as its latest upward spike encountered solid resistance. Therefore, the technical picture could deteriorate further in case of a downside violation of the 50-day SMA.
Bank of Japan Ends the Era of Negative Interest Rates
The Bank of Japan has not raised interest rates for 17 years. For 8 years, it was in the negative zone.
But today there was a dramatic shift in monetary policy — the Bank of Japan announced a decision to increase the interest rate from -0.1% to 0.1%.
The central bank also abandoned yield curve control (YCC), a policy that had been in place since 2016 and capped long-term interest rates near zero.
Considering the scale of the decisions taken, the reaction of the yen exchange rate relative to other currencies turned out to be moderate. This is because the plans of the Bank of Japan have been discussed for a long time, including in official sources of information. Therefore, it is acceptable to assume that participants in the currency markets have already laid down the probability of today's event.
In fact, the yen has weakened as a result, but this may only be an initial reaction in which markets are reassessing the impact of the Bank of Japan's decision over a range of short-term to long-term horizons.
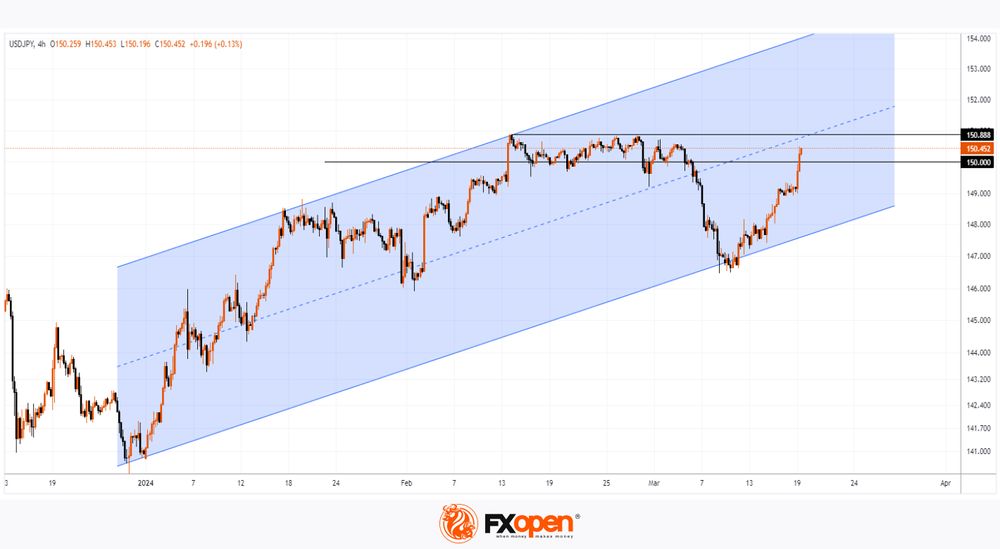
The USD/JPY chart today shows that:
→ the yen exceeded the psychological level of 150 yen per US dollar;
→ the rate continues to develop in an ascending channel (marked in blue). At the same time, its median line was tested, which can serve as resistance from the point of view of technical analysis of USD/JPY.
Let us mark on the chart the top of the year around the level of 150.888.
It is possible that the emerging prospect of a tighter monetary policy, as well as the indicated resistance lines, will lead to the bears becoming more active and trying to lower the USD/JPY price to the lower border of the indicated channel. An important driver will also be news from the FOMC (scheduled for tomorrow, 21:00-21:30, GMT+3).
Trade over 50 forex markets 24 hours a day with FXOpen. Take advantage of low commissions, deep liquidity, and spreads from 0.0 pips. Open your FXOpen account now or learn more about trading forex with FXOpen.
This article represents the opinion of the Companies operating under the FXOpen brand only. It is not to be construed as an offer, solicitation, or recommendation with respect to products and services provided by the Companies operating under the FXOpen brand, nor is it to be considered financial advice.
Crypto Market Deepens Correction
Market picture
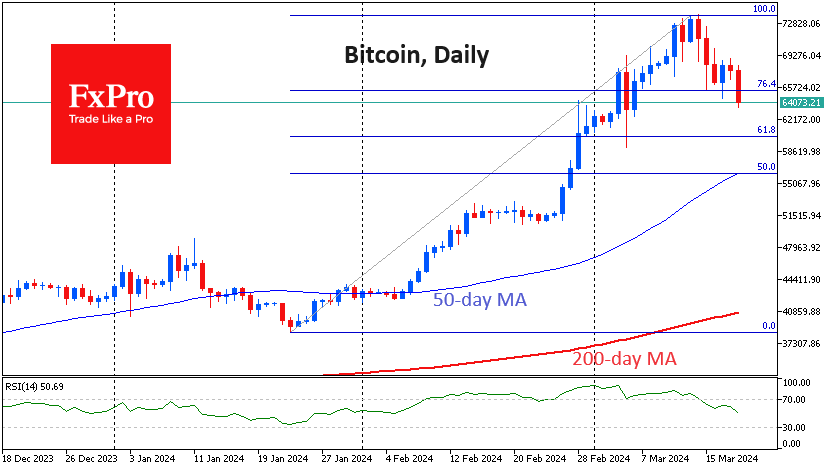
The crypto market lost 6% in 24 hours to $2.42 trillion. Solana reversed Tuesday’s decline, losing 9% in 24 hours – the last of the major altcoins to fall into a correction.
Bitcoin is down 5% after falling to $64.4K. That’s its lowest level in two weeks and 13.5% below its high. A close below $65.5K would signal a move to a deeper level – the classic 61.8% retracement of the rally with a potential target near $60K.
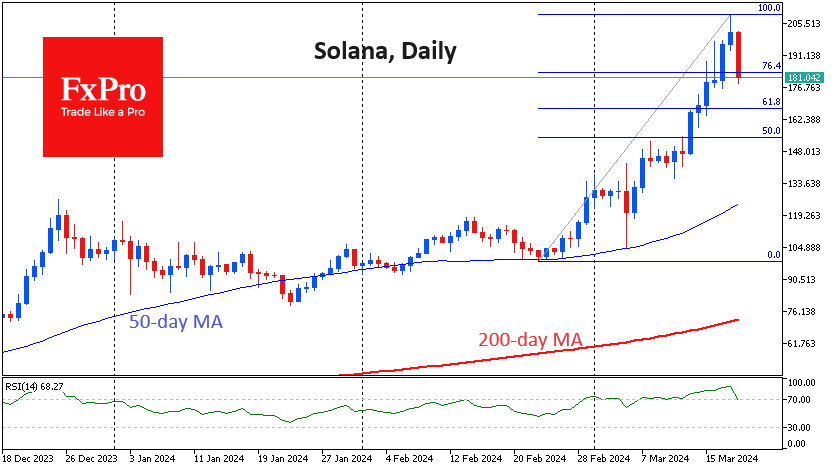
Solana had been above $210, reaching highs not seen since late 2021 before following the general corrective mood of the markets. A classic retracement pattern suggests a downside potential of $168. However, if this level is approached, one needs to look at bitcoin sentiment and global risk appetite to understand whether this support will be strong enough.
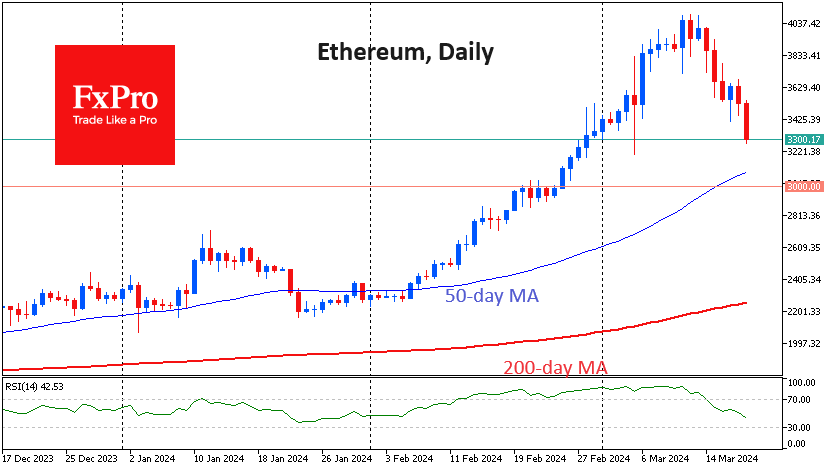
Ethereum is under selling pressure and has already pulled back to $3300, erasing all gains since early March. Having fallen below the 61.8% retracement of the rise from the January lows, ETHUSD can only hope for support in the form of the 50-day average ($3080) and $3000 (previous consolidation, plus the round level).
News background
According to CoinShares, crypto fund investments rose by a record $2.916B last week, surpassing the previous record set the week before ($2.685B) and continuing significant inflows for the seventh consecutive week. Bitcoin investments increased by $2.896B; Ethereum decreased by $14M, and Solana decreased by $2.7M. Investments in funds that allow shorting Bitcoin increased by $26M.
Bitcoin is in a bullish phase of a cycle like December 2020-January 2021. The current correction is “healthy” and removes some of the leverage in the system, said Crypto.com CEO Chris Marszalek.
Rekt Capital warned of a “danger zone” ahead of the upcoming halving in April. Historically, bitcoin has fallen weeks before the event. The depth of the correction was 20% in 2020 and 40% in 2016.
According to new data from Bitcointreasuries, 93.6% of total bitcoins (19,656,760 BTC) have already been mined as of mid-March 2024. Miners have only 1.34 million BTC left to mine, significantly limiting the future supply of the asset.
Ethereum issuance fell to its lowest level since August 2022 following the activation of the crucial Dencun update on 13 March, CryptoQuant noted. According to The Block, the ETH network has reached annual highs in the number of active and new addresses, daily transactions, and transaction volume.
The buzz around meme coins has boosted the token rate of the networks on which they are issued. The Solana (SOL) and Avalanche (AVAX) cryptocurrencies updated local highs. In pre-selling, users send network tokens to a wallet address in exchange for a corresponding number of coins when the meme token is launched. Solana has once again become the trendiest crypto asset among traders, with new Meme tokens appearing almost every minute, according to ContentFi Labs.
Brent Oil Prices Continue to Surge, Reaching New Peaks
Brent crude oil continues its rally, reaching peak values since early November 2023, with prices around USD 87.00 per barrel. Investor concerns over commodity supply, particularly due to tensions in several oil-producing countries, significantly influence quotes by incorporating potential supply disruptions.
Iraq has announced a reduction in crude oil exports to 3.300 million barrels per day soon to compensate for OPEC+ quota implementations. This reduction marks the second consecutive month of export decreases, including in Saudi Arabia, where exports dropped to 6.297 million barrels per day from the previous 6.308 million.
Despite these cuts, global demand for energy remains high. Recent statistics from China have shown a confident retail sales and industrial production sector and a stable outlook for oil demand this year.
It is important to note that a five-session rally of the US dollar could act as a headwind for the oil market. The American currency is at a two-week high against its major counterparts, making commodity purchases more expensive for investors holding other currencies.
Market projections concerning demand for aviation fuel during the summer season are not very confident at this time. There is a risk this could affect the global upward trend in oil. Due to increased summer travel activity, world prices for aviation fuel in Q3 2024 are expected to be 5-6% higher than previous forecasts, reaching around USD 111.00 per barrel. However, the number of flights remains low due to the global economic situation, which could pressure the market and the cost of aviation fuel.
Brent Technical Analysis
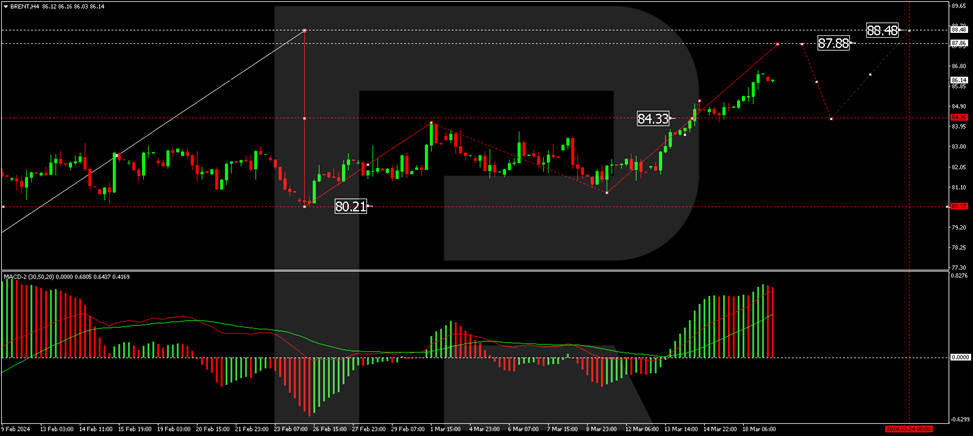
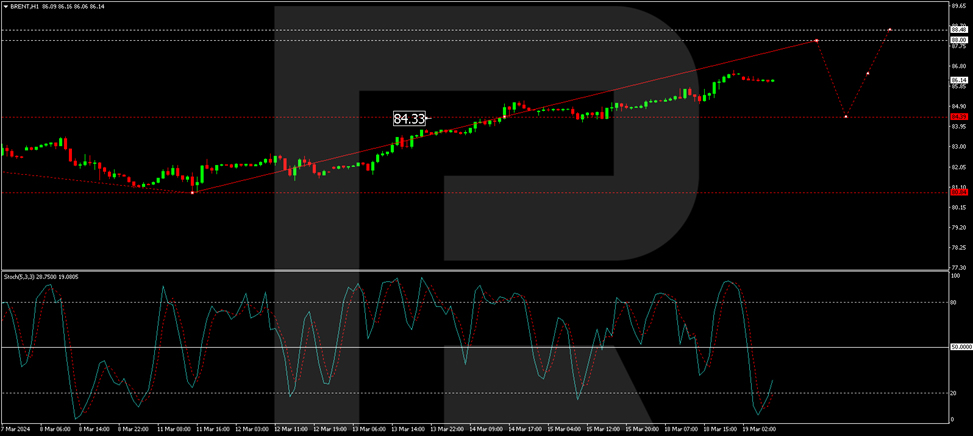
The H4 Brent chart has formed a consolidation range around 84.33, with the market breaking upward to 86.60. A decrease to 85.70 could occur today, followed by a new growth structure towards 87.87, a local target. A correction back to 84.33 might follow, then an increase to 88.48 as the first target. The MACD indicator supports this scenario, with its signal line above zero and poised to reach new highs.
On the H1 Brent chart, a growth wave structure towards 88.00 is forming. This is a local target, following which a correction to 84.40 (testing from above) is considered, with expectations for the continuation of the growth wave to 88.50. This scenario is technically supported by the Stochastic oscillator, whose signal line is below 20, indicating the start of a rise towards 50 with the potential to continue to 80.
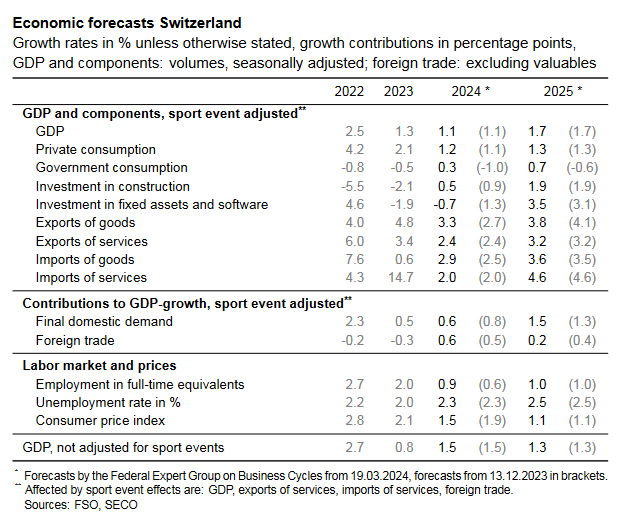
Swiss SECO lowers 2024 inflation forecasts sharply to 1.5%, keeps growth at 1.1%
The Swiss Federal Expert Group on Business Cycles maintained its expectation for modest GDP growth at 1.1% for 2024, with improvement to 1.7% in 2025. Uunemployment rate is projected to remain stable at 2.3% in 2024 before rising to 2.5% in 2025. Notably, inflation forecast for 2024 has been revised sharply down to 1.5% from an earlier estimate of 1.9%, and is expected to slow to 1.1% in 2025.
The group also outlined risks to the Swiss economy, including geopolitical tensions in the Middle East and Ukraine, which could disrupt commodity markets. Prolonged period of restrictive international monetary policy may dampen global demand, impacting Switzerland's recovery. Specific concerns were raised about Germany's industrial slowdown and China's economic cooling, which could affect Swiss foreign trade.
Conversely, there's a possibility that the recovery could outpace expectations, especially if global inflation decreases faster than anticipated, boosting consumer purchasing power and leading to quicker monetary policy easing. This scenario would likely stimulate demand further.
RIP NIRP. BoJ Ditches the World’s Last Negative Policy Rate
Markets
RIP NIRP. The Bank of Japan ditched the world’s last negative policy rate this morning, raising it from -0.1% to a target range between 0% and 0.1%. The first hike since 2007 ended an 8-year experiment of sub-zero rates. It also scrapped the (soft) 1% cap on the 10-year yield and formally ended ETF and J-REIT purchases. The decisions followed last week’s Rengo wage negotiation outcome which offered the BoJ the final piece of the puzzle. The 5.28% pay raise was the biggest since 1991 and will establish a virtuous wage price spiral that brings inflation sustainably at 2% after decades of deflation. All of it sounds like a seismic monetary policy shock but it comes with a few nuances. The BoJ stresses that the still-accommodative policy stance won’t go anywhere anytime soon.
Indeed, the lack of guidance means today’s hike probably won’t be followed by rapid follow-through action. Policymakers including governor Ueda hinted at that long before this morning. It wasn’t a unanimous decision either (7-2). Second: the 1% soft cap on the 10-year yield was removed but the BoJ will still buy JGB’s with roughly the same amount as before (JPY 6tn per month) with the maturities higher than 5 and up to 10 years the focal point. In addition, the central bank said it can step in with “nimble responses” in case of a rapid rise in long-term yields. Lastly, the formal end to riskier ETF and J-REIT purchases is merely symbolical as the BoJ barely bought anything already since 2023. Japanese markets were clearly hoping for more. The yen nears the recent lows against the dollar (USD/JPY back above 150) and the euro (EUR/JPY 163.4). Japanese bond yields ease between 0.7 (2-y) and 2.7 bps (10-y).
The Reserve Bank of Australia also met this morning (see below). A dovish tweak suppresses the Aussie dollar compared to peers as well. The likes of the dollar and the euro generally trade strong with the former having a slight edge over the latter. EUR/USD lost some ground yesterday. The downleg coincided with a sharp uptick in oil prices to the highest level since November around $87/b amid supply cuts/worries and ebbing concerns about global as well as Chinese demand. The pair continues down the same path this morning, confirming a break below the 1.0875 support zone (38.2% retracement on 2023 Q4 rally). DXY is readying an assault of the 104 big figure. Core bonds hold Monday’s losses that pushed yields no more than 2 bps higher.
The BoJ and RBA were today’s key events. The economic calendar for the remainder of the day won’t inspire markets (ex. Japan) into any directional movement. That’s even more so given looming event risk, including coming from tomorrow’s Fed meeting. If anything, we expect a solid bottom below core bond yields and see a slight advance of the USD compared to peers.
News & Views
The Reserve Bank of Australia kept its policy rate unchanged at 4.35% this morning, but dropped forward guidance that a further increase in interest rates cannot be ruled out. They changed it by indicating that the path of interest rates that will best ensure that inflation returns to target in a reasonable timeframe remains uncertain and that the Board doesn’t rule anything in or out. There are encouraging signs that inflation is moderating, but the economic outlook remains uncertain. The central forecasts are for inflation to return to the target range of 2%–3% in 2025, and to the midpoint in 2026. Household consumption growth remains particularly weak but real incomes are expected to rise and support consumption later in the year. Conditions in the labour market continue to ease gradually, although they remain tighter than is consistent with sustained full employment and inflation at target. AUD swap rates drop 5 to 8 bps this morning with the front end of the curve outperforming. The Aussie dollar slips from AUD/USD 0.6560 to 0.6520. First real support stands around 0.6450.
Bulgarian FM Vassilev says that he didn’t give up on January 1st to adopt the euro, but warned that the start-of-the-year target is very close. He said that a March or July date would also be possible. Eurogroup president Donohoe said it’s up to the government to request a further economic evaluation. Meeting the inflation test will be key. Apart from that, political turmoil is delaying efforts to carry out structural reforms.
Where Are the Yen Bulls?
We expected – at the start of this year – that March would bring a Fed rate cut. It brought a BoJ rate hike instead.
Yes, the Bank of Japan (BoJ) scrapped its negative rate policy, raised the rates from -0.10% to 0%, ditched its YCC policy and ended the purchases of ETF and Japanese real estate investment trusts. However, the bank said that it will continue to purchase sovereign bonds with ‘broadly the same amount’ and that the policy will remain accommodative for now. The latter caught traders attention more than the rest. While you would’ve clearly expected to see the Japanese 10-year yield and the yen to rally on the back of such hawkish shift, the USDJPY spiked above 150, the EURJPY rallied past 163 and the 10-year JGB yield is down by almost 3.5%.
The price action suggests a ‘one and done’ action from the BoJ. Governor Ueda hasn’t spoken just yet, but if he doesn’t say that the BoJ will continue to hike rates, the yen bulls will apparently not come back. Note that today’s decision was supposed to send the yen on a rising path. At this point, I don’t see what would make long the yen the best trade of the year.
Elsewhere, the Reserve Bank of Australia (RBA) maintained rates unchanged at today’s policy meeting, as expected, and the AUDUSD fell sharply below the 200-DMA. The dollar index, on the other hand, extended gains above the 50-DMA and jumped above the downtrending channel top of February and March. The hawkish Federal Reserve (Fed) expectations sent the US 2-year yield to 4.75% in the run up to this week’s Fed meeting. FOMC starts its two-day meeting today and announce their latest decision tomorrow. The Fed is not expected to change the rates at this week’s meeting, hence all eyes are on the dot plot with the expectation of fewer rate cuts this year than previously plotted. The Fed can’t start cutting rates when there is no reason to do so: inflation is showing signs of heating up, economic growth is above average, jobs market remains healthy and corporate earnings are robust. There is a chance that we see the median forecast fall to 2 cuts this year from 3 plotted in December. We will also be listening carefully to the Fed’s plans about its QT: whether they will slow the unwinding of the balance sheet or they won’t. I think they’d better not unwind QT to balance out the expansive fiscal stimulus into the November election. Otherwise, inflation will hardly fade away. From a market perspective, a hawkish Fed this week – which we expect to see - we will likely help the US dollar and the yields trend higher.
While the yields and the dollar were rising, the S&P500 was also rising, led by technology stocks. Nasdaq 100 closed Monday’s session 1% higher. Tesla gained more than 6% after it announced a price hike for its Model Y in the US and Europe, effective from this Friday. Apple gained and Google jumped on news that Apple considers integrating Google’s Gemini AI into the iPhone. The deal would give Gemini a monstrous reach. For Apple, on the other hand, feelings are mixed. Having AI on iPhones will be fun and should boost iPhone demand. But the fact that the company is looking to use a tool developed by Google is yet another confirmation that they’ve missed the AI train and that’s not necessarily good news for a technology giant that navigates today’s conditions of ‘AI or die’.
For once, the AI king Nvidia remained under a shadow yesterday, even after the company unveiled at its GTC conference its new and faster chip that would better handle training and running of AI models. But Nvidia fell 1.77% in the afterhours trading. If the brand-new Blackwell chip didn’t trigger a fresh rally, it’s because the arrival of a new and a more powerful chip was already priced in. But if Nvidia bulls didn’t take the opportunity to send the price higher, it’s maybe because the rally is coming to an exhaustion into the $1000 per share mark…
In energy, US crude rallied past the $82pb on Monday on news that Ukraine continued its attacks on Russian refineries. The barrel of US crude flirted with the $83pb and is trading at around $82.50pb at the time of writing. Geopolitical tensions and IEA’s forecast that supply will be in deficit this year amid the extension of OPEC supply cuts remain supportive of the bulls. A sustainable rise above $82pb should pave the way to $85pb. The major short-term risk is a hawkish shift from the Fed that could spoil global demand expectations and limit the topside.
USD/JPY: JPY Continued to Sell Off After BoJ Put Historic End to Negative Rate Regime
- No clear forward guidance and “shadow accommodative vibes” in BoJ’s latest monetary policy led to a continuation of the rally in USD/JPY (JPY sell-off).
- Cautious now for USD/JPY bulls as it is now resting at the 20/151.95 major resistance zone where both verbal and real FX intervention has occurred in the past.
- BoJ Governor Ueda’s press conference later is likely to be critical with near-term key support at 148.70 to watch on the USD/JPY.
Bank of Japan (BoJ) has not created a “shock” to the market participants as it ended its short-term negative interest rates today; it raised its overnight rate to 0% to 0.1% from -0.1% and scrapped other unorthodox quantitative easing measures such as the “Yield Curve Control” (YCC) programme on the 10-year Japanese Government Bond (JGB), and discontinued its purchases in equity index exchange-traded funds, and J-REITS in today’s BoJ’s monetary policy decision outcome.
These outcomes have been “well-telegraphed” by local Japanese press such as Nikkei Asia, Jiji, and Kyodo in the past week which in turn created a “sell the fact” on the JPY as BoJ’s latest monetary policy statement does not provide any details or clues on the next step of its monetary policy normalization plans in terms of short-term interest rate trajectory.
USD/JPY spiked up ex-post BoJ
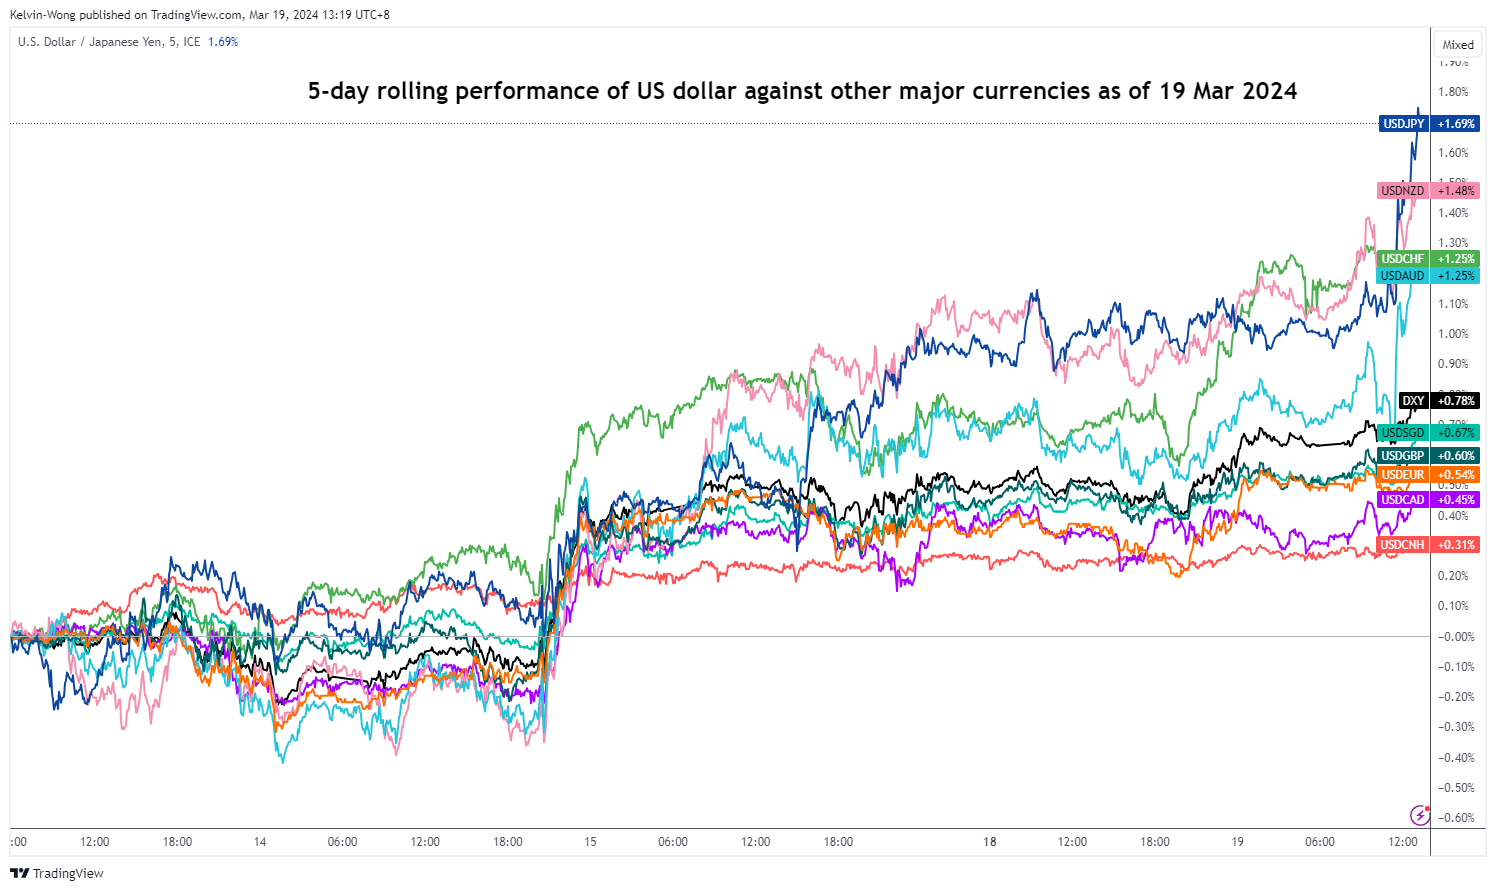
Fig 1: 5-day rolling performance of USD against other major currencies as of 18 Mar 2024 (Source: TradingView, click to enlarge chart)
The USD/JPY has continued its rally in place since 8 March after it recovered from a retest close to the key 200-day moving average that is acting as support at 146.20 (printed an intraday low of 146.48 on 8 March). In today’s Asian session ex-post BoJ, it added an intraday gain of +0.68% to print a current intraday high of 150.20 at this time of the writing and based on a 5-day rolling performance basis, the USD/JPY is the best-performing pair versus other major US dollar crosses with a gain of +1.7% (see Fig 1).
New BoJ’s monetary policy framework
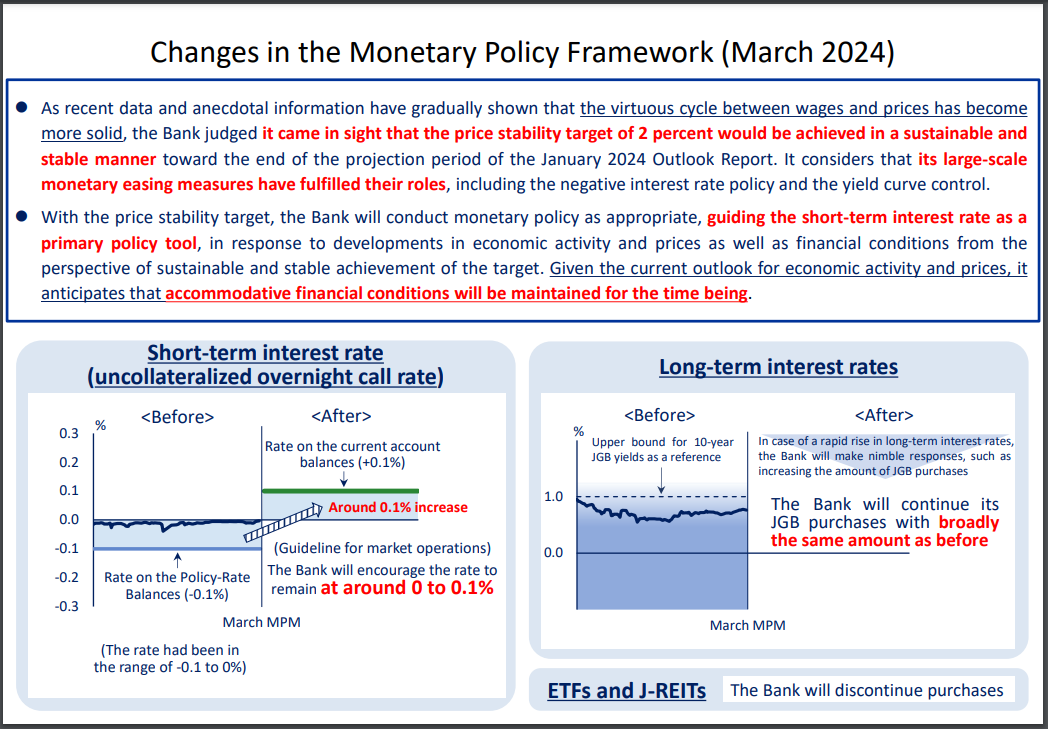
Fig 2: New monetary policy framework as of 19 Mar 2024 (Source: Bank of Japan website, click to enlarge)
The lack of more “forceful hawkish guidance” in its policy statement triggered this bout of sell-off in the JPY. Even though, it has removed its previous pledge of “not hesitate to take additional easing measures if necessary” but maintained its decades-long “accommodative vibes” by stating that it will continue its JGB purchases with broadly the same amount and may increase the amounts if there is a rapid rise in long-term interest rates (see Fig 2).
Hence, it seems to imply there is some form of “residual shadow” quantitative easing initiatives in BoJ’s monetary policy framework despite the official announcement of the removal of YCC that prevented JPY’s strength from emerging at this juncture.
USD/JPY spiked up towards 150.20/151.95 major resistance zone
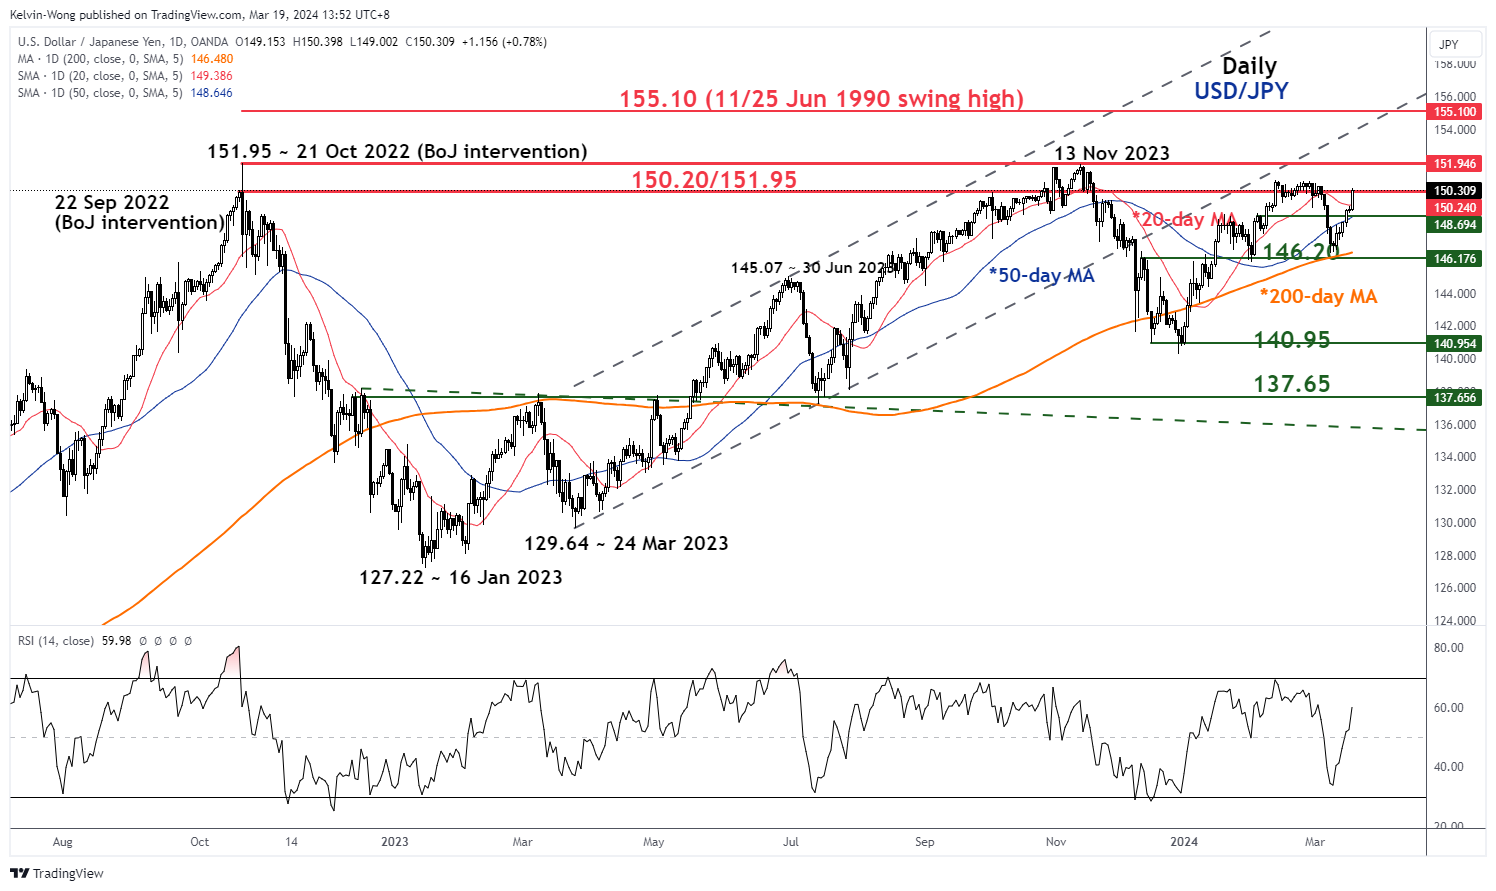
Fig 3: USD/JPY major & medium-term trends as of 19 Mar 2024 (Source: TradingView, click to enlarge chart)
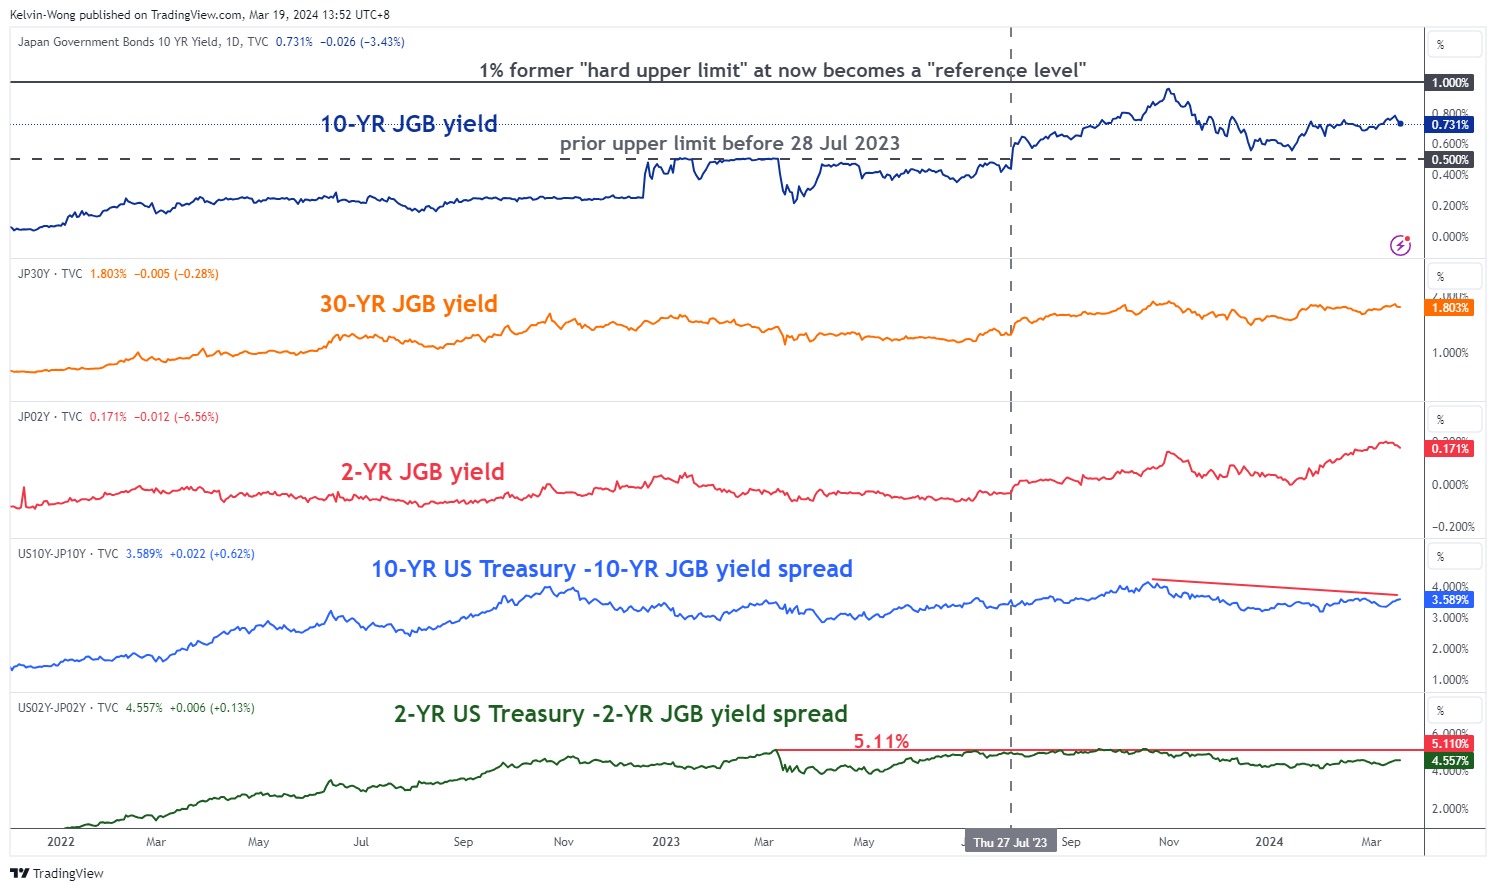
Fig 4: US Treasuries/JGB yield spreads medium-term trends as of 19 Mar 2024 (Source: TradingView, click to enlarge chart)
Market participants have viewed the latest BoJ’s monetary policy outcome as dovish for the JPY where the USD/JPY has rallied towards the 150.20/151.95 major resistance zone at this time of the writing.
A point to note is that this critical zone of 150.20/151.95 has led to a slew of verbal interventions by Ministry of Finance officials in the past 1 year to talk down the strength of the US dollar against the JPY as well as real intervention by BoJ to sell US dollars on 21 October 2022 (see Fig 3).
Given that both the long and short end of the yield spread between US Treasuries and JGBs are still hovering below their key resistance levels; 3.8% (10-year) and 5.11% (2-year), coupled with the USD/JPY that is now hovering at the 150.20/151.95 major resistance zone (see Fig 4), BoJ Governor Ueda press conference will be pivotal later as he will be likely quizzed to offer more concrete guidance of what it means by “nimble responses in the light” of rising long-term interest rates in Japan as well as any hints of further interest rate hikes in 2024.
Watch the key near-term support at 148.70 (also the 50-day moving average) on the USD/JPY.