Sample Category Title
AUD/USD Eyes RBA Rate Decision
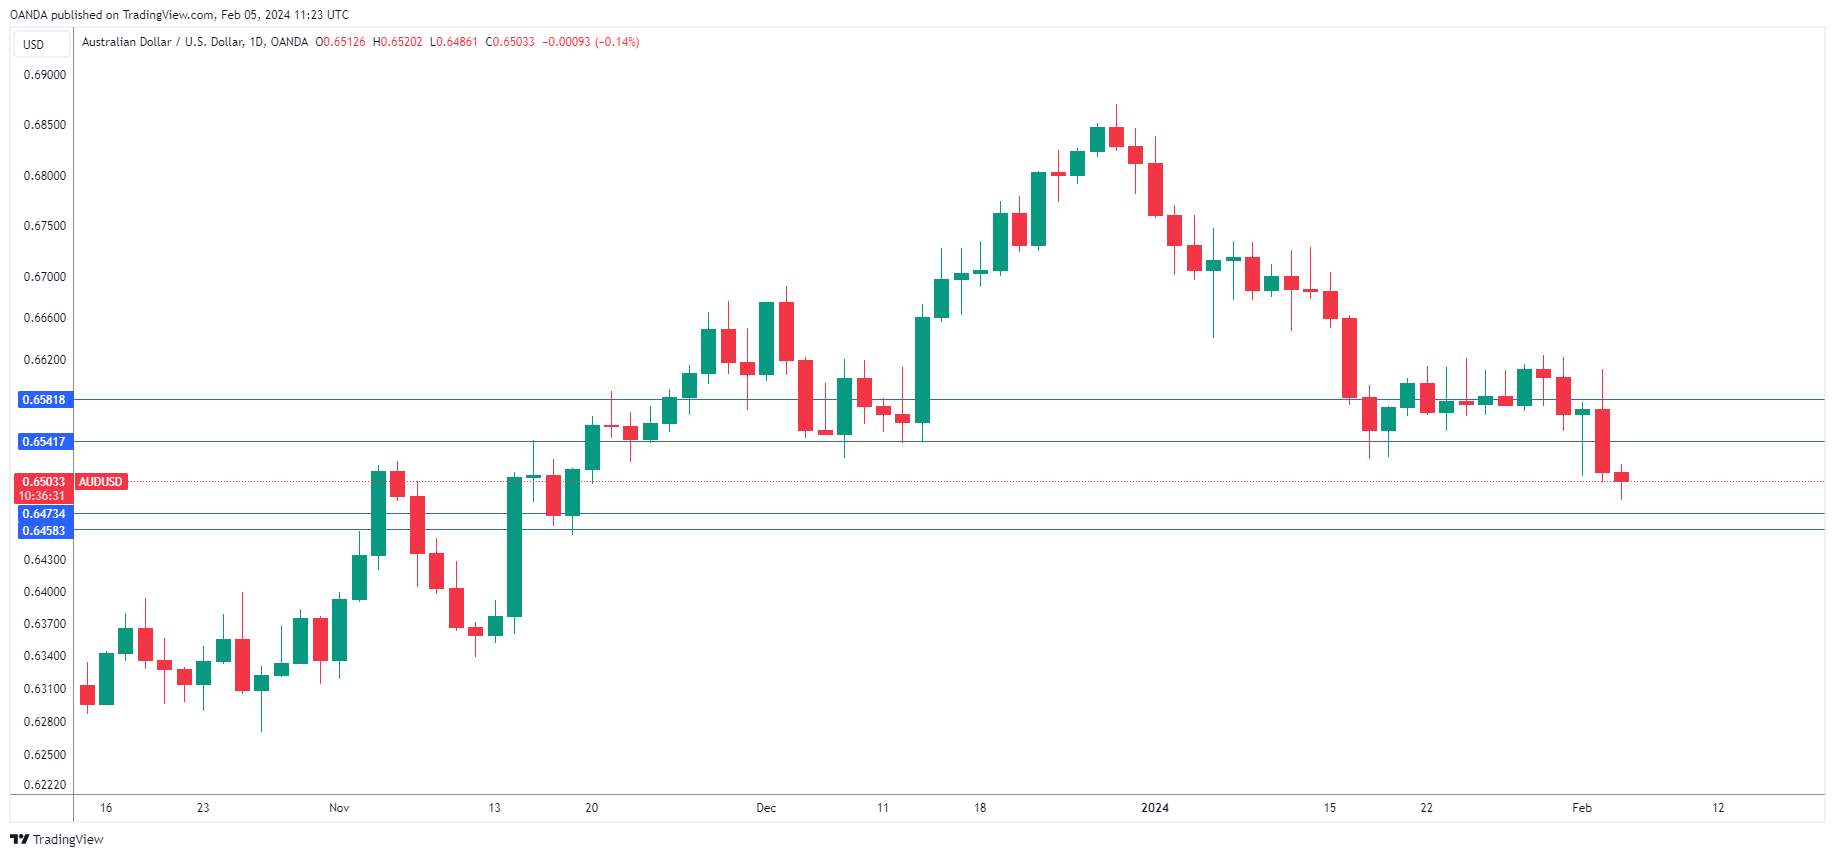
The Australian dollar is slightly lower on Monday, after sliding 0.90% on Friday. In the European session, AUD/USD is trading at 0.6499, down 0.21%. Earlier, AUD/USD traded as low as 0.6486, its lowest level since mid-November.
RBA set to hold rates
The Reserve Bank of Australia is expected to maintain the benchmark rate at 4.35% at Tuesday’s meeting, the first of 2024. The RBA raised rates in November but has been reluctant to start trimming rates, even though inflation has been falling and retail sales fell sharply in December. There is still some distance to go in the inflation battle, with inflation running at 3.4% y/y. This is close to the upper band of the RBA’s target range of 1-3%, but as the Fed has experienced in its battle to tame inflation, the last mile of the race has proven to be the toughest.
What can we expect from the RBA on Tuesday? With inflation still elevated and sticky, we could see the central bank remain cautious and push back against rate cut expectations. Last week’s inflation and retail sales reports were weaker than expected, prompting traders to bring forward bets on rate cuts. The markets have priced in a rate cut in May at 50-50 and an 80% probability in June. If Governor Bullock maintains its hawkish stance, the struggling Australian dollar could get a boost.
US nonfarm payrolls soars
The US nonfarm payroll report sizzled in January with a gain of 353,000, crushing the market estimate of 180,000. The December release was revised upwards to 333,000, up from 216,000. As well, wage growth rose 0.6% m/m, up from 0.4% in December and double the market estimate of 0.3%. This points to a robust labor market.
The markets lowered expectations of a March rate cut to 20% after the employment release and that has fallen to 15% on Monday, according to the CME FedWatch tool. The 10-year US Treasury yield climbed above 4% after the employment report.
AUD/USD Technical
- 0.6473 and 0.6433 are providing support
- There is resistance at 0.6541 and 0.6581
OECD raises global growth forecasts to 2.9% in 2024 on robust US performance
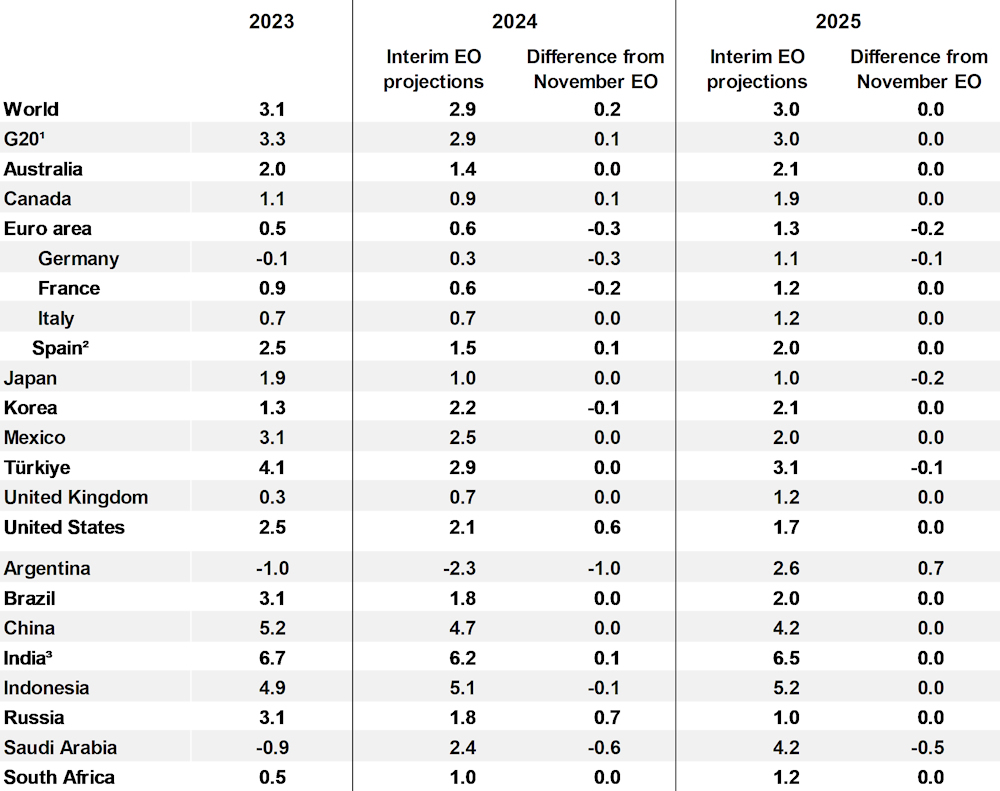
OECD's latest Interim Economic Outlook report presents a cautiously optimistic upgrade in global growth forecasts for 2024 to 2.9% (up from November's 2.7% forecast), a notable uplift largely attributed to stronger performance of US economy.
"Some moderation of growth" from 2023 is expected, under the influence of tighter financial conditions affecting credit and housing markets, alongside a subdued global trade dynamics. Recent attacks on ships in the Red Sea have introduced further volatility and exert upward pressure on prices.
Despite some moderation in growth and the ongoing adjustments to tighter financial conditions, OECD cautions that it is "too soon to be sure that underlying price pressures are fully contained." Labor markets showing signs of equilibrium bring a positive note, yet the persistently high unit labor cost growth looms as a challenge for meeting medium-term inflation targets.
The specter of high geopolitical tension, particularly in the Middle East, poses a "significant near-term risk to activity and inflation", with potential disruptions in energy markets likely to have far-reaching consequences. Furthermore, persistent service price pressures could lead to inflation surprises, necessitating reevaluation of monetary policy easing expectations. On the other hand, growth could be weaker if effects of past monetary tightening are stronger than expected.
Here are some details.
- Global growth forecast for 2024 raised up by 0.2% to 2.9%. 2025 unchanged at 3.0%.
- US growth forecast for 2024 raised by 0.6% to 2.1%. 2025 unchanged at 1.7%.
- Eurozone growth forecast for 2024 lowered by -0.3% to 0.6%, 2025 down by -0.2% to 1.3%.
- Japan's growth forecast for 2024 unchanged at 1.0%. 2025 lowed by -0.2% to 1.0%.
- China's growth forecast for 2024 unchanged at 4.7%. 2025 unchanged at 4.2%.
USDJPY Stops Beneath 2-month High
- USDJPY trades sideways after failing to extend its breakout
- RSI and MACD are hovering in their positive regions
- Stochastic indicates overstretched market
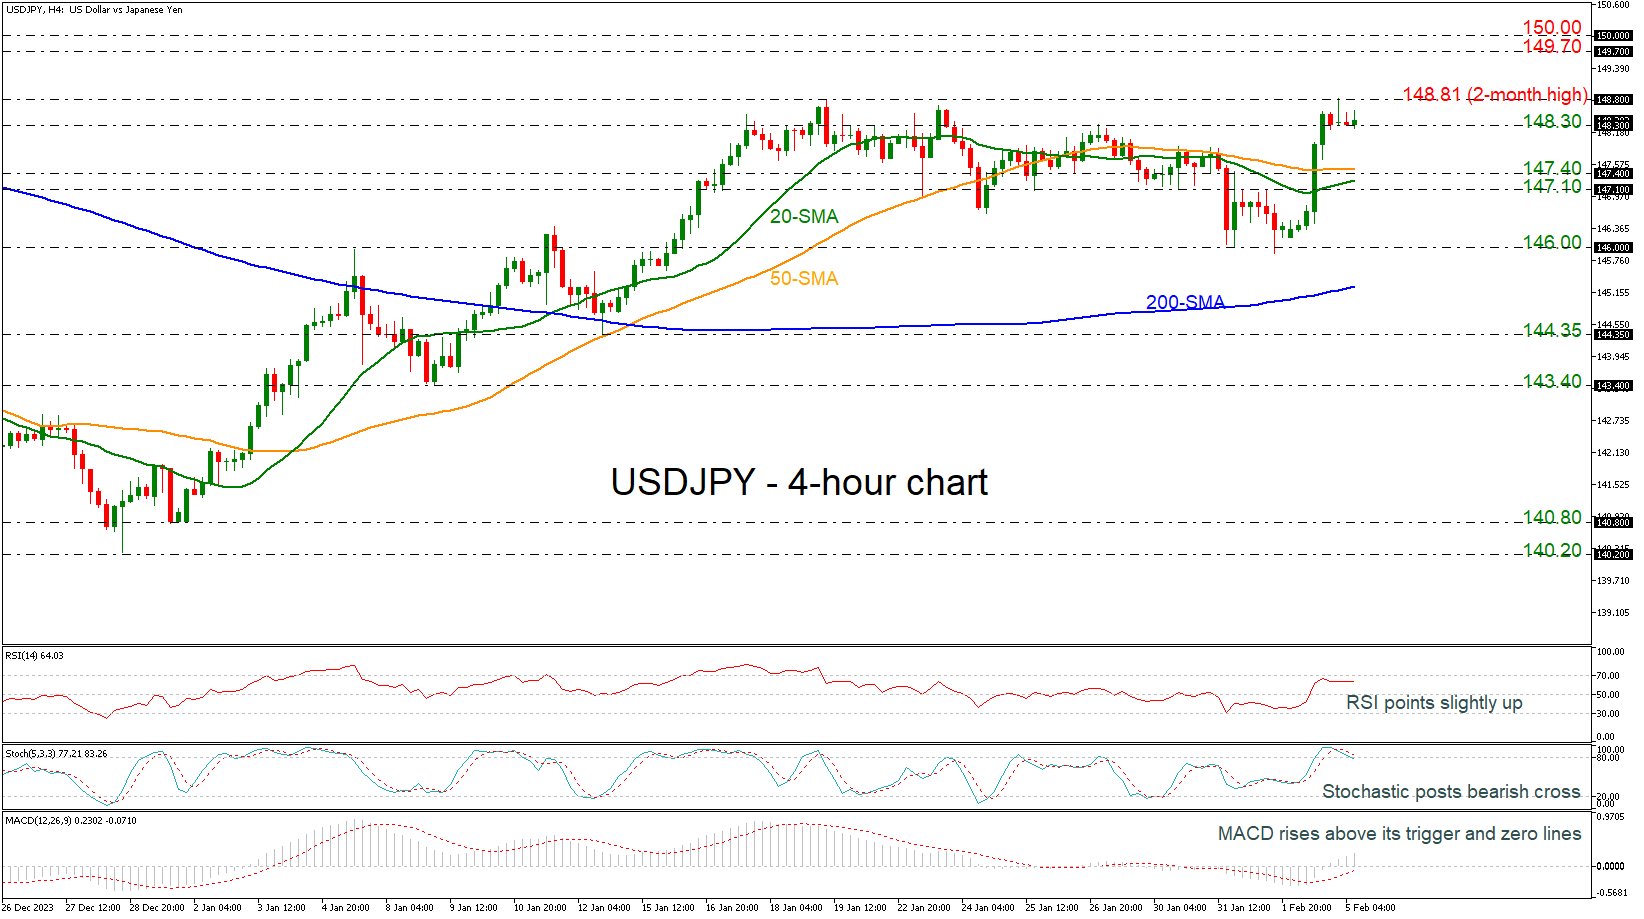
USDJPY came close to breaking the 148.81 level in the preceding week, recording a two-month high. According to the RSI, the market could maintain positive momentum in the short-term as the indicator is positively sloped near the 70 level and the MACD is extending its bullish movement above its trigger and zero lines. However, the fast Stochastics suggest that the market is located in overbought territory and therefore some weakness is possible; the %K posted a bearish crossover with the %D line.
On the upside, the price could attempt to overcome the 148.81 barrier and retest the 149.70-150.00 area, taken from the peaks in November 2023.
A reversal to the downside, on the other hand, could find immediate support at the 148.30 zone before hitting the 50-period simple moving average (SMA) at 147.70 in the 4-hour chart, ahead of 147.10. If the latter fails to halt bearish movements, the next target could be the 146.00 psychological mark.
Turning to the bigger view, the outlook has been neutral over the past three weeks and only a decisive close above 148.81 could resume the bullish picture. On the other hand, a significant decline below the 200-period SMA at 145.25 could shift the outlook to bearish.
Pushing Down Crypto Isn’t Easy
Market picture
Buying on dips remains the dominant tactic in the crypto market. Capitalisation rose 1.8% in seven days to $1.65 trillion. Previously, the ‘what doesn’t rise, falls’ formula was often applied to cryptocurrencies. However, recent attempts to sell off after a period of stabilisation have been met with increased buying.
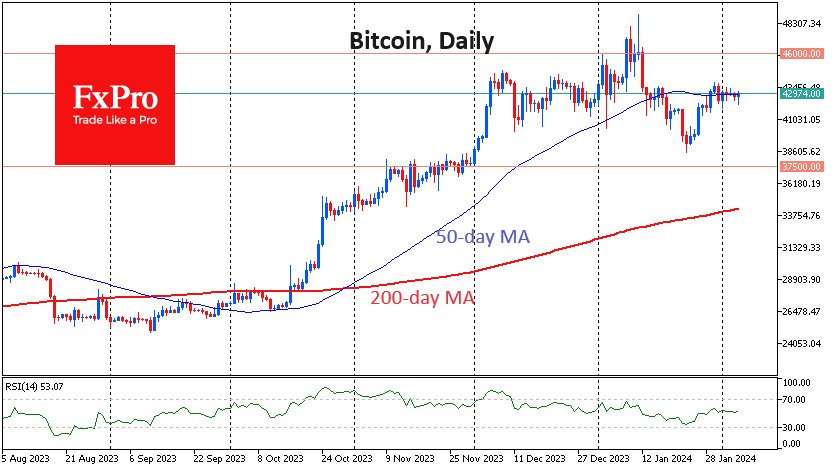
Bitcoin remains at $43.0K. At the start of trading on Monday, there was an attempt to sell the price lower amid weakness in the Chinese markets. However, BTCUSD was bought back twice on dips to $42.2K. This solid support significantly weakened the sellers’ onslaught, which quickly brought the price back to $43,000 – the centre of gravity for the exchange rate since early December. That’s also where the 50-day moving average now sits, suggesting that the market is still undecided about direction.
In traditional financial markets, the dollar and equity indices are simultaneously rising, but overall risk appetite is more accurately described as subdued. Exclusive drivers for the crypto market (such as bitcoin ETFs, etc.) have so far played out, forcing investors to wait for the next signal.
News background
According to Coinbase, the selling pressure on Bitcoin is easing, and macroeconomic factors favour the growth of the first cryptocurrency. The technical factors that supported Bitcoin’s decline are starting to weaken. In addition, there is steady interest in the spot bitcoin ETFs that have been launched.
Popular crypto analyst Michael van de Poppe believes that Ethereum could rise to $3500-$4000 in the next three to six months. The upcoming Dencun update and the likely launch of spot ETFs on the second cryptocurrency could contribute to the growth.
The growing dominance of Tether is a negative factor for the stablecoin market and the crypto ecosystem, says JPMorgan Bank. Tether is at risk due to its lack of regulatory compliance and transparency.
Tether’s success is due to its financial strength, significant reserves and commitment to emerging markets, where entire communities use USDT as a lifeline to protect against high inflation and devaluation of national currencies, said Tether CTO Paolo Ardoino.
The US Department of Energy will survey mining companies about their electricity use. The agency plans to complete the survey within six months. Last year, miners accounted for between 0.6% and 2.3% of total US energy consumption. According to MinerMetrics, the US accounts for around 40% of the total BTC hash rate.
Bankrupt crypto platform Celsius has begun paying off $3 billion in debt to creditors under an approved restructuring plan.
Singapore’s law enforcement agencies issued cybersecurity guidelines for citizens investing in crypto assets, recommending that funds be kept in hardware crypto wallets.
Eurozone PPI down -0.8% mom, -10.6% yoy in Dec
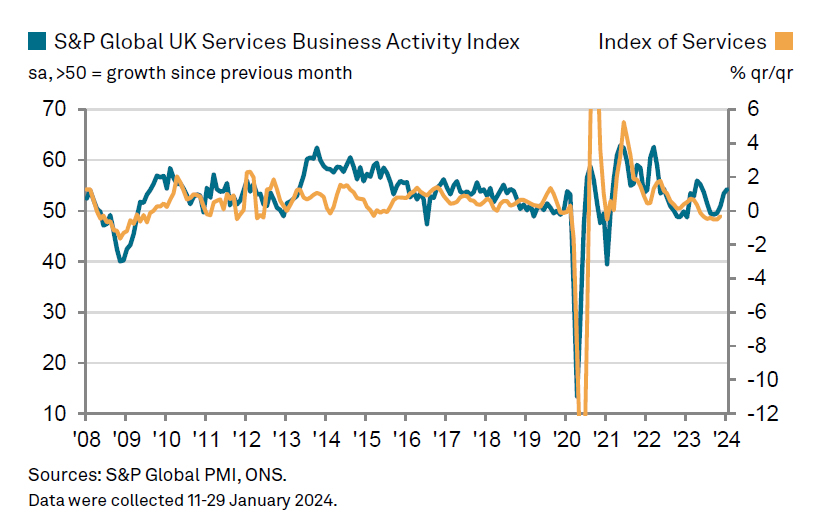
Eurozone PPI was down -0.8% mom, -10.6% yoy in December, versus expectation of -0.8% mom, -10.6% yoy. For the month, industrial producer prices decreased by -2.3% mom for energy and by -0.3% mom for intermediate goods, while prices remained stable for both capital goods and durable consumer goods, and prices increased by 0.1% mom for non-durable consumer goods. Prices in total industry excluding energy decreased by -0.1% mom.
EU PPI was down -0.9% mom, -10.0% yoy. The largest monthly decreases in industrial producer prices were recorded in Ireland (-12.0%), the Netherlands (-1.8%) and Estonia (-1.4%), while increases were observed in Greece (+1.0%), Belgium (+0.5%), Cyprus and Luxembourg (both +0.3%) as well as in France (+0.1%).
Eurozone Sentix rises to -12.9, Germany a negative economic pull
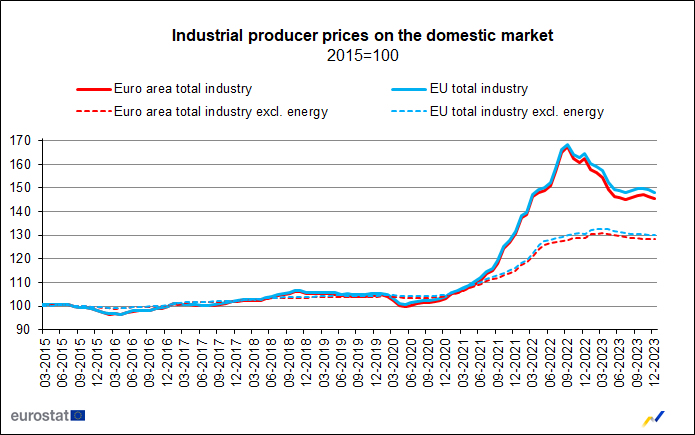
Eurozone Sentix Investor Confidence index climbed for the fourth consecutive month to -12.9, marking its highest point since April 2023. Both Current Situation Index, now at -20.0 (its peak since June 2023), and Expectations Index, reaching -5.5 (the highest since February 2022), have shown similar upward trends, indicating gradual improvement in investor sentiment across the region.
Despite these positive trends, Sentix highlighted that the Eurozone continues to grapple with recessionary pressures. For a genuine economic turnaround, the expectation values need to shift into positive territory.
Germany emerges as a primary concern, acting as the "negative economic pull" for Eurozone. Germany's investor confidence dipping further from -26.1 to -27.1. Current Situation Index worsened to -39.3, but there's a silver lining as Expectations Index improved to -14.0, reaching its highest since April 2023.
UK PMI services finalized at 54.3, revival gained momentum
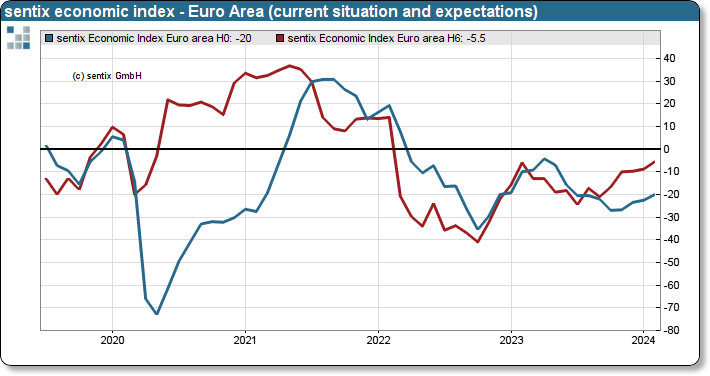
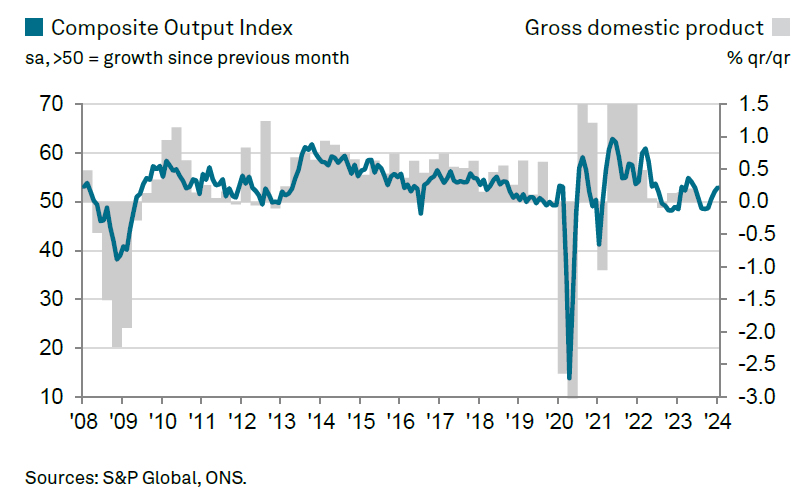
UK PMI Services was finalized at 54.3 in January, up from December's 53.4. PMI Composite was finalized at 52.9, up from prior month's 52.1.
Tim Moore from S&P Global noted the service sector's performance revival, with output growth at its fastest in eight months due to increased business and consumer spending. New orders have rebounded, driven by diminishing recession fears and more flexible financial conditions.
Inflationary pressures eased in January, despite demand surge, with input costs rising at one of the slowest rates in three years. This slowdown is attributed to reduced energy, fuel, and raw material costs. However, service providers still face elevated wage pressures, contributing to a continued, albeit slower, rise in prices charged.
Eurozone PMI services finalized at 48.4, Southern strength versus Northern softness
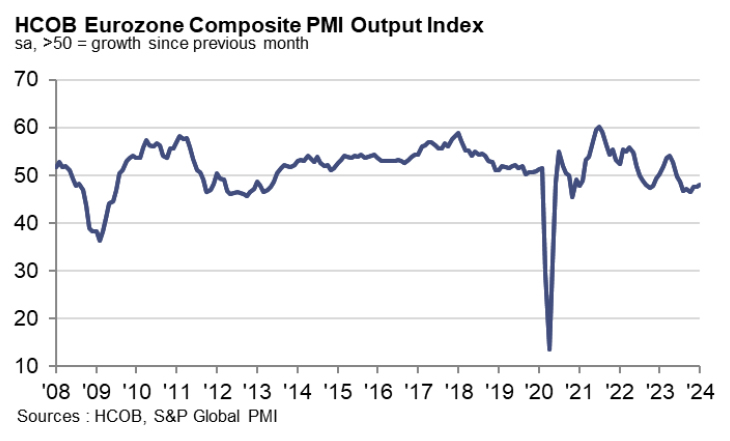
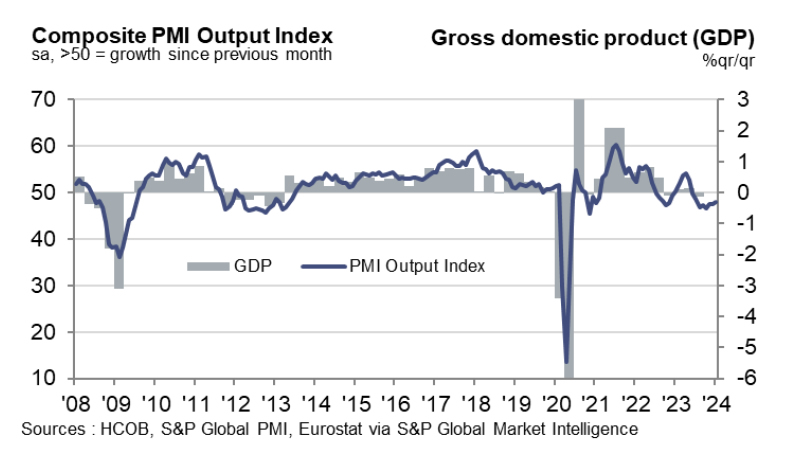
Eurozone PMI Services was finalized at 48.4 in January, down slightly from December's 48.8. PMI Composite was finalized at 47.9, up from prior month's 47.6, a 6-month high.
The data reveals a striking "north-south divide", challenging conventional perceptions. Spain and Italy, with Composite PMIs of 51.5 and 50.7 respectively, outperform their northern peers, Germany (47.0) and France (44.6).
Cyrus de la Rubia, Chief Economist at Hamburg Commercial Bank, noted that ECB caution regarding interest rate cuts is justified by the rising price indices, reflecting increasing input and output prices in the services sector. This inflationary pressure complicates ECB's decisions, especially in light of the latest GDP data for Q4 2023, which showed the eurozone narrowly avoiding a technical recession.
The persistent eurozone-wide labor shortage, leading to wage increases and input price inflation, especially in the top economies, indicates a cautious approach to workforce reductions, even in weaker service sectors of Germany and France.
EURUSD Unlocks 2-month Low Below 1.0800
- EURUSD meets lower boundary of bearish triangle
- Market is in descending tendency
- MACD and RSI strengthen bearish bias
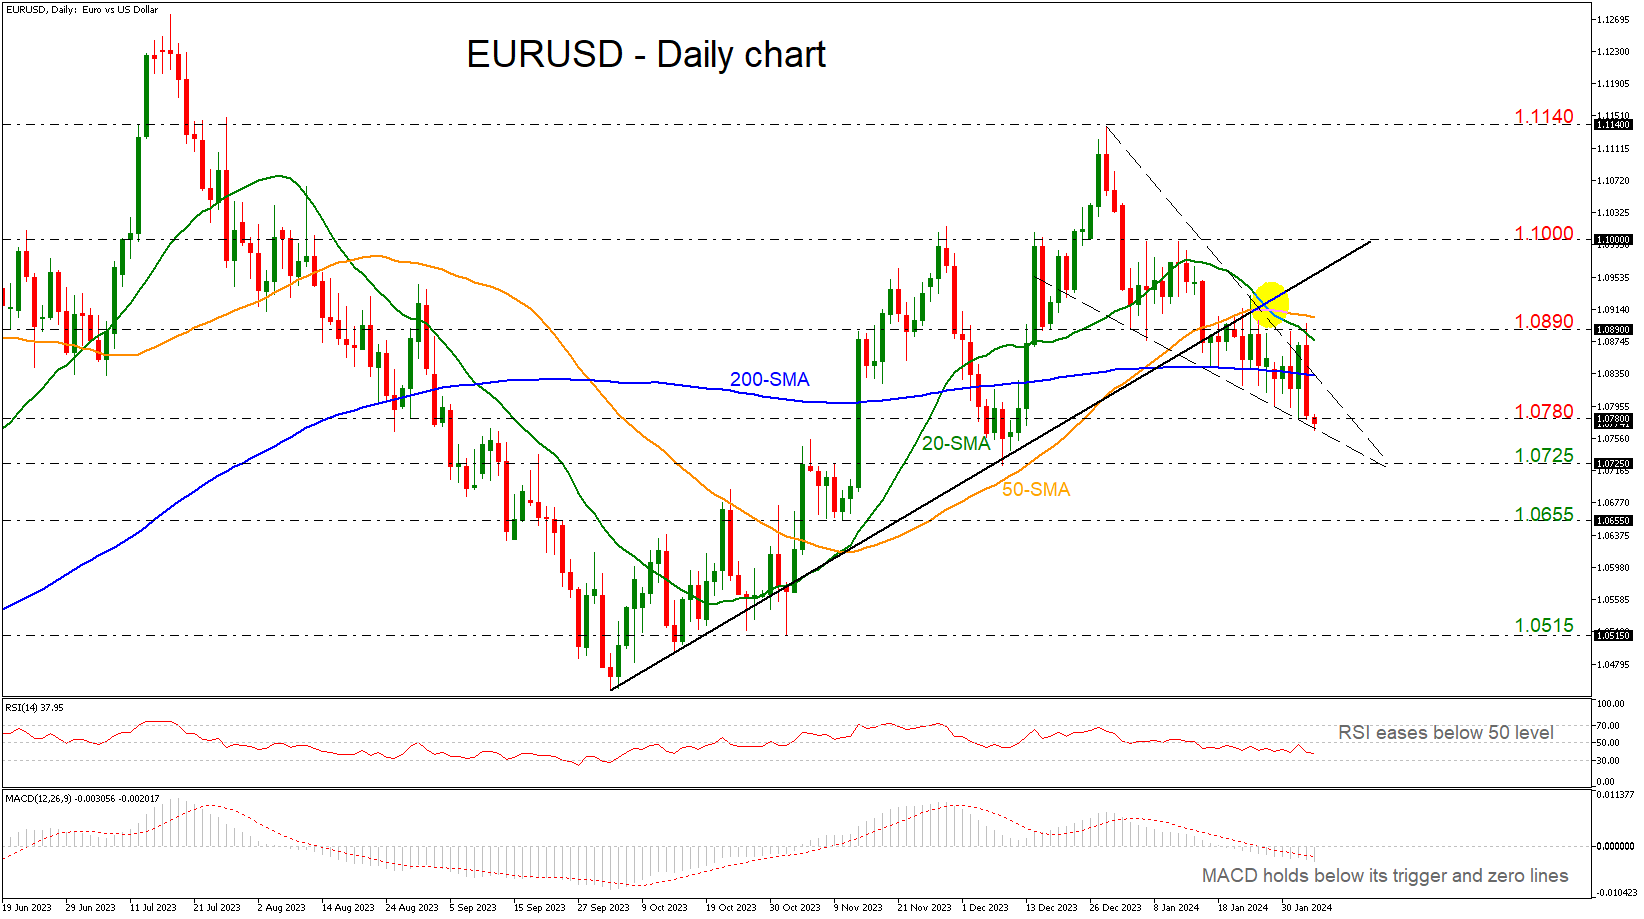
EURUSD plummeted more than 1% on Friday after the release of the NFP report and posted a fresh almost two-month low of 1.0766 earlier today, meeting the lower boundary of the bearish triangle.
The price is also developing beneath the 200-day simple moving average (SMA) and the 20- and 50-day SMAs act as strong resistance levels as well, after the bearish crossover that occurred in the preceding sessions. The RSI is standing beneath the neutral threshold of 50 and is moving lower, while the MACD is strengthening its negative momentum below its trigger and zero lines.
Further losses should see the December 8 low of 1.0725, endorsing the descending tendency in the market. A drop lower would take the price towards the 1.0655 support ahead of the 1.0515 barricade, taken from the bottom on November 1.
In the event of an upside reversal, the 200-day SMA at 1.0835 could act as a barrier before being able to re-challenge the 1.0890 resistance which holds between the short-term SMAs. A break above this region would shift the short-term outlook to a more neutral one as it would take the pair above the 1.1000 round number. Further gains would lead the way towards the 1.1140 high.
All in all, EURUSD seems to be in a bearish mode with the technical oscillators endorsing this view. However, a climb above 1.1000 may raise some optimism for a bullish retracement.
US 500 Cash Index Continues to Record Higher Highs
- US 500 index flirts with new all-time highs on daily basis
- Bears lack the strength to stage a correction
- Momentum indicators still support the bullish move
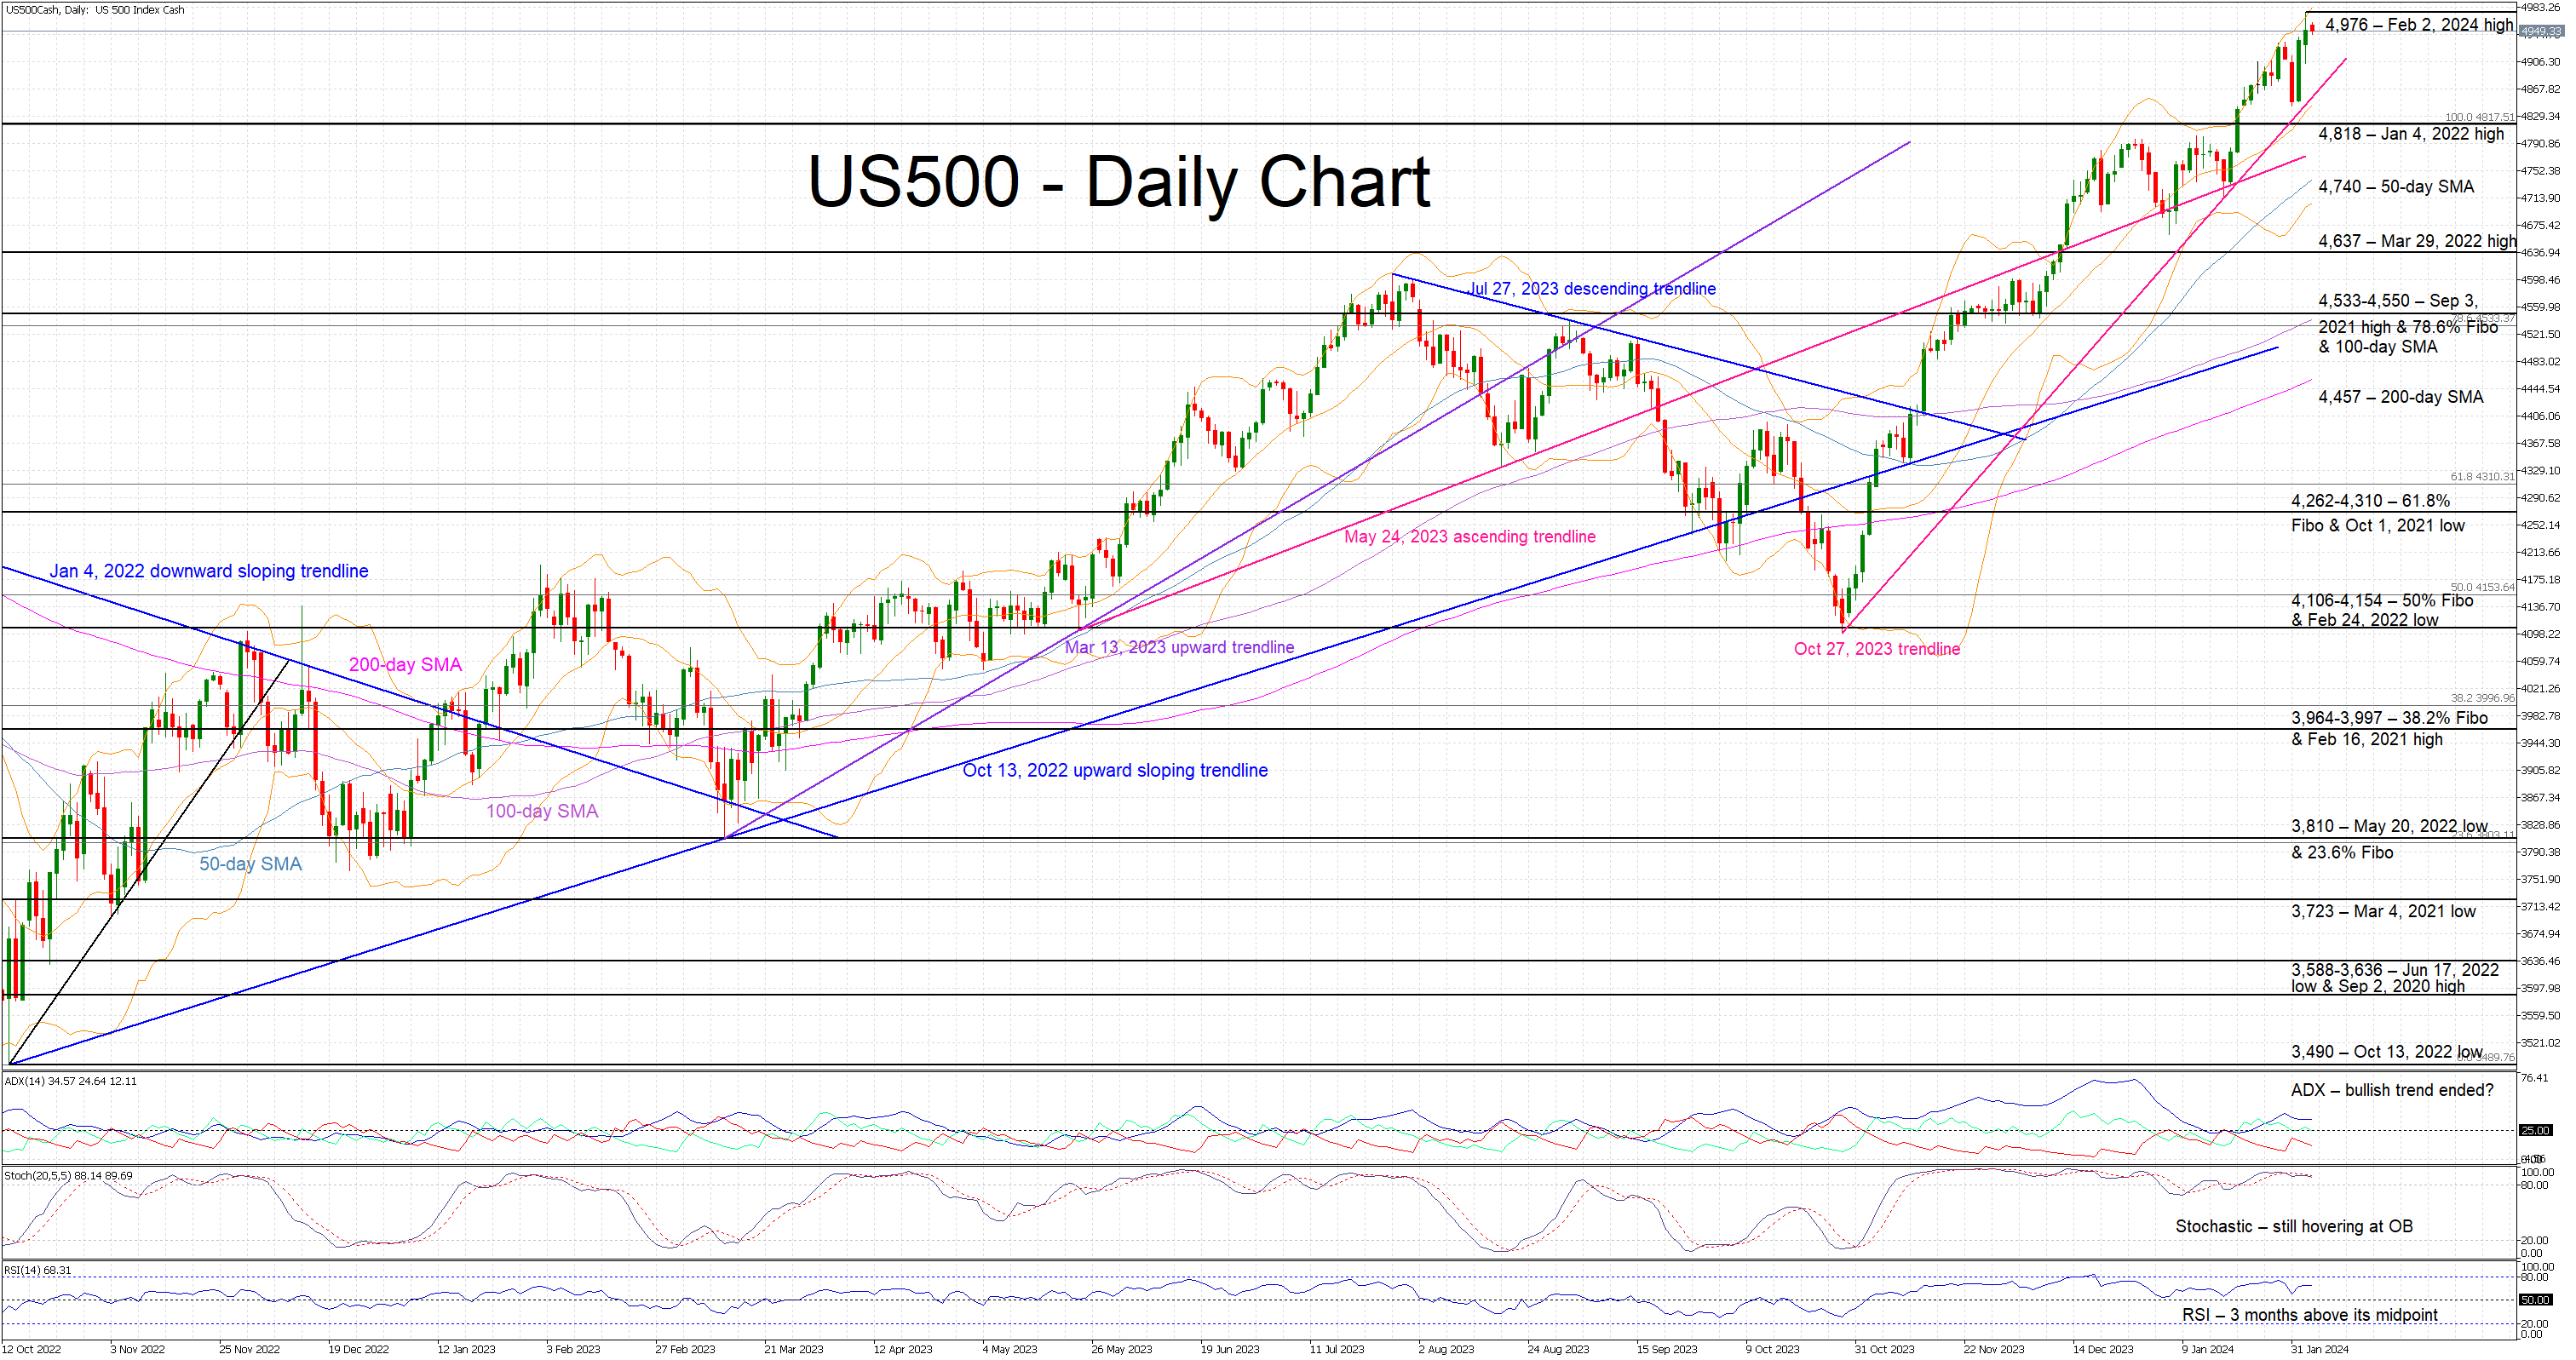
The US 500 cash index is edging lower after recording a new all-time high of 4,976 last week. Friday’s US labour market statistics do not appear to have dented the market’s bullish appetite. Having said that, the pace of the rally since the October 27, 2023 low of 4,100 remains too aggressive and thus keeping the door open to a much-delayed correction.
The current bullish trend is still assumed to be in place, but the momentum indicators could be close to sending bearish signals. The Average Directional Movement Index (ADX) is hovering a tad above its 25-midpoint, signaling a much-weakened bullish trend in place. Similarly, the RSI is trading sideways, completing three months above its 50-midpoint. More importantly, the stochastic oscillator continues to battle with its simple moving average (SMA) at the overbought (OB) territory. Should it finally manage to break below the OB area, it would be seen as a strong bearish signal.
The bears are desperately trying to recapture the market reins and to push the US 500 index below the October 27, 2023 ascending trendline and towards the January 4, 2022 high at 4,818. If successful, they could have a go at testing the support set by the 50-day SMA and the March 29, 2022 high at 4,740 and 4,637 respectively. Even lower, the bears could face the busy 4,533-4,550 area.
On the flip side, the bulls could first try to keep the US 500 index above the October 27, 2023 trendline and test the resistance set by the February 2, 2024 high at 4,976. Even higher, the 5,000 level looks like the plausible next target.
To conclude, with the US 500 index continuing to record new all-time highs, the bulls are probably feeling extremely confident and ignoring some early rally-exhaustion signals.