

Sample Category Title
EURCAD Selling Perfectly From The Blue Box Area
In this technical blog, we are going to take a look at the past performance of EURCAD 1-Hour Elliott wave Charts that we presented to our members. In which, the decline from the 1/25/2024 peak took place as an impulsive structure and showed a lower sequence with a bearish sequence stamp with the right side tag pointing lower calling for more downside to happen. Therefore, our members knew that selling the intraday bounces in the direction of the right side tag remained the preferred path. We will explain the Elliott wave structure & selling opportunity our members took below:
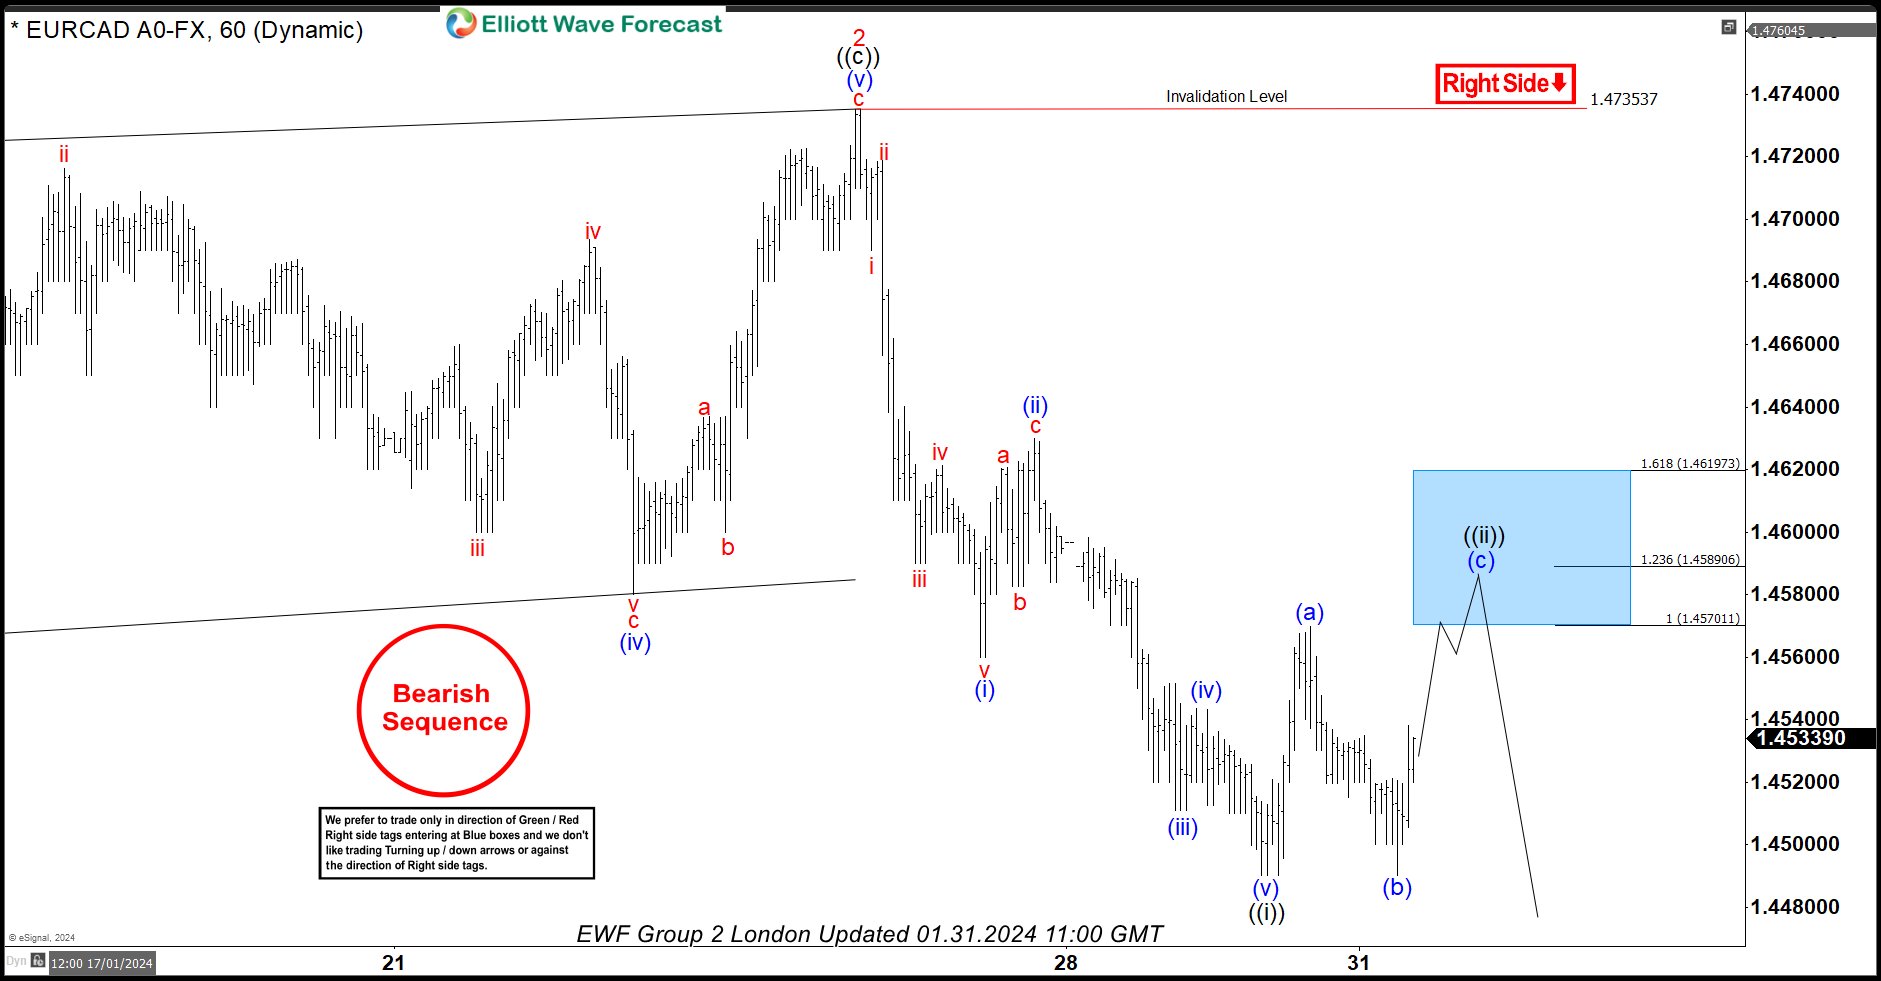
EURCAD 1-Hour Elliott Wave Chart From 1.31.2024
EURCAD 1-Hour Elliott Wave Chart from 1/31/2024 London update. In which the decline to 1.4490 low ended wave ((i)) as an impulse sequence. Up from there, the pair made a bounce in wave ((ii)). The internals of that bounce unfolded as a zigzag structure where lesser degree wave (a) ended at 1.4569 high. Wave (b) pullback ended at 1.4490 low and wave (c) managed to reach the blue box area towards 1.4570- 1.4619 area. From there, sellers were expected to appear looking for further downside or a minimum 3-wave reaction lower.
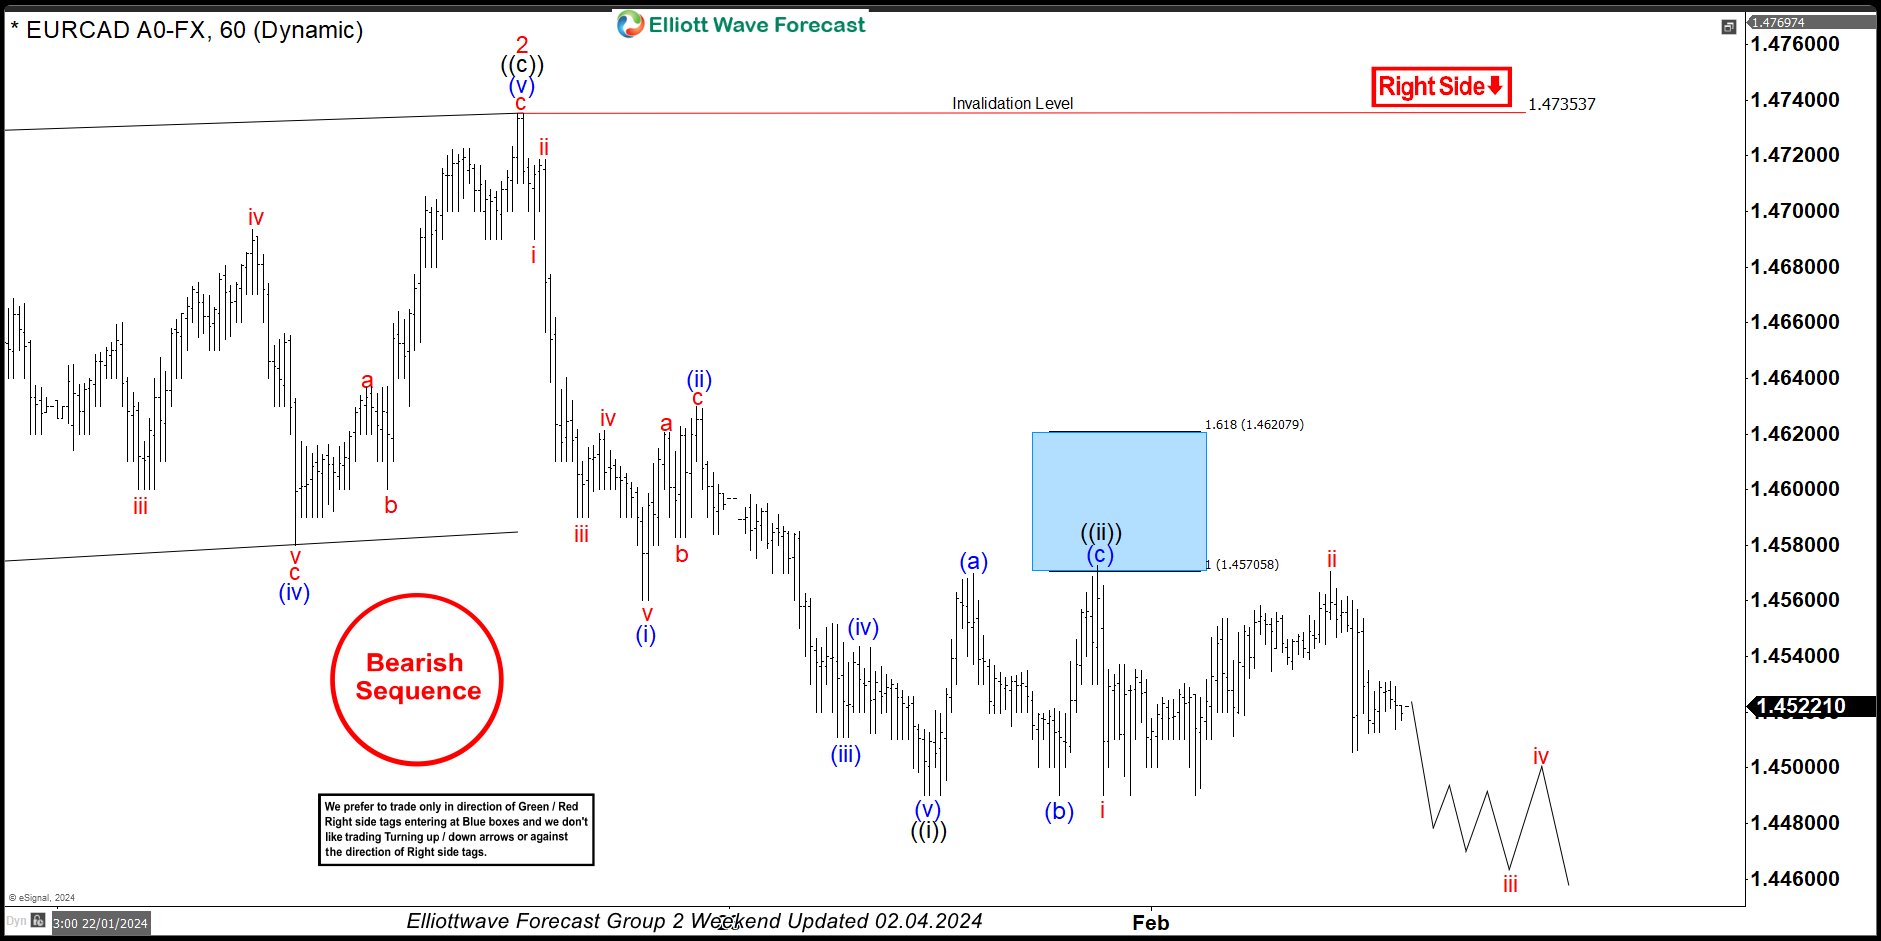
EURCAD Latest 1-Hour Elliott Wave Chart From 2.04.2024
This is the latest 1-Hour view from the 2/04/2024 Weekend update. In which the pair is showing a reaction lower taking place from the blue box area allowing shorts to get into a risk-free position shortly after taking the position. But a break below the 1.4490 low remains to be seen to confirm the next extension lower towards the 1.4231- 1.4112 area & avoid double correction higher.
USD/JPY Mid-Day Outlook
Daily Pivots: (S1) 145.85; (P) 146.48; (R1) 147.07; More...
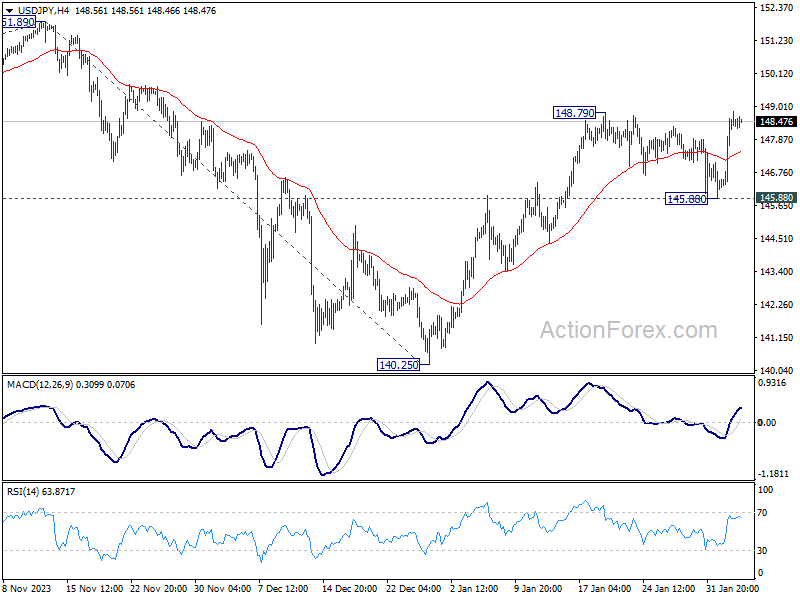
No change in USD/JPY's outlook as focus remains on 148.79 resistance. Firm break there will resume the rally from 140.25 to 151.89/93 key resistance zone. For now, further rise will remain in favor as long as 145.88 holds, in case of retreat.
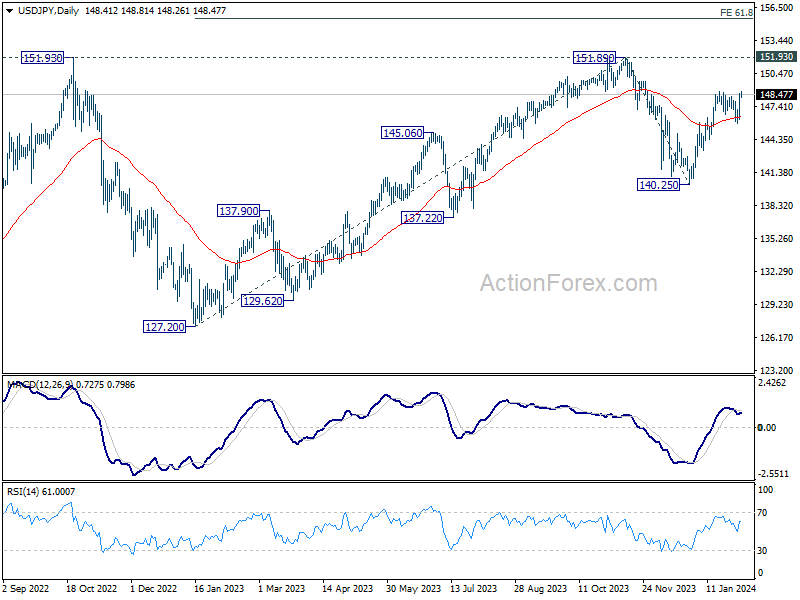
In the bigger picture, fall from 151.89 is seen as a correction to the rally from 127.20, which might have completed at 140.25 already. Firm break of 151.89/93 resistance zone will confirm up trend resumption next target will be 61.8% projection of 127.20 to 151.89 from 140.25 at 155.50. This will now remain the favored case as long as 140.25 support holds.
USD/CHF Mid-Day Outlook
Daily Pivots: (S1) 0.8588; (P) 0.8634; (R1) 0.8716; More....
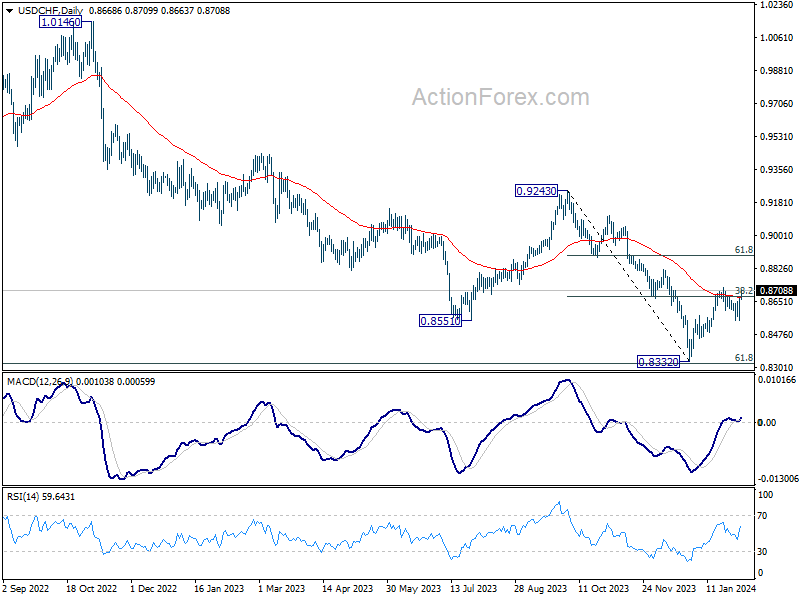
USD/CHF is still capped below 0.8727 resistance and intraday bias stays neutral first. On the upside, above 0.8727 will resume the rebound from 0.8332, and target 61.8% retracement of 0.9243 to 0.8332 at 0.8995. On the downside, break of 0.8550 will turn bias back to the downside for retesting 0.8332 low instead.
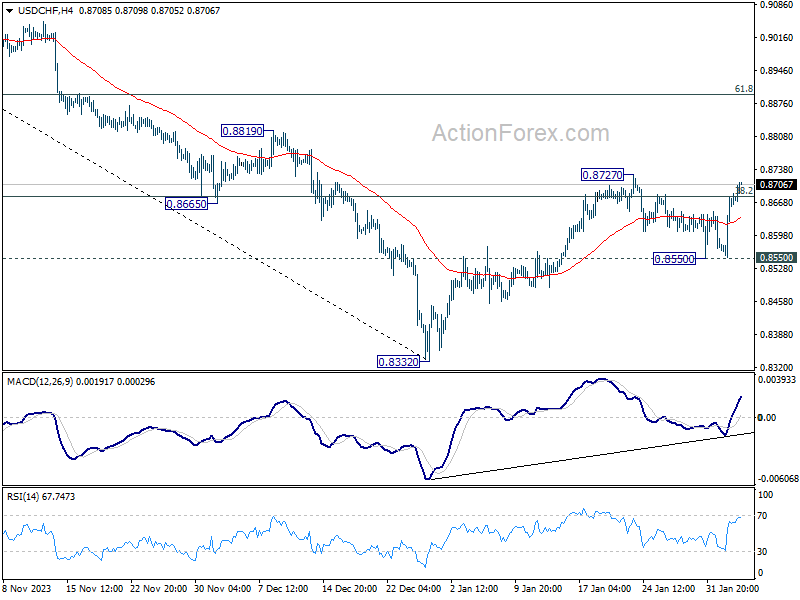
In the bigger picture, there is prospect of medium term bottoming at 0.8332 considering possible bullish convergence condition in W MACD, and the support from 0.8317 long term fibonacci support. Sustained trading above 55 D EMA (now at 0.8672) will affirm this case, and bring stronger rise back towards 0.9243 resistance, even as a corrective move.
GBP/USD Mid-Day Outlook
Daily Pivots: (S1) 1.2574; (P) 1.2673; (R1) 1.2732; More...
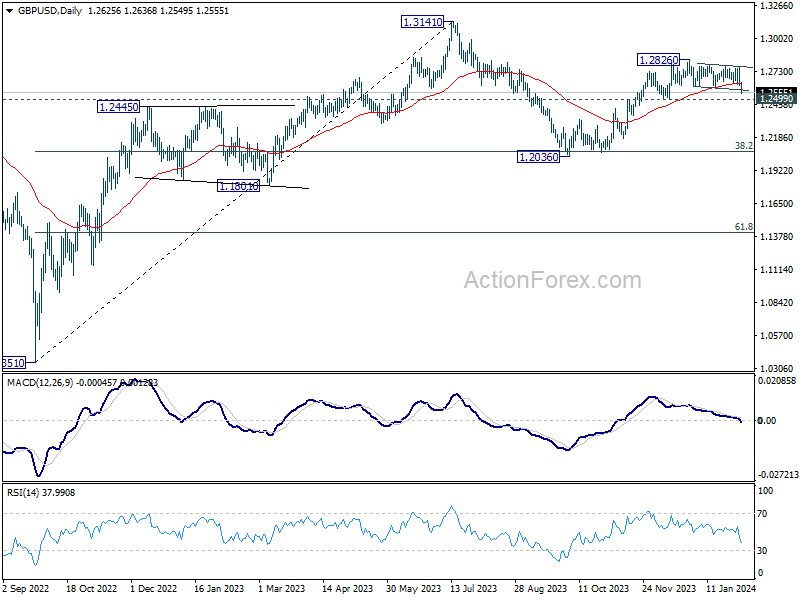
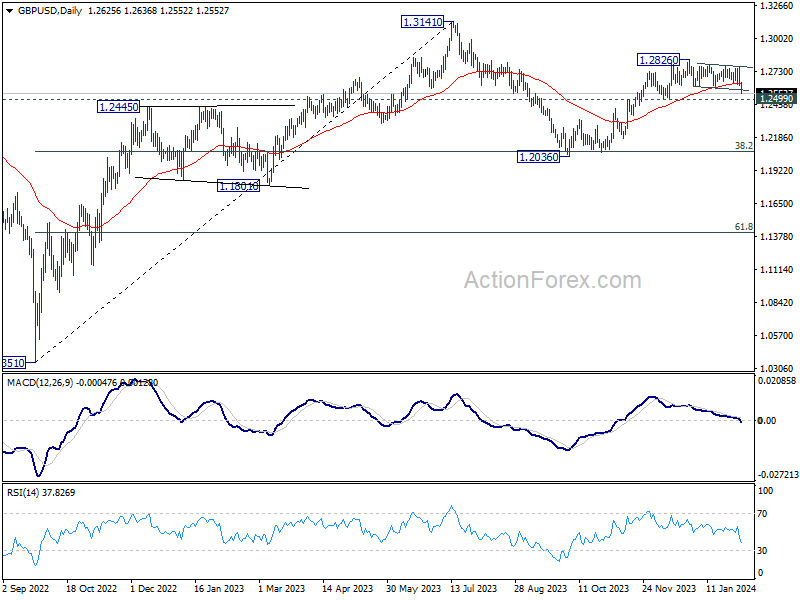
Intraday bias in GBP/USD is back on the downside as the fall from 1.2826 resumes. Strong focus could be seen from 1.2499 structural support. Break of 1.2643 minor resistance will turn bias back to the upside for rebound. However, decisive break of 1.2499 will argue that whole rise from 1.2036 has completed and turn near term outlook bearish.
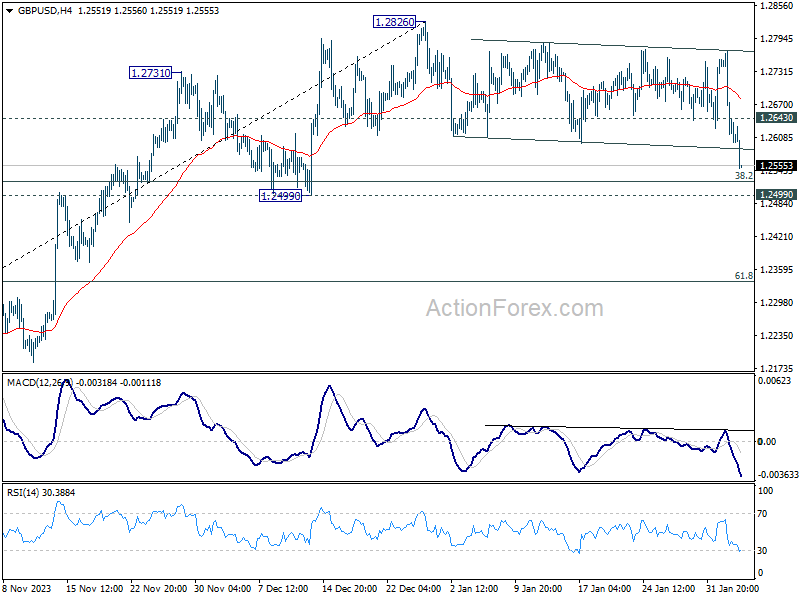
In the bigger picture, price actions from 1.3141 medium term top are seen as a corrective pattern to up trend from 1.0351 (2022 low). Rise from 1.2036 is seen as the second leg that's still in progress. Upside should be limited by 1.3141 to bring the third leg of the pattern. Meanwhile, break of 1.2499 support will argue that the third leg has already started for 38.2% retracement of 1.0351 (2022 low) to 1.3141 at 1.2075 again.
EUR/USD Mid-Day Outlook
Daily Pivots: (S1) 1.0747; (P) 1.0822; (R1) 1.0864; More...
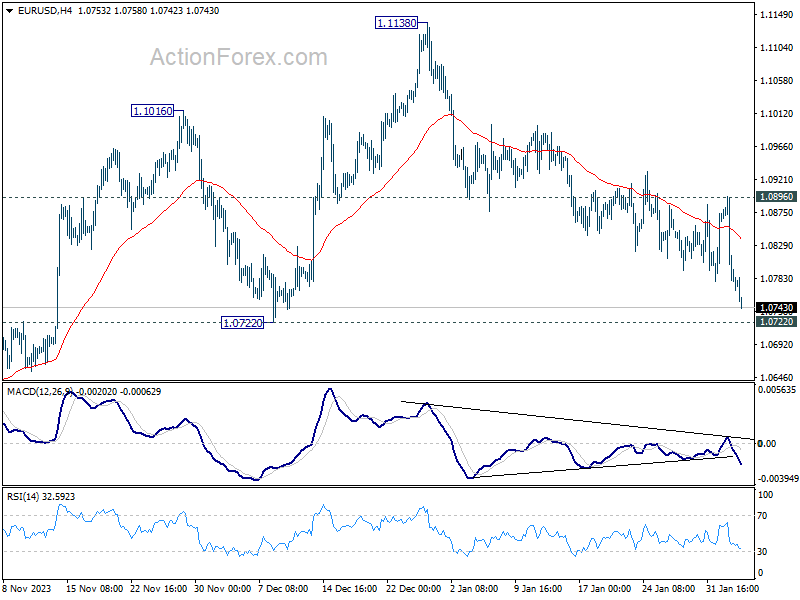
EUR/USD's fall from 1.1138 continues today, and the break of trend line in 4H MACD indicates downside acceleration. Intraday bias remains on the downside. Sustained break of 1.0722 structural support will argue that whole rise from 1.0447 has completed. Deeper fall would then be seen to target this low. On the upside, break of 1.0896 resistance is needed to indicate short term bottoming. Otherwise, risk will stay on the downside in case of recovery.
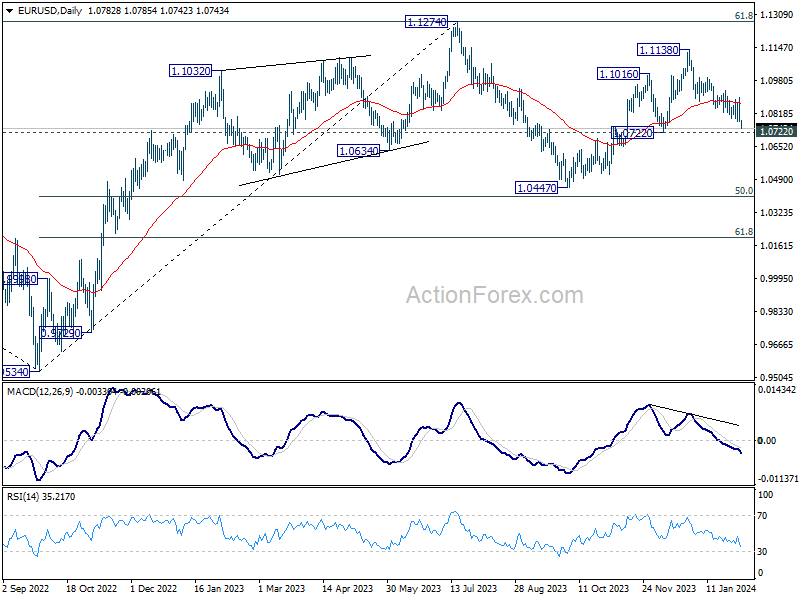
In the bigger picture, price actions from 1.1274 are viewed as a corrective pattern to rise from 0.9534 (2022 low). Rise from 1.0447 is seen as the second leg. While further rally could cannot be ruled out, upside should be limited by 1.1274 to bring the third leg of the pattern. Meanwhile, sustained break of 1.0722 support will argue that the third leg has already started for 1.0447 and possibly below.
Dollar’s Dominance Continues, Sterling and Euro Accelerate Down
Dollar's robust rally persists in early US session, and gains momentum alongside the strong rise 10-year yield, now surpassing the 4.1% mark. Fed Chair Jerome Powell's hawkish comments in CBS interview air during the weekend continued to shift market expectations. The probability of Fed holding interest rate unchanged in March has soared to approximately 85%, with the anticipation of a May rate cut dropping to just over 60%. It's important to note, though, that these expectations could shift in response to the forthcoming ISM Services data, which remains a crucial determinant of market sentiment.
In terms of currency strength, Japanese Yen emerges as the runner-up, with New Zealand Dollar not far behind. This scenario, however, reflects more on the deeper depreciation of other currencies rather than intrinsic strength in Yen and Kiwi. On the other end of the spectrum, Euro and Sterling are the worst performers, finding themselves under considerable pressure against Dollar. Australian Dollar is also soft, and appears susceptible to dovish surprises from RBA in the upcoming Asian session. Meanwhile, Canadian Dollar and Swiss Franc show mixed performances, finding themselves in the market's middle ground.
Technically, as Dollar advances, a focus will be on 1.2499 support in GBP/USD. Sustained break there will argue that whole rise from 1.2036 has completed, as the second leg of the corrective pattern from 1.3141 high. If realized, that would turn outlook bearish for 1.2036, as the third leg of the pattern progresses.
In Europe, at the time of writing, FTSE is up 0.31%. DAX is down -0.09%. CAC is down -0.12%. UK 10-year yield is up 0.077 at 4.008. Germany 10-year yield is up 0.0698 at 2.310. Earlier in Asia, Nikkei rose 0.54%. Hong Kong HSI fell -0.15%. China Shanghai SSE fell -1.02%. Singapore Strait Times fell -1.43%. Japan 10-year yield rose 0.0598 to 0.720.
OECD raises global growth forecasts to 2.9% in 2024 on robust US performance
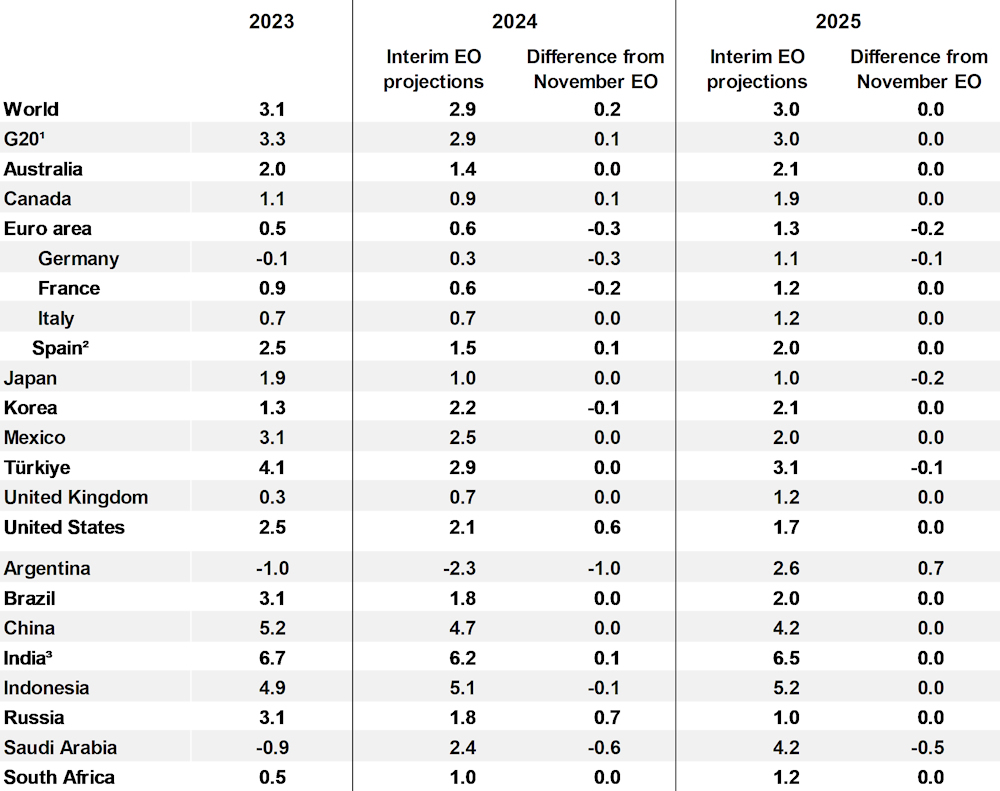
OECD's latest Interim Economic Outlook report presents a cautiously optimistic upgrade in global growth forecasts for 2024 to 2.9% (up from November's 2.7% forecast), a notable uplift largely attributed to stronger performance of US economy.
"Some moderation of growth" from 2023 is expected, under the influence of tighter financial conditions affecting credit and housing markets, alongside a subdued global trade dynamics. Recent attacks on ships in the Red Sea have introduced further volatility and exert upward pressure on prices.
Despite some moderation in growth and the ongoing adjustments to tighter financial conditions, OECD cautions that it is "too soon to be sure that underlying price pressures are fully contained." Labor markets showing signs of equilibrium bring a positive note, yet the persistently high unit labor cost growth looms as a challenge for meeting medium-term inflation targets.
The specter of high geopolitical tension, particularly in the Middle East, poses a "significant near-term risk to activity and inflation", with potential disruptions in energy markets likely to have far-reaching consequences. Furthermore, persistent service price pressures could lead to inflation surprises, necessitating reevaluation of monetary policy easing expectations. On the other hand, growth could be weaker if effects of past monetary tightening are stronger than expected.
Here are some details.
- Global growth forecast for 2024 raised up by 0.2% to 2.9%. 2025 unchanged at 3.0%.
- US growth forecast for 2024 raised by 0.6% to 2.1%. 2025 unchanged at 1.7%.
- Eurozone growth forecast for 2024 lowered by -0.3% to 0.6%, 2025 down by -0.2% to 1.3%.
- Japan's growth forecast for 2024 unchanged at 1.0%. 2025 lowed by -0.2% to 1.0%.
- China's growth forecast for 2024 unchanged at 4.7%. 2025 unchanged at 4.2%.
Eurozone Sentix rises to -12.9, Germany a negative economic pull
Eurozone Sentix Investor Confidence index climbed for the fourth consecutive month to -12.9, marking its highest point since April 2023. Both Current Situation Index, now at -20.0 (its peak since June 2023), and Expectations Index, reaching -5.5 (the highest since February 2022), have shown similar upward trends, indicating gradual improvement in investor sentiment across the region.
Despite these positive trends, Sentix highlighted that the Eurozone continues to grapple with recessionary pressures. For a genuine economic turnaround, the expectation values need to shift into positive territory.
Germany emerges as a primary concern, acting as the "negative economic pull" for Eurozone. Germany's investor confidence dipping further from -26.1 to -27.1. Current Situation Index worsened to -39.3, but there's a silver lining as Expectations Index improved to -14.0, reaching its highest since April 2023.
Eurozone PPI down -0.8% mom, -10.6% yoy in Dec
Eurozone PPI was down -0.8% mom, -10.6% yoy in December, versus expectation of -0.8% mom, -10.6% yoy. For the month, industrial producer prices decreased by -2.3% mom for energy and by -0.3% mom for intermediate goods, while prices remained stable for both capital goods and durable consumer goods, and prices increased by 0.1% mom for non-durable consumer goods. Prices in total industry excluding energy decreased by -0.1% mom.
EU PPI was down -0.9% mom, -10.0% yoy. The largest monthly decreases in industrial producer prices were recorded in Ireland (-12.0%), the Netherlands (-1.8%) and Estonia (-1.4%), while increases were observed in Greece (+1.0%), Belgium (+0.5%), Cyprus and Luxembourg (both +0.3%) as well as in France (+0.1%).
Eurozone PMI services finalized at 48.4, Southern strength versus Northern softness
Eurozone PMI Services was finalized at 48.4 in January, down slightly from December's 48.8. PMI Composite was finalized at 47.9, up from prior month's 47.6, a 6-month high.
The data reveals a striking "north-south divide", challenging conventional perceptions. Spain and Italy, with Composite PMIs of 51.5 and 50.7 respectively, outperform their northern peers, Germany (47.0) and France (44.6).
Cyrus de la Rubia, Chief Economist at Hamburg Commercial Bank, noted that ECB caution regarding interest rate cuts is justified by the rising price indices, reflecting increasing input and output prices in the services sector. This inflationary pressure complicates ECB's decisions, especially in light of the latest GDP data for Q4 2023, which showed the eurozone narrowly avoiding a technical recession.
The persistent eurozone-wide labor shortage, leading to wage increases and input price inflation, especially in the top economies, indicates a cautious approach to workforce reductions, even in weaker service sectors of Germany and France.
UK PMI services finalized at 54.3, revival gained momentum
UK PMI Services was finalized at 54.3 in January, up from December's 53.4. PMI Composite was finalized at 52.9, up from prior month's 52.1.
Tim Moore from S&P Global noted the service sector's performance revival, with output growth at its fastest in eight months due to increased business and consumer spending. New orders have rebounded, driven by diminishing recession fears and more flexible financial conditions.
Inflationary pressures eased in January, despite demand surge, with input costs rising at one of the slowest rates in three years. This slowdown is attributed to reduced energy, fuel, and raw material costs. However, service providers still face elevated wage pressures, contributing to a continued, albeit slower, rise in prices charged.
Japan's PMI services finalized at 53.1, fueling overall economic growth
Japan's PMI Services was finalized at 53.1 in January, marking a continuous expansion for the 17th month and an improvement from December's 51.5. PMI Composite was finalized at 51.5, up from prior month's 50.0, indicating a modest uptick in overall private sector activity for the first time since October.
According to Usamah Bhatti, Economist at S&P Global Market Intelligence, key observations include accelerated growth in business activity, new orders, and the first rise in exports in five months.
Capacity pressures intensified, with the strongest backlog increase since last June and a sharper job creation rate. Business confidence for the year ahead hit an eight-month high, reflecting robust optimism.
China's PMI services dips slightly to 52.7, significant challenges remain
In January, China's Caixin PMI Services slightly decreased to 52.7 from 52.9, aligning with expectations. PMI Composite also and a minor reduction to 52.5 from 52.6.
Wang Zhe, Senior Economist at Caixin Insight Group, pointed out that the economy faces "significant challenges" including tepid demand, increased employment pressures, and subdued market expectations, indicating that "This status quo has yet to experience a fundamental reversal."
EUR/USD Mid-Day Outlook
Daily Pivots: (S1) 1.0747; (P) 1.0822; (R1) 1.0864; More...
EUR/USD's fall from 1.1138 continues today, and the break of trend line in 4H MACD indicates downside acceleration. Intraday bias remains on the downside. Sustained break of 1.0722 structural support will argue that whole rise from 1.0447 has completed. Deeper fall would then be seen to target this low. On the upside, break of 1.0896 resistance is needed to indicate short term bottoming. Otherwise, risk will stay on the downside in case of recovery.
In the bigger picture, price actions from 1.1274 are viewed as a corrective pattern to rise from 0.9534 (2022 low). Rise from 1.0447 is seen as the second leg. While further rally could cannot be ruled out, upside should be limited by 1.1274 to bring the third leg of the pattern. Meanwhile, sustained break of 1.0722 support will argue that the third leg has already started for 1.0447 and possibly below.
Economic Indicators Update
| GMT | Ccy | Events | Actual | Forecast | Previous | Revised |
|---|---|---|---|---|---|---|
| 00:00 | AUD | TD Securities Inflation M/M Jan | 0.30% | 1.00% | ||
| 00:30 | AUD | Goods Trade Balance (AUD) Jan | 10.96B | 10.50B | 11.44B | |
| 01:45 | CNY | Caixin Services PMI Jan | 52.7 | 52.7 | 52.9 | |
| 07:00 | EUR | Germany Trade Balance (EUR) Dec | 22.2B | 22.3B | 20.4B | |
| 08:45 | EUR | Italy Services PMI Jan | 51.2 | 50.8 | 49.8 | |
| 08:50 | EUR | France Services PMI Jan F | 45.4 | 45 | 45 | |
| 08:55 | EUR | Germany Services PMI Jan F | 47.7 | 47.6 | 47.6 | |
| 09:00 | EUR | Eurozone Services PMI Jan F | 48.4 | 48.4 | 48.4 | |
| 09:30 | EUR | Eurozone Sentix Investor Confidence Feb | -12.9 | -15 | -15.8 | |
| 09:30 | GBP | Services PMI Jan F | 54.3 | 53.8 | 53.8 | |
| 10:00 | EUR | Eurozone PPI M/M Dec | -0.80% | -0.80% | -0.30% | |
| 10:00 | EUR | Eurozone PPI Y/Y Dec | -10.60% | -10.50% | -8.80% | |
| 14:45 | USD | Services PMI Jan F | 52.9 | 52.9 | ||
| 15:00 | USD | ISM Services PMI Jan | 52.1 | 50.6 |
Euro Falls to Two-Month Low
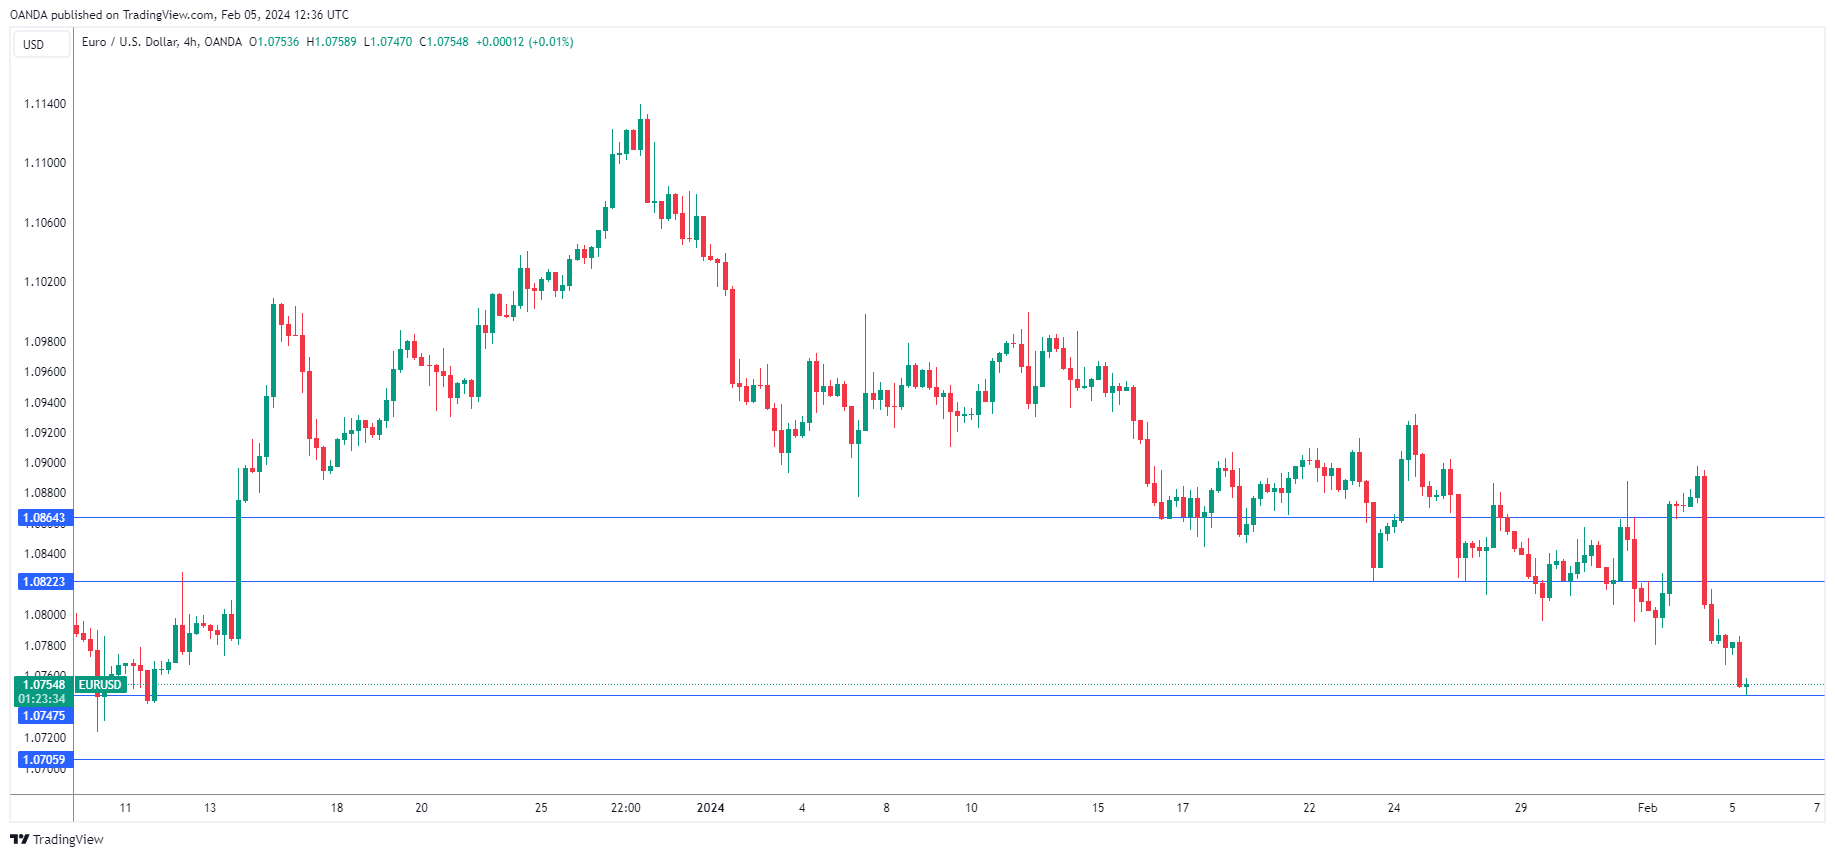
EUR/USD has extended its losses on Monday. In the European session, the euro is trading at 1.0749, down 0.34%. Earlier, the euro fell as low as 1.0747, its lowest level since December 11.
Red-hot nonfarm payrolls boosts US dollar
The US dollar ended the week with sharp gains against the major currencies, courtesy of a sizzling nonfarm payroll report of 353,000. This beat the upwardly revised December reading of 333,000 (up from 216,000) and blew past the market estimate of 180,000. Wage growth beat expectations with a 0.6% gain m/m, up from 0.4% in December and higher than the market estimate of 0.3%.
The employment report points to a robust labor market which is helping to drive economic growth but is also contributing to inflation. At last week’s meeting, Federal Reserve Chair Powell poured call water on hopes of a March rate cut and the massive nonfarm payrolls report and strong wage growth have effectively ruled out a rate cut in March. According to the CME FedWatch tool, the Fed rate odds of a rate cut in March have dropped to 20%, compared to 47% just one week ago. The odds of a May cut stand at 64%, rising to 95% in June.
The markets were exuberant when Powell jumped on the rate-cutting bandwagon in December, but that excitement has largely dissipated, as Powell will be in no rush to lower rates with the economy continuing to churn out strong numbers.
In Europe, eurozone and German services PMIs continue to point to contraction, a sign that the eurozone and German economies are struggling. The January services PMI came in at 48.4 for the eurozone and 47.7 for Germany, both of which were lower than in December.
EUR/USD Technical
- EUR/USD tested support at 1.0747 earlier. Below there is support at 1.0705
- There is resistance at 1.0822 and 1.0864
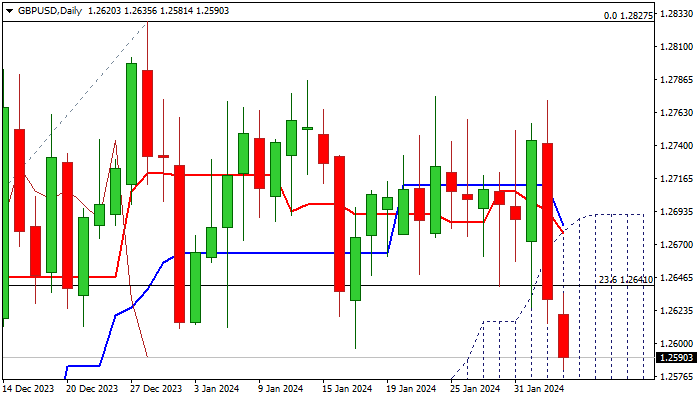
GBP/USD: Cable Falls Further as Solid US NFP Lift Dollar
Cable extends strong fall into second consecutive day, remaining under increased pressure from stronger dollar after upbeat US labor data and relatively hawkish comments from Fed Chair Powell.
Fresh extension lower on Monday cracked the floor of near-term range (1.2875/1.2596), with close below here to generate initial reversal signal, which will look for verification on extension through next pivots at 1.2561 (200DMA) and 1.2525 (Fibo 38.2% of 1.2037/1.2827 rally).
Weakening daily studies (Tenkan & Kijun-sen are in bearish configuration and 14-d momentum remains in negative territory) contribute to bearish fundamentals and keep in play risk of deeper pullback.
Broken Fibo 23.6% and 55DMA (1.2641/61 respectively) turned to resistances, guarding upper pivot at 1.2680 (top of thick daily Ichimoku cloud, reinforced by falling Tenkan-sen).
Res: 1.2641; 1.2661; 1.2680; 1.2747.
Sup: 1.2561; 1.2525; 1.2468; 1.2432.
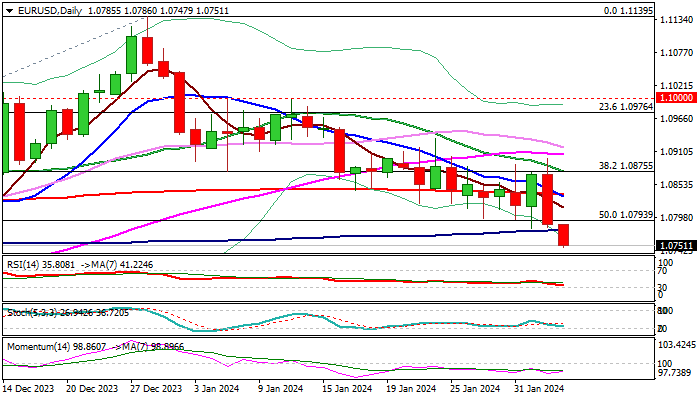
EUR/USD: Bears Tighten Grip After Break of Another Strong Support
EURUSD remains firmly in red and hits two-month low on Monday morning, in extension of Friday’s 0.8% drop (the biggest daily loss since Jan 2).
Fresh weakness broke through significant support at 1.0776 (100DMA) increasing pressure on next pivotal supports at 1.0723/12 (Dec 8 higher low / Fibo 61.8% of 1.0448/1.1139 rally), violation of which to open way for further losses.
Daily studies turned to full bearish setup, with formation of a double death-cross (5/200 and 10/200DMA’s) generating fresh bearish signals and adding to negative near-term outlook.
Broken 100DMA and Fibo 50% (1.0775/93) reverted to resistances which should ideally keep the upside protected, though larger bearish structure will remain unharmed if extended upticks stay below the base of thick daily cloud (1.0828).
Res: 1.0775; 1.0793; 1.0828; 1.0875.
Sup: 1.0723; 1.0712; 1.0660; 1.0611.
BTCUSD Found Buyers At The Equal Legs Area
Hello fellow traders. In this technical article we’re going to take a look at the Elliott Wave charts charts of BTCUSD published in members area of the website. As our members know Bitcoin has given us 3 waves pull back recently that found buyers right at the equal legs area. We have been favoring the long side due to impulsive bullish sequences the crypto is showing. In further text we’re going to explain the short term Elliott Wave forecast.
BTCUSD Elliott Wave 1 Hour Chart 01.31.2024
Current view suggests Bitcoin ended cycle from the 38518.29 low as wave 1 red. We got 5 waves up in the rally from the mentioned low. Currently the crypto is doing intraday pull back, wave 2 red. Correction looks incomplete at the moment. We expect to see another leg down ((c)) of 2 to complete the structure.
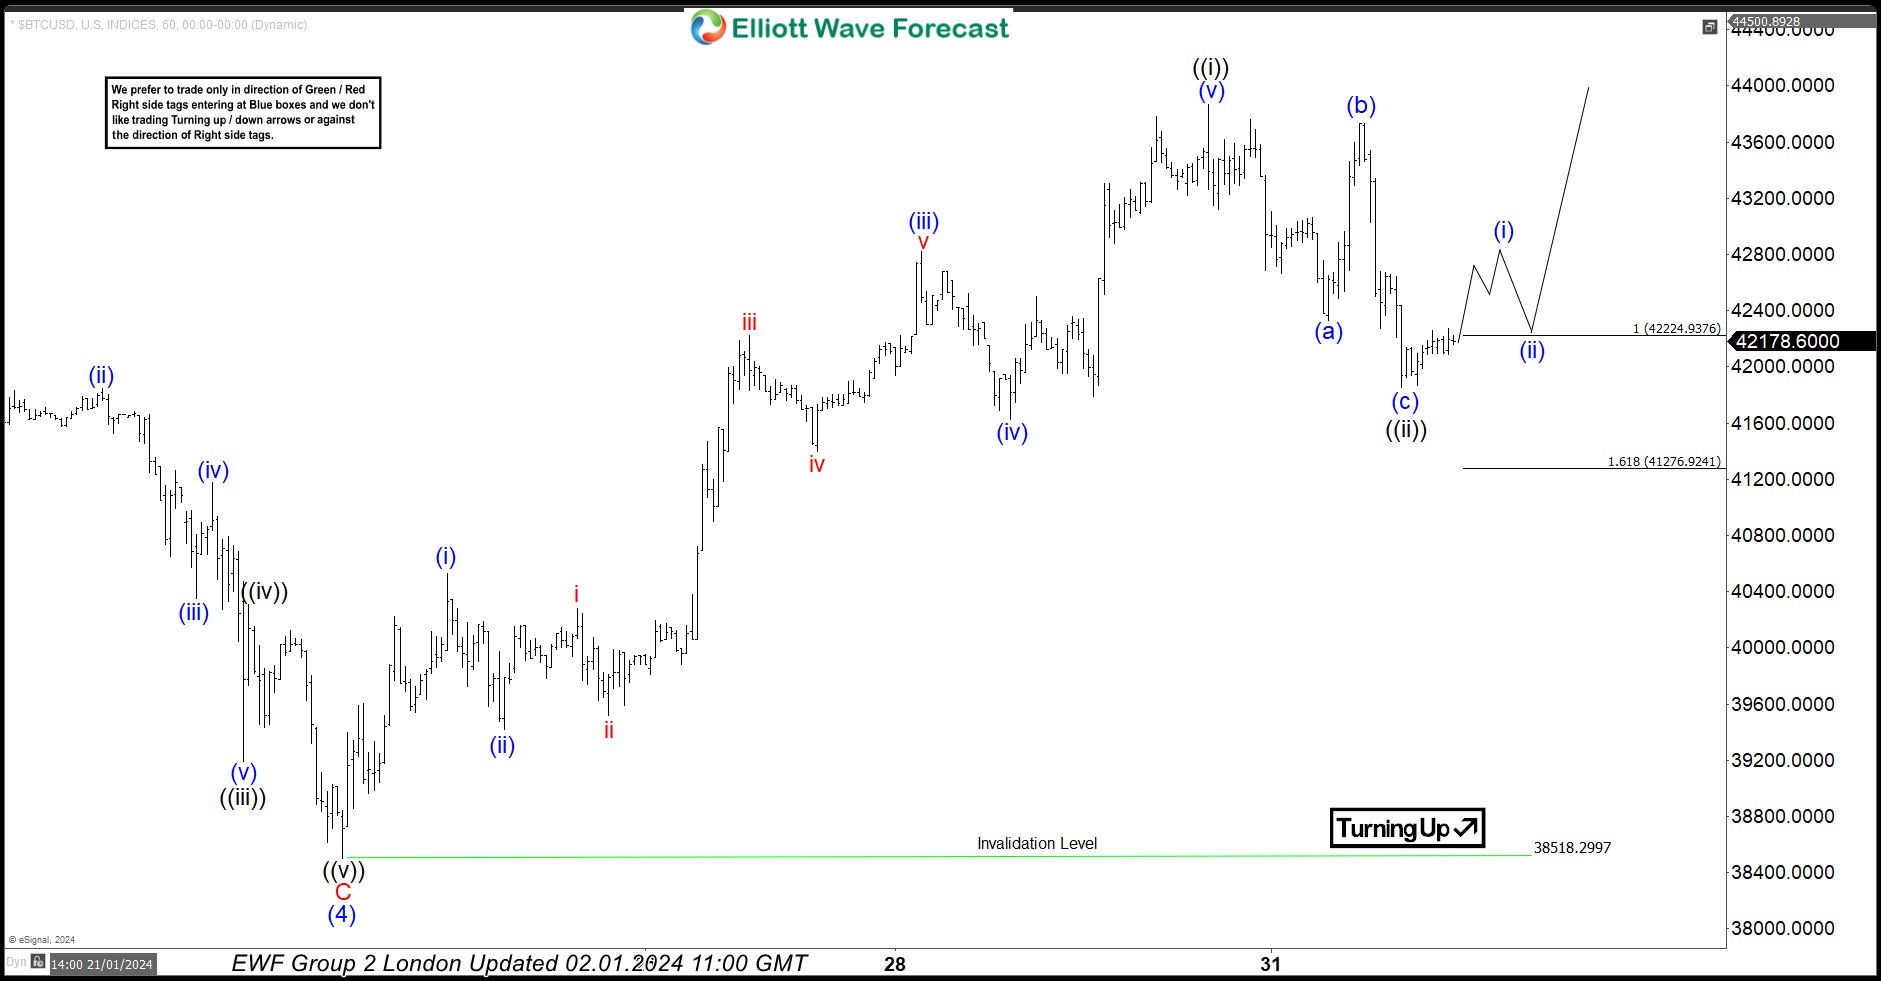
BTCUSD Elliott Wave 1 Hour Chart 02.01.2024
Pull back made another leg down and reached equal legs area at 42224.93-41276.92. We expect buyers to appear for further rally or 3 waves bounce at least. Don’t recommend selling and prefer the long side.BTCUSD
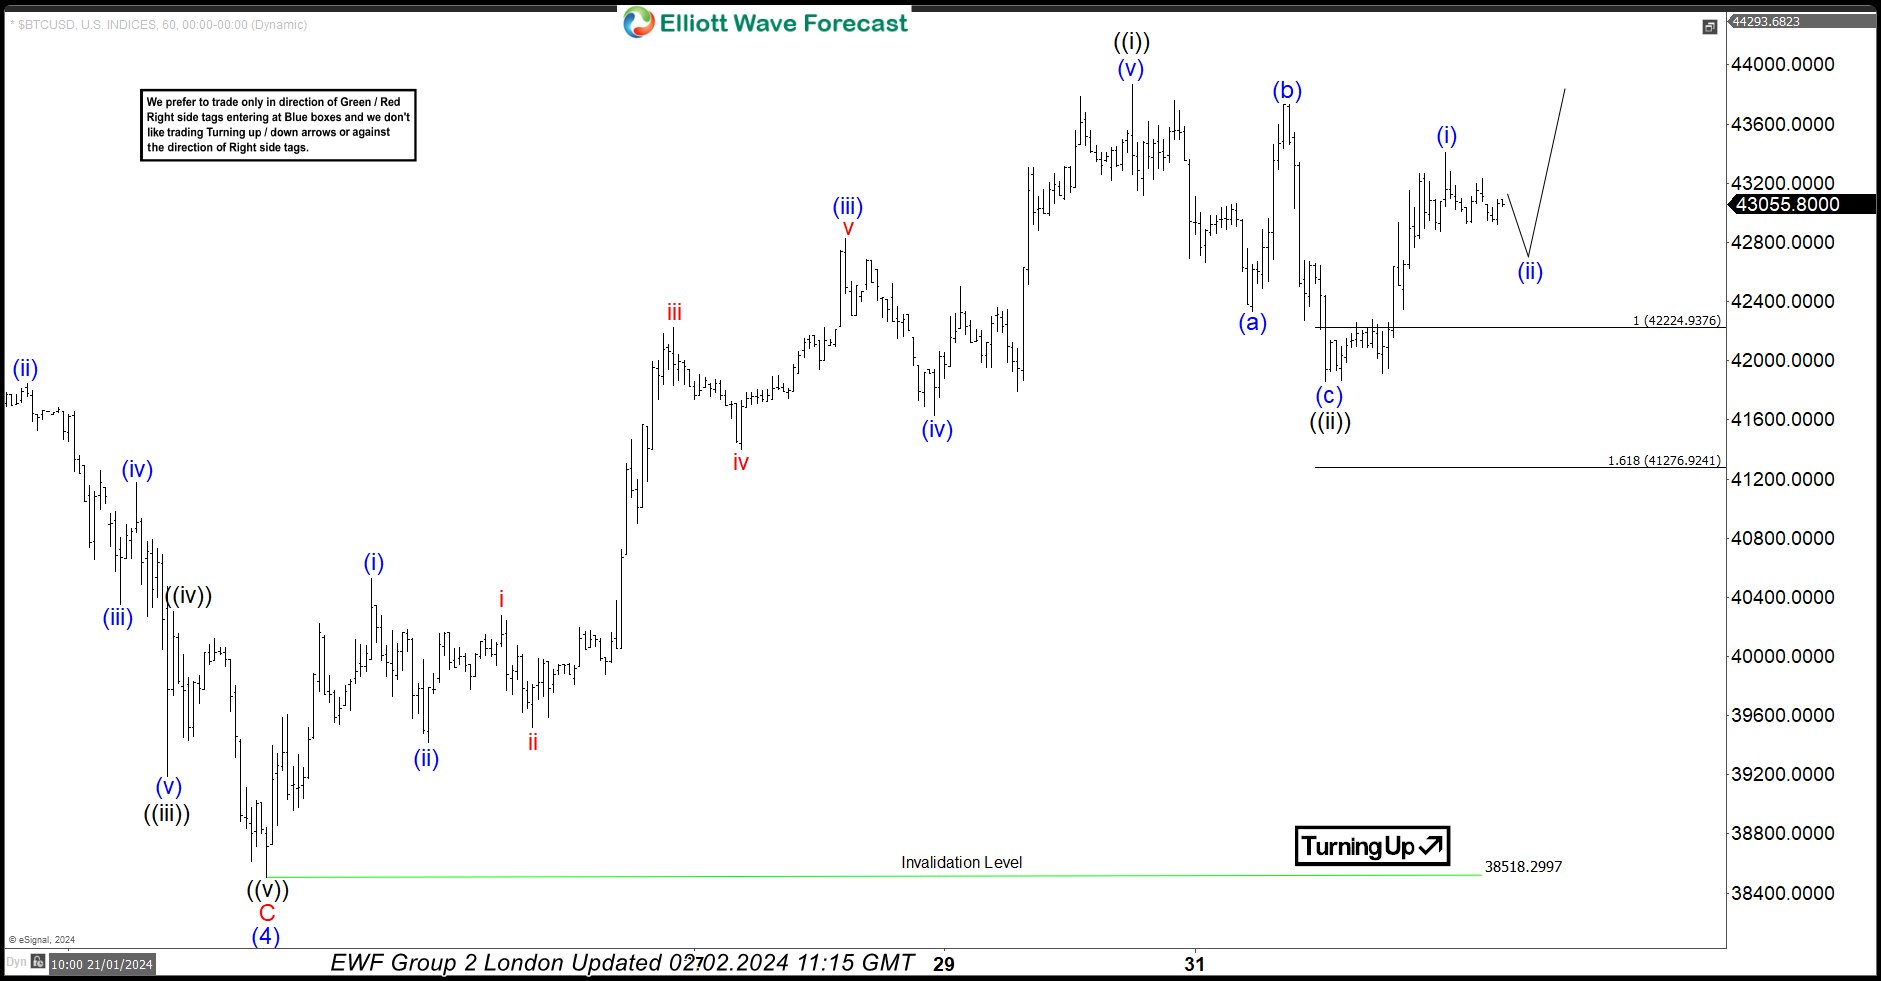
BTCUSD found buyers at the marked equal legs area as expected and we got good reaction from there. We count pull back completed at 41873 low. Short term rally made 5 waves up from the low, and now we are getting 3 waves pull back in (ii) blue. We don’t recommend selling in any proposed pull back. The price should ideally hold above 41873 low to keep proposed view intact. We would like to see break above ((i)) black peak 43851 to confirm next leg up is in progress.