Sample Category Title
Technical Outlook and Review
DXY:
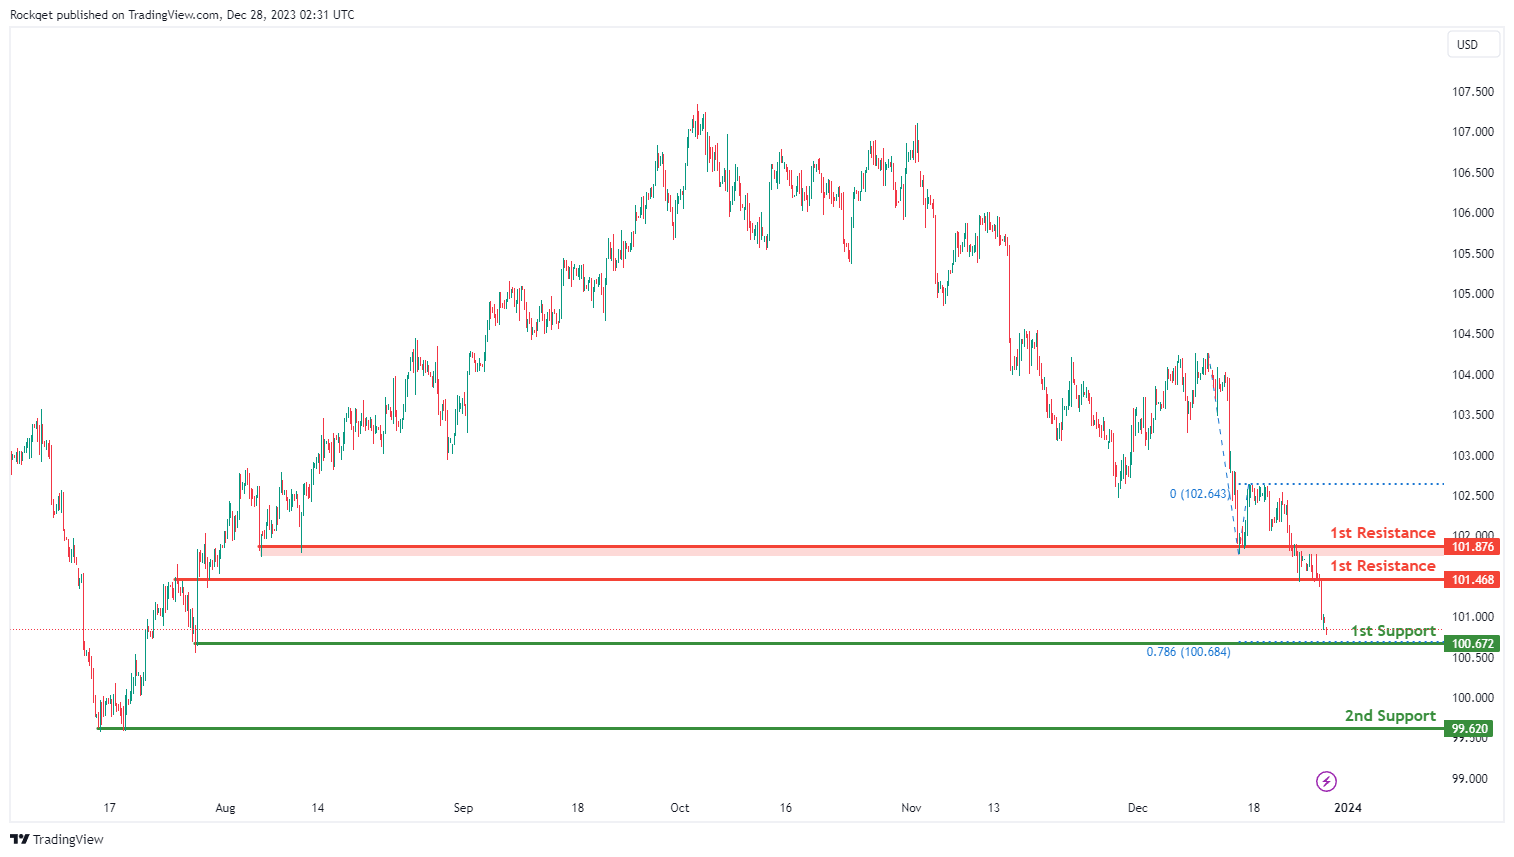
The DXY (US Dollar Index) chart currently shows an overall bearish momentum, indicating a potential for price to make a bearish continuation towards the 1st support.
The 1st support level at 100.67 is identified as a swing-low support that aligns with the 78.60% Fibonacci projection level. Further below, the 2nd support level at 99.62 is noted as pullback support, further reinforcing its importance as a potential key support level.
To the upside, the 1st resistance level at 101.46 is identified as an overlap resistance. Higher up, the 2nd resistance level at 101.87 is also marked as an overlap resistance, suggesting a potential barrier for further upside movement.
EUR/USD:
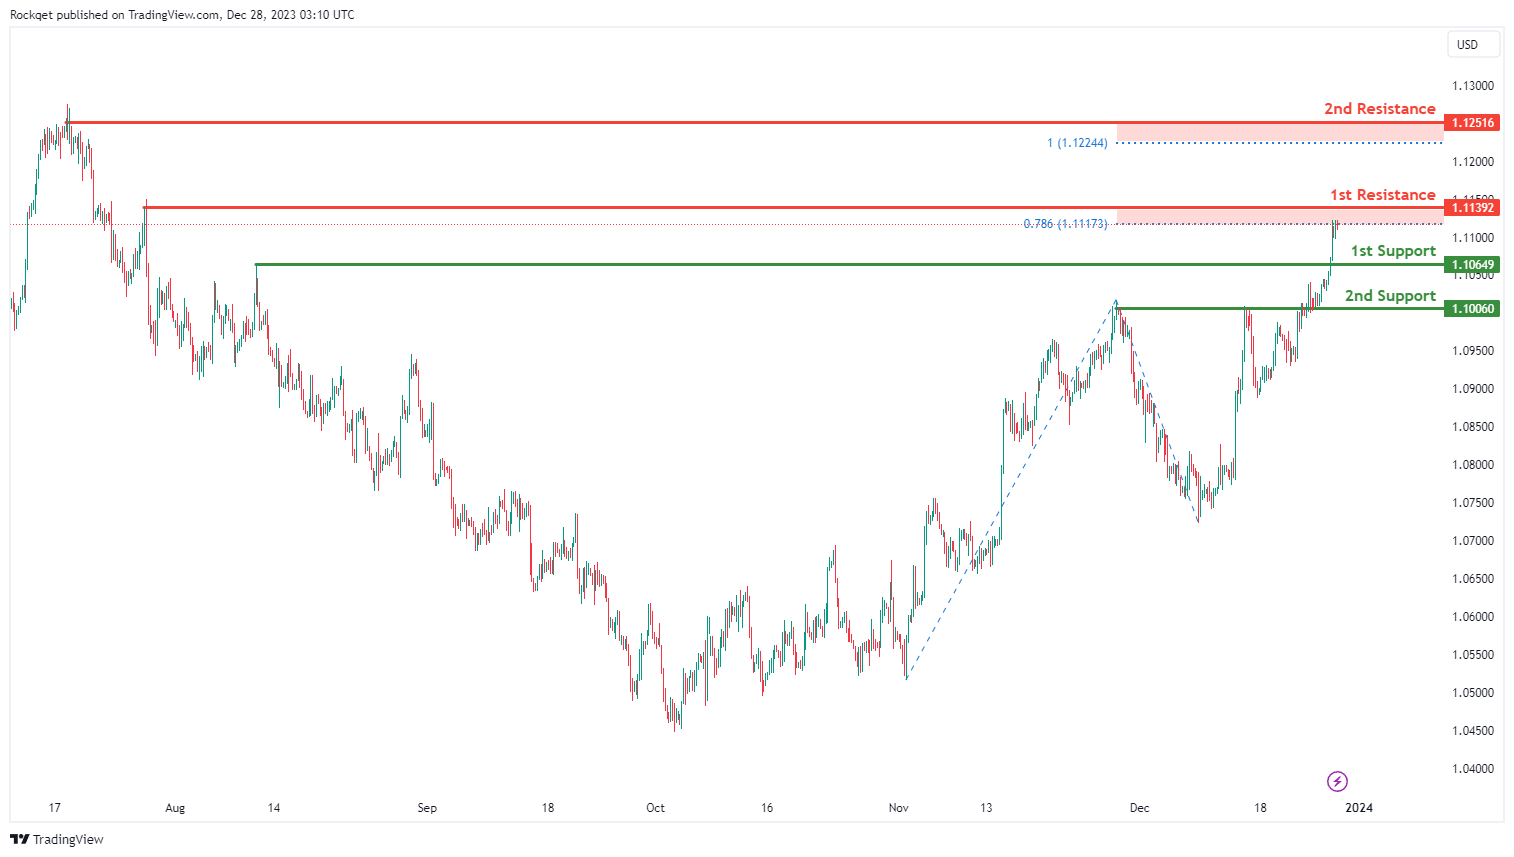
The EUR/USD chart currently exhibits an overall bullish momentum. In this context, there is a potential scenario for price to make a bullish continuation towards the 1st resistance.
The 1st resistance level at 1.1139 is identified as a swing-high resistance that aligns close to the 78.60% Fibonacci projection level. Higher up, the 2nd resistance level at 1.1251 is also noted as a swing-high resistance that aligns close to the 100.00% Fibonacci projection level, suggesting a potential barrier for further upside movement.
To the downside, the 1st support level at 1.1064 is identified as a pullback support. Further below, the 2nd support level at 1.1006 is marked as an overlap support, further reinforcing its importance as a potential key support level.
EUR/JPY:
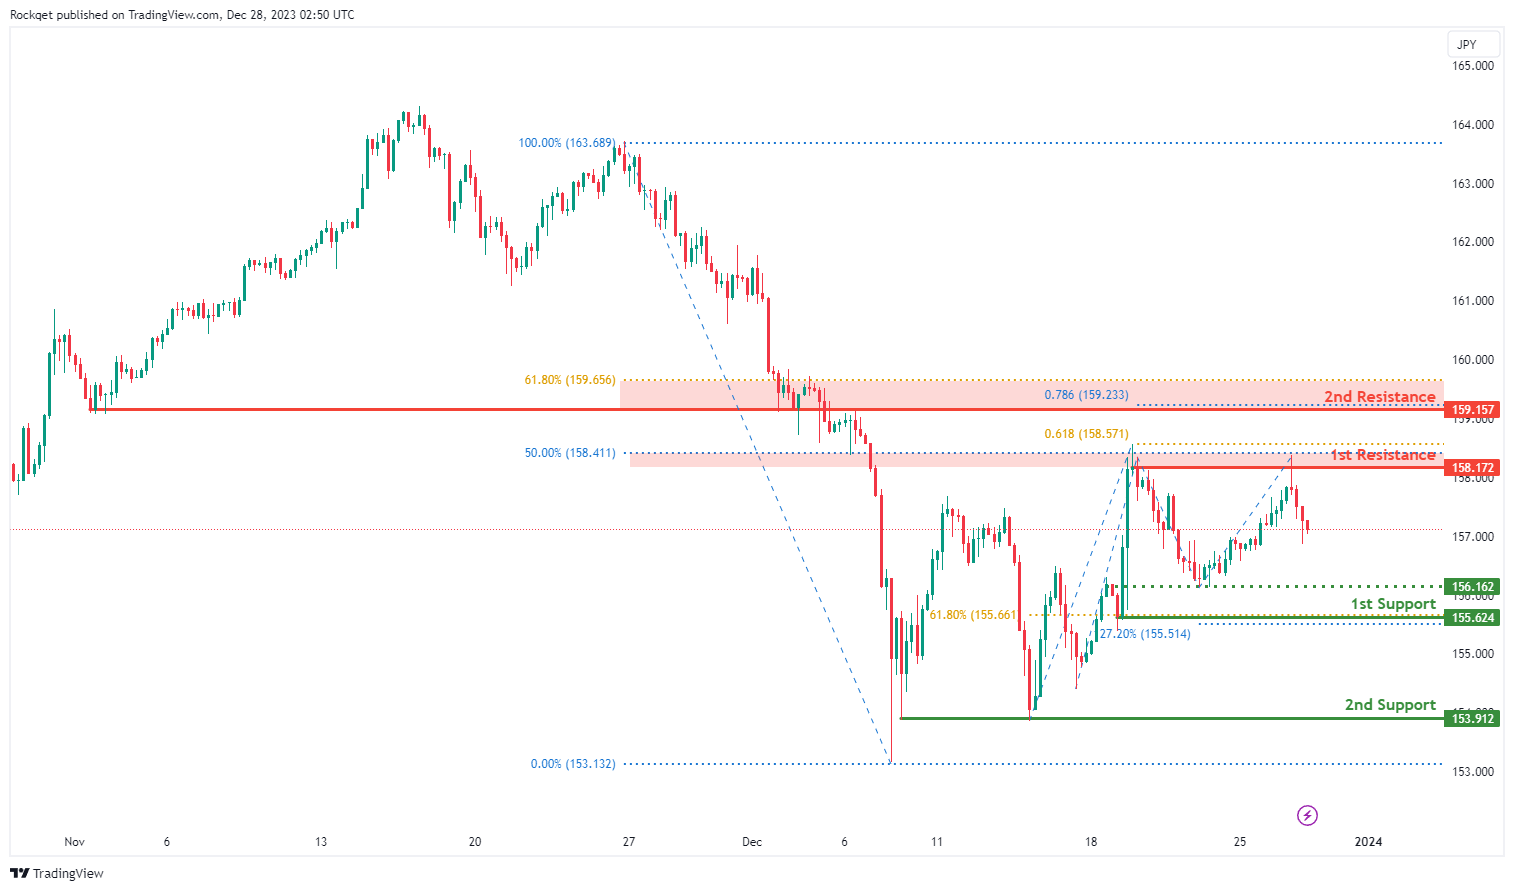
The EUR/JPY chart currently exhibits a bearish overall momentum, indicating a potential scenario for a bearish continuation towards the 1st support.
The 1st support at 155.62 is considered significant as it represents a pullback support and is associated with the 61.80% Fibonacci Retracement and the -27% Fibonacci Expansion. This level indicates a historical area where buying interest has been present.
Additionally, the 2nd support at 153.91 is identified as a multi-swing low support, providing an additional layer of potential support for the currency pair.
The intermediate support at 156.62 is marked as an overlap support.
On the resistance side, the 1st resistance at 158.17 is marked as a swing high resistance and is associated with the 61.80% Fibonacci Projection. This represents a level where selling interest could intensify.
Furthermore, the 2nd resistance at 159.16 is identified as an overlap resistance and is associated with the 61.80% Fibonacci Retracement and the 78.60% Fibonacci Projection, presenting potential barriers for upward movement.
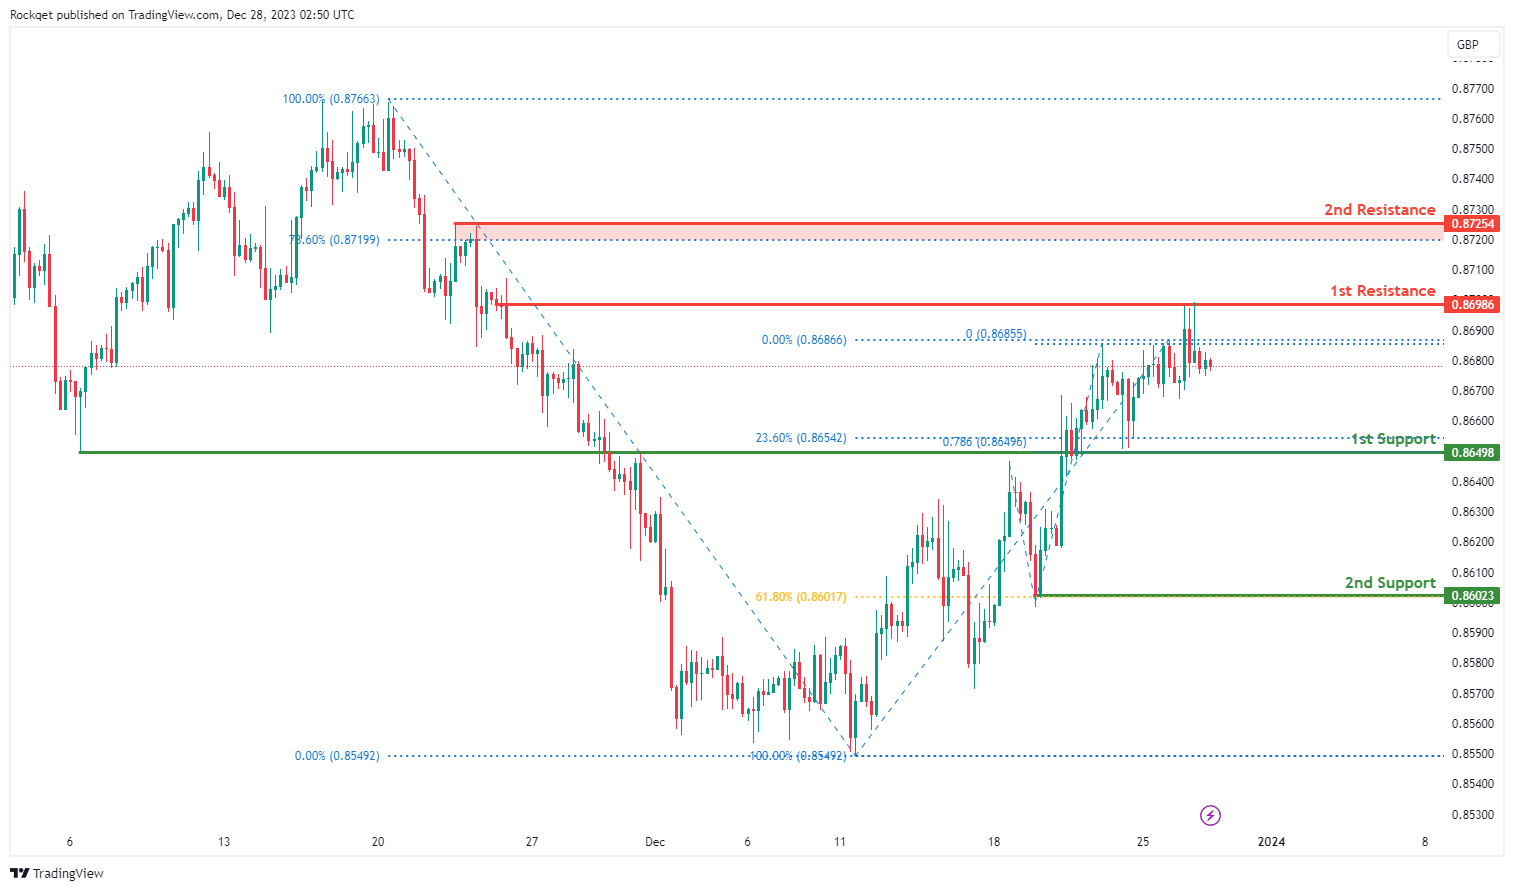
EUR/GBP:
The EUR/GBP chart currently exhibits a bearish overall momentum, indicating a potential scenario for a bearish continuation towards the 1st support.
The 1st support at 0.8650 is considered significant as it represents an overlap support and is associated with the 23.60% Fibonacci Retracement and the 78.60% Fibonacci Projection. This level indicates a historical area where buying interest has been present.
Additionally, the 2nd support at 0.8602 is identified as a pullback support and is associated with the 61.80% Fibonacci Retracement, providing an additional layer of potential support for the currency pair.
On the resistance side, the 1st resistance at 0.8689 is marked as an overlap resistance, representing a level where selling interest could intensify.
Furthermore, the 2nd resistance at 0.8725 is identified as a pullback resistance and is associated with the 78.60% Fibonacci Retracement, presenting potential barriers for upward movement.
GBP/USD:
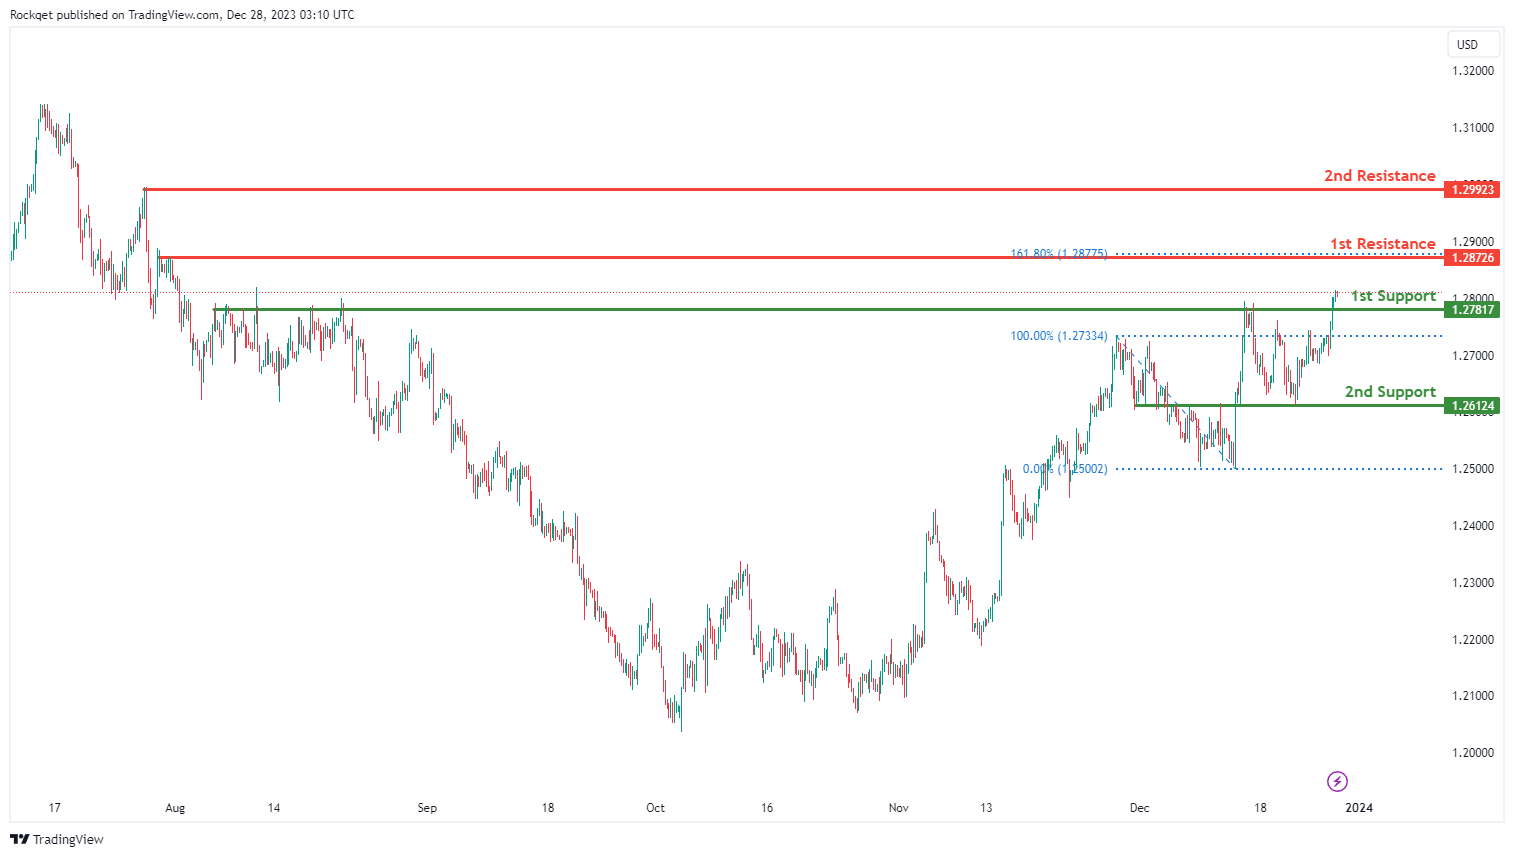
The GBP/USD chart currently exhibits an overall bullish momentum. In this context, there is a potential scenario for price to make a bullish continuation towards the 1st resistance.
The 1st resistance level at 1.2872 is identified as a pullback resistance that aligns with the 161.80% Fibonacci extension level. Higher up, the 2nd resistance level at 1.2992 is noted as a swing-high resistance, suggesting a potential barrier for further upside movement.
To the downside, the 1st support level at 1.2781 is identified as a pullback support. Further below, the 2nd support level at 1.2612 is marked as an overlap support, further reinforcing its importance as a potential key support level.
GBP/JPY:
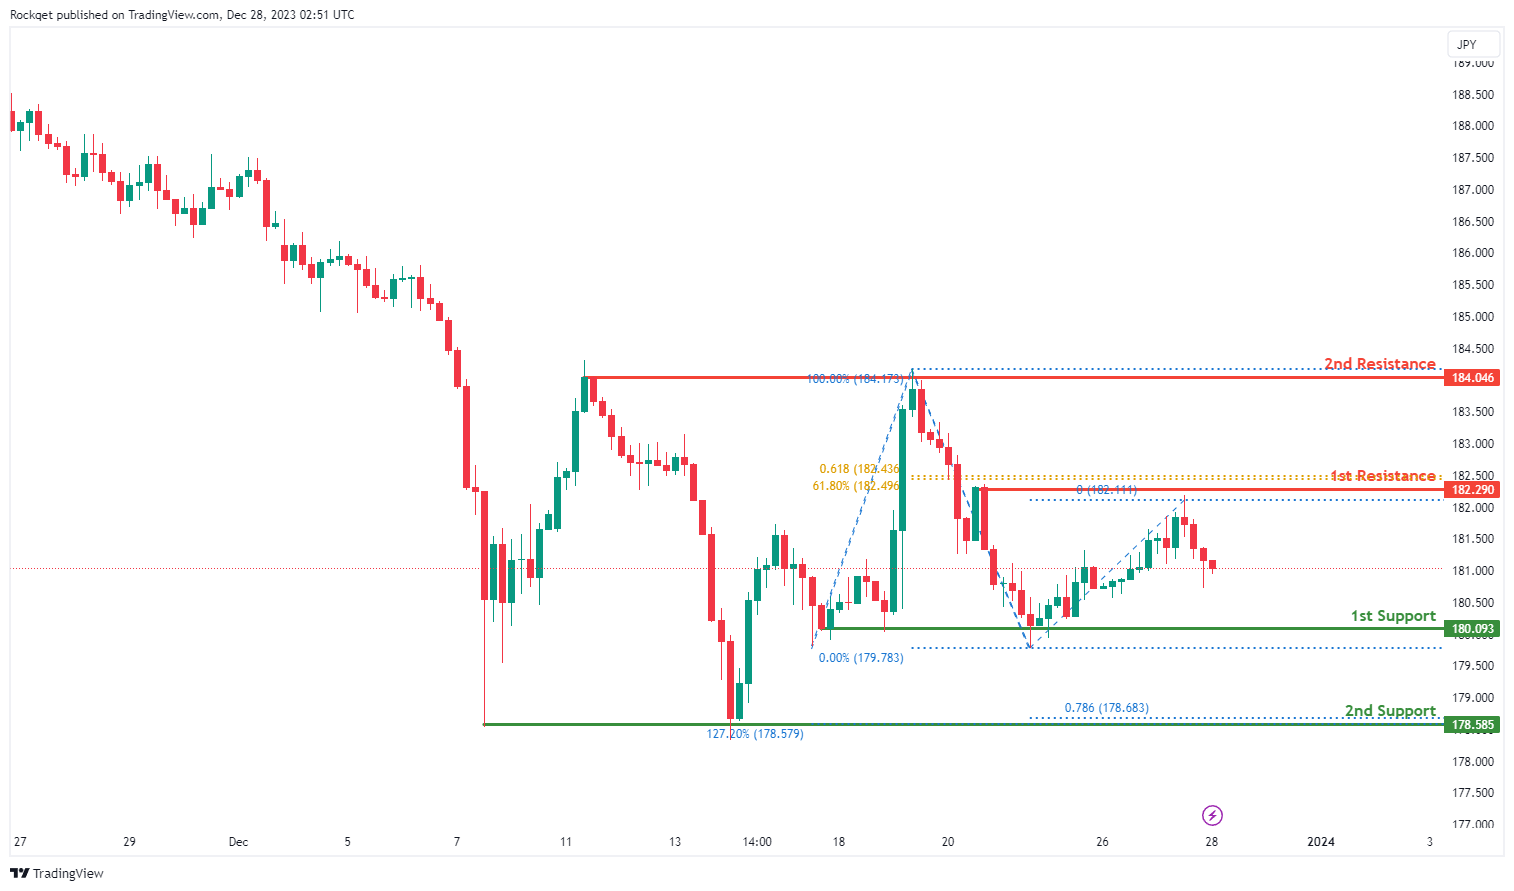
The GBP/JPY chart currently demonstrates a bearish overall momentum, indicating a potential scenario for a bearish continuation towards the 1st support.
The 1st support at 180.09 is deemed significant as it represents a multi-swing low support, suggesting a historical area where buying interest has been notable.
Additionally, the 2nd support at 178.59 is identified as a multi-swing low support and is associated with the 127.20% Fibonacci Extension and the 78.60% Fibonacci Projection, adding layers of potential support for the currency pair.
On the resistance side, the 1st resistance at 182.29 is marked as a pullback resistance and is associated with the 61.80% Fibonacci Projection, presenting a level where selling interest could intensify.
Furthermore, the 2nd resistance at 184.05 is noted as a multi-swing high resistance, indicating a historical area where selling interest has been prevalent.
USD/CHF:
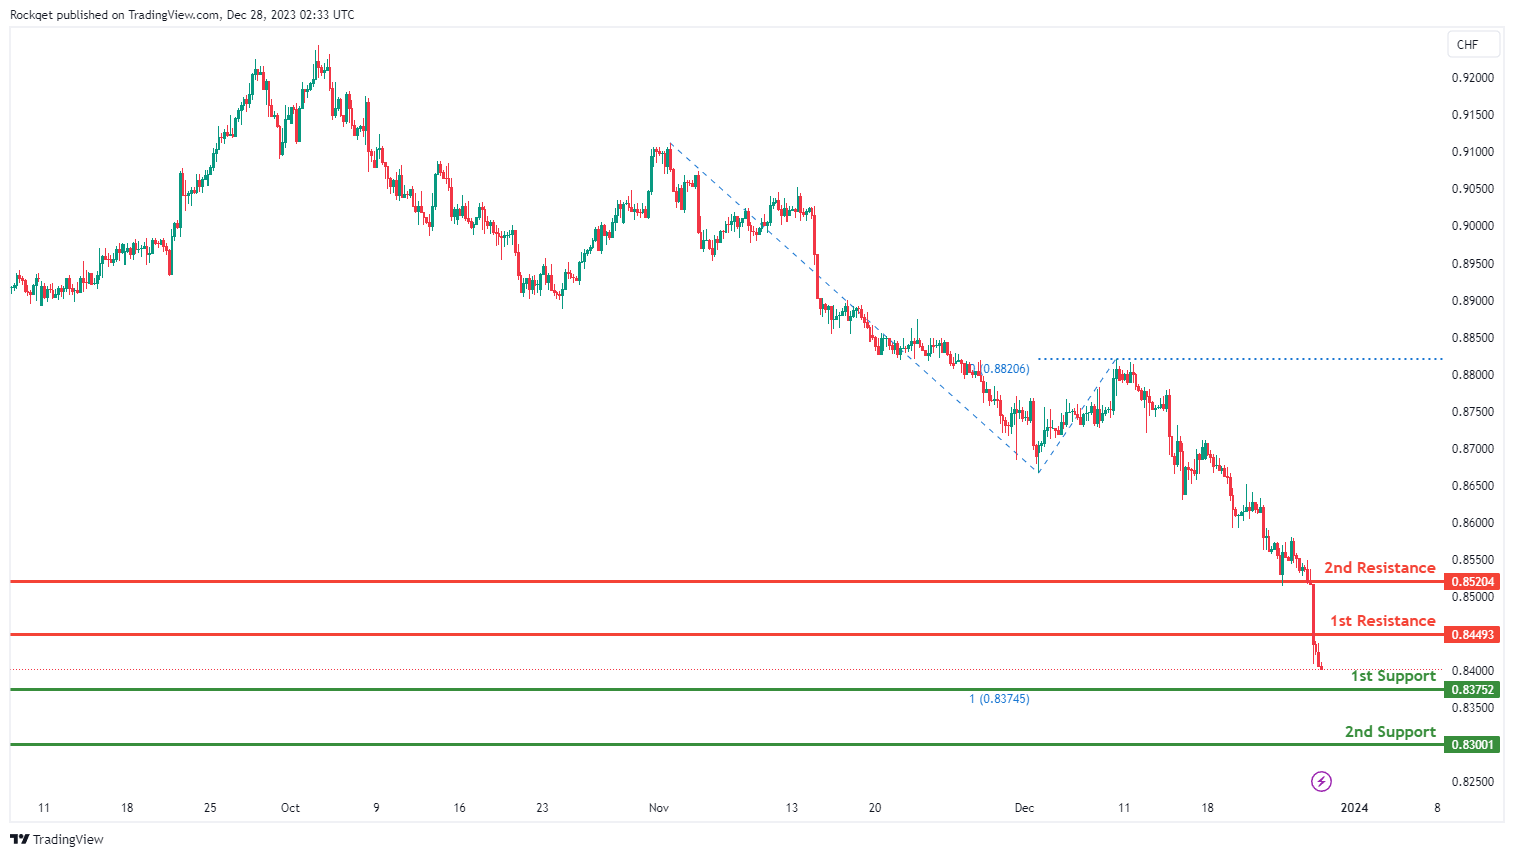
The USD/CHF chart currently exhibits an overall bearish momentum. In this context, there is a potential scenario for price to make a bearish continuation towards the 1st support.
The 1st support level at 0.8375 is identified as a multi-swing-low support that aligns with the 100.00% Fibonacci projection level. Further below, the 2nd support level at 0.8300 is noted as a swing-low support, further reinforcing its importance as a key support level.
To the upside, the 1st resistance level at 0.8449 is identified as a pullback resistance. Higher up, the 2nd resistance level at 0.8520 is also also marked as a pullback resistance, suggesting a potential barrier for further upside movement.
USD/JPY:
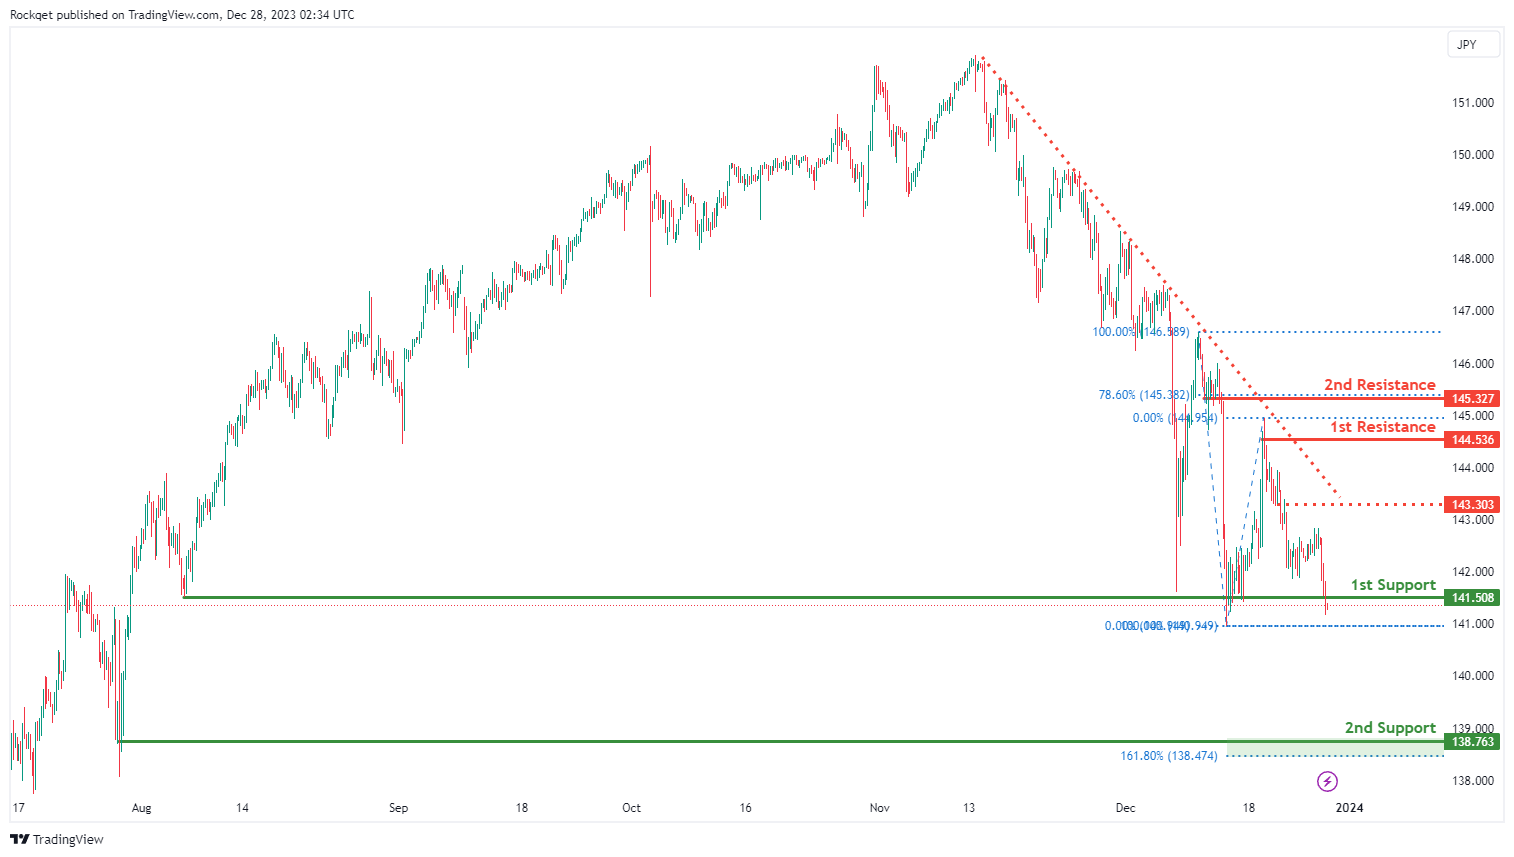
The USD/JPY chart currently exhibits an overall bearish momentum. In this context, there is a potential for price to break under the 1st support and drop towards the 2nd support.
The 1st support level at 141.50 is identified as a multi-swing-low support. Further below, the 2nd support level at 138.76 is noted as a swing-low support that aligns close to the 161.80% Fibonacci extension level, further reinforcing its importance as a key support level.
To the upside, the intermediate resistance level at 143.30 is identified as a pullback resistance while the 1st resistance level at 144.53 is noted as a swing-high resistance. Higher up, the 2nd resistance level at 145.32 is marked as a pullback resistance that aligns with the 78.60% Fibonacci retracement level, suggesting a potential barrier for further upside movement.
USD/CAD:
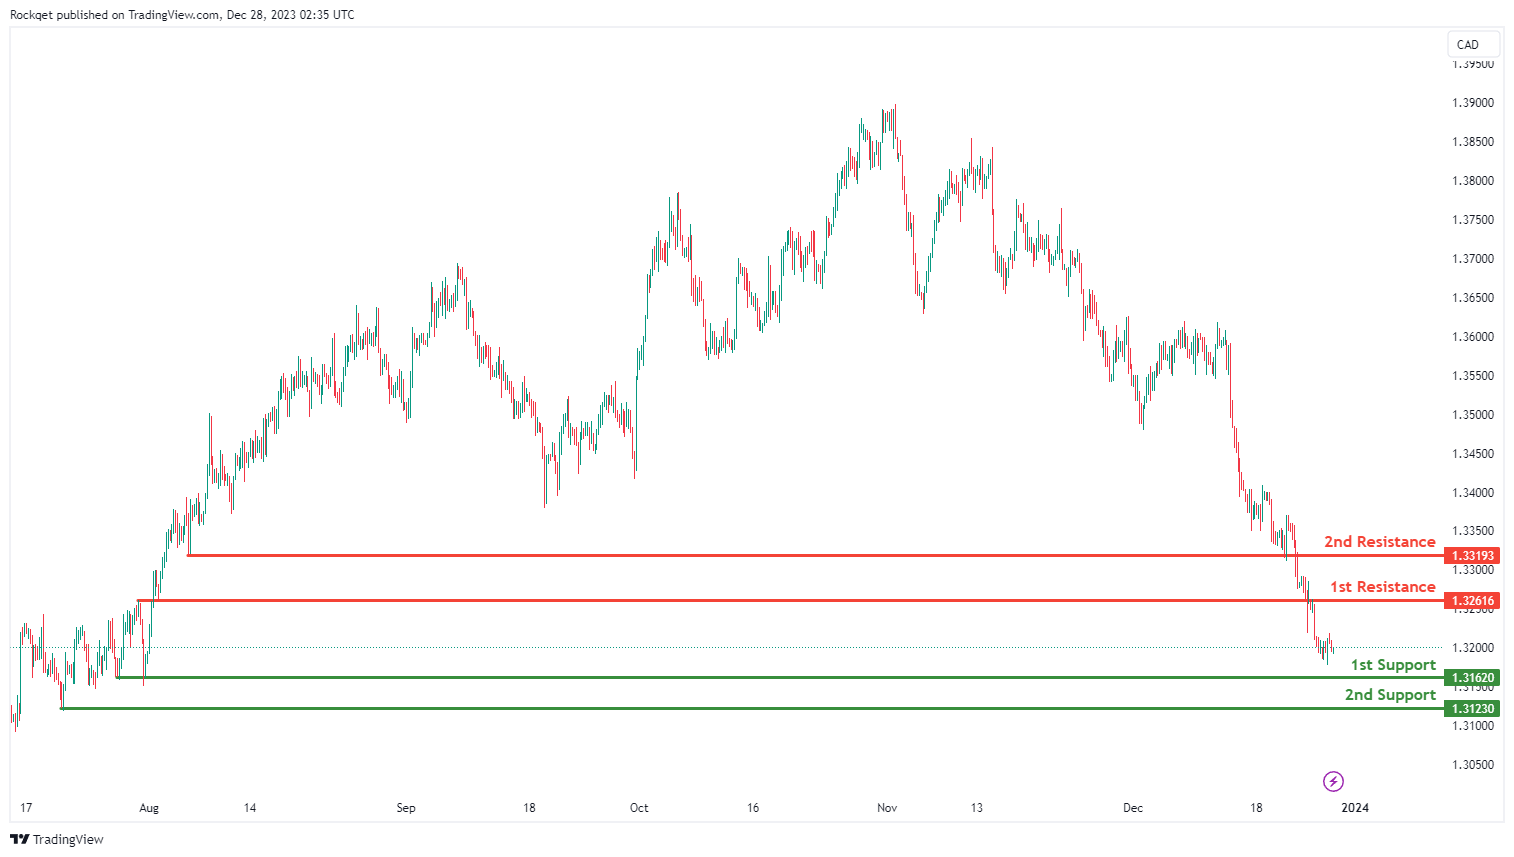
The USD/CAD chart currently exhibits an overall bearish momentum. In this context, there is a potential scenario for price to make a bearish continuation towards the 1st support.
The 1st support level at 1.3162 is identified as a multi-swing-low support. Further below, the 2nd support level at 1.3123 is noted as a swing-low support, further reinforcing its importance as a key support level.
To the upside, the 1st resistance level at 1.3261 is identified as an overlap resistance. Higher up, the 2nd resistance level at 1.3319 is marked as a pullback resistance, suggesting a potential barrier for further upside movement.
AUD/USD:
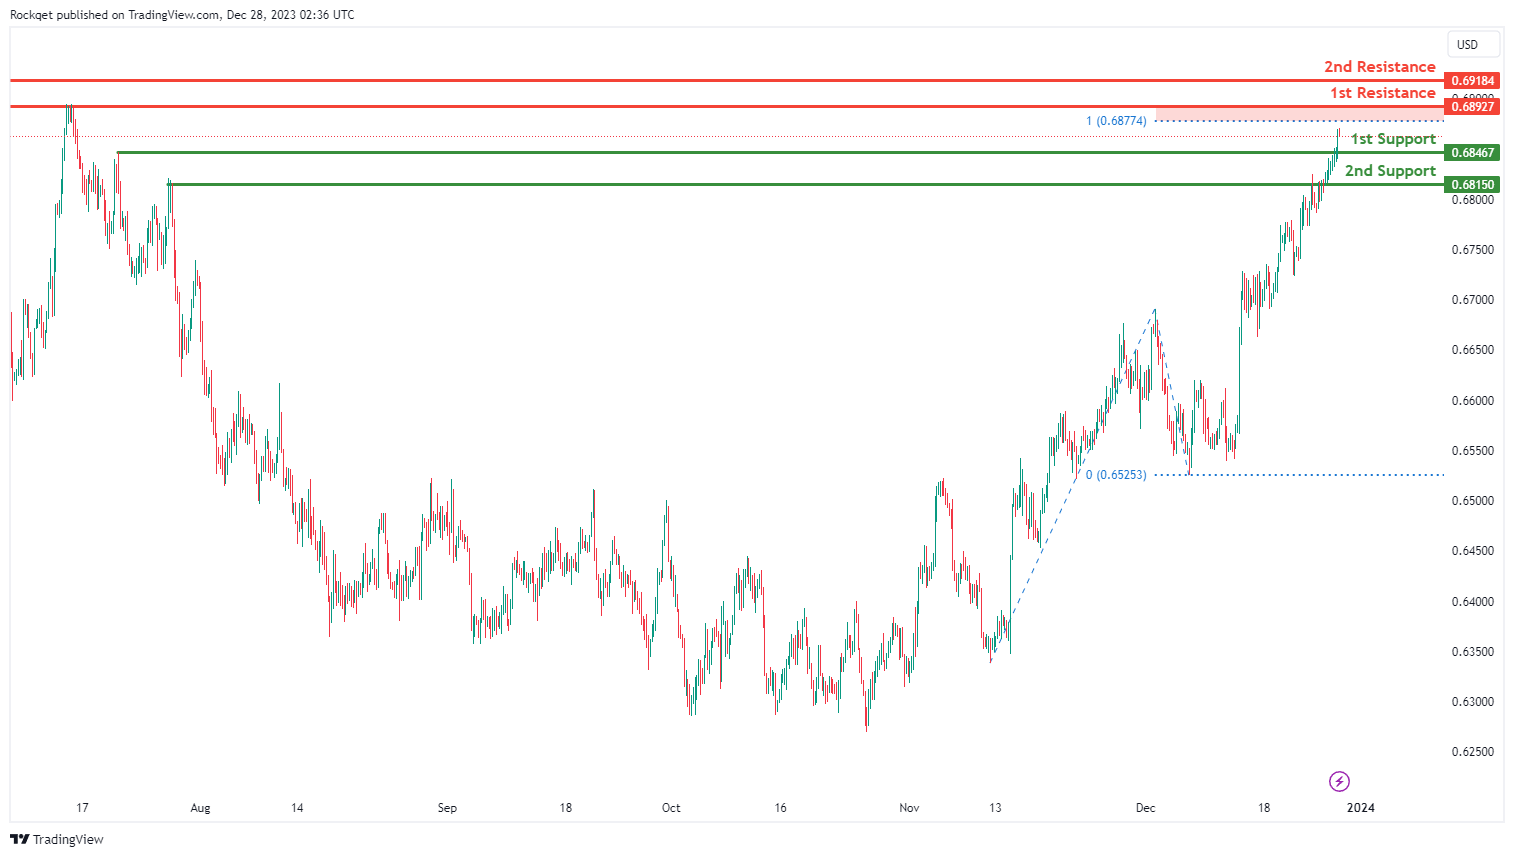
The AUD/USD chart currently exhibits an overall bullish momentum. In this context, there is a potential scenario for price to make a bullish continuation towards the 1st resistance.
The 1st resistance level at 0.6892 is identified as a multi-swing-high resistance that aligns close to the 100.00% Fibonacci projection level. Higher up, the 2nd resistance level at 0.6918 is noted as a swing-high resistance, indicating its potential significance as a barrier for further upward movement.
To the downside, the 1st support level at 0.6846 is identified as a pullback support. Further below, the 2nd support level at 0.6815 is marked as an overlap support, further reinforcing its importance as a key support level.
NZD/USD
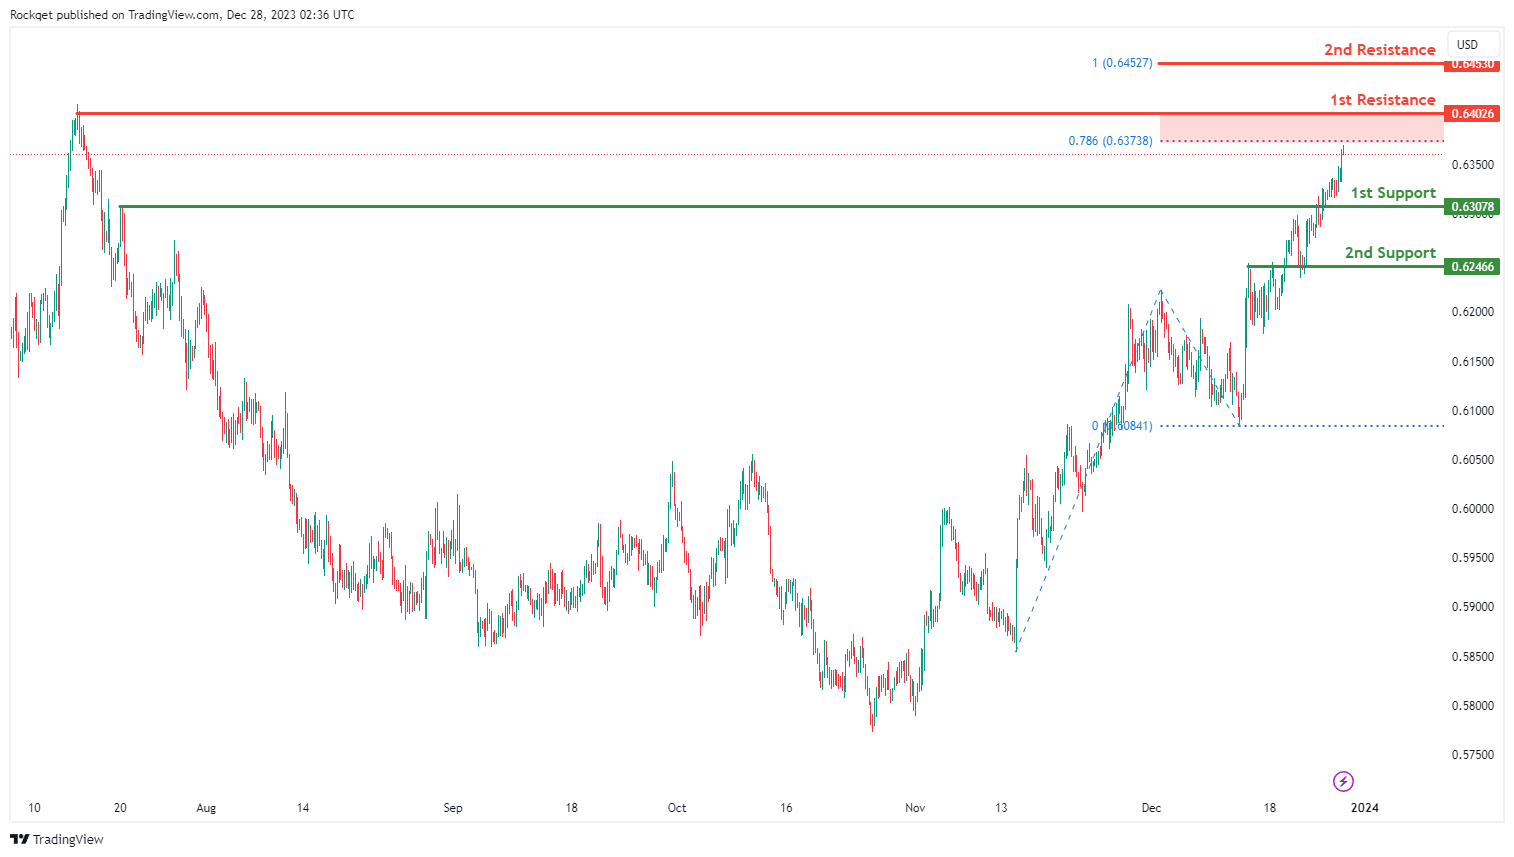
The NZD/USD chart currently exhibits an overall bullish momentum. In this context, there is a potential scenario for price to make a bullish continuation towards the 1st resistance.
The 1st resistance level at 0.6402 is identified as a swing-high resistance. Higher up, the 2nd resistance level at 0.6453 is marked as a resistance that aligns with the 100.00% Fibonacci projection level, indicating its potential significance as a barrier for further upward movement.
To the downside, the 1st support level at 0.6307 is identified as an overlap support. Further below, the 2nd support level at 0.6246 is also noted as an overlap support, further reinforcing its importance as a key support level.
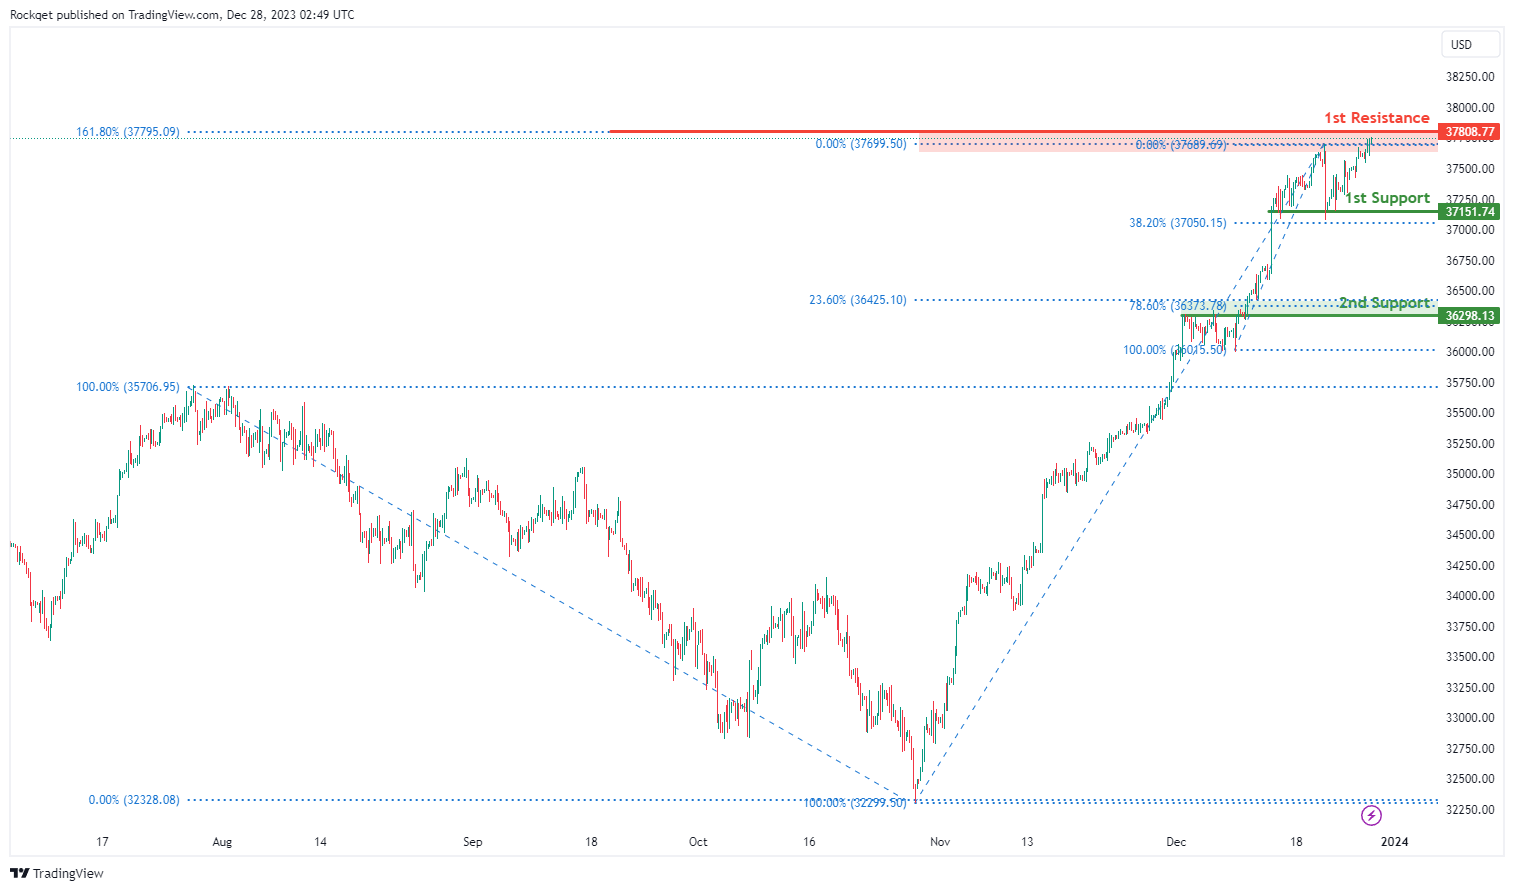
DJ30:
The DJ30 chart currently exhibits a bullish overall momentum, suggesting a potential scenario for a bullish continuation towards the 1st resistance.
The 1st support at 37151.74 is considered significant as it represents an overlap support and is associated with the 38.20% Fibonacci Retracement, indicating a historical area where buying interest has been present.
Additionally, the 2nd support at 36298.13 is identified as another overlap support and is associated with the 23.60% Fibonacci Retracement and the 78.60% Fibonacci Retracement, providing multiple layers of potential support for the index.
On the resistance side, the 1st resistance at 37808.77 is deemed significant as it is linked to the 161.80% Fibonacci Extension, indicating a level where selling interest could intensify.
GER40:
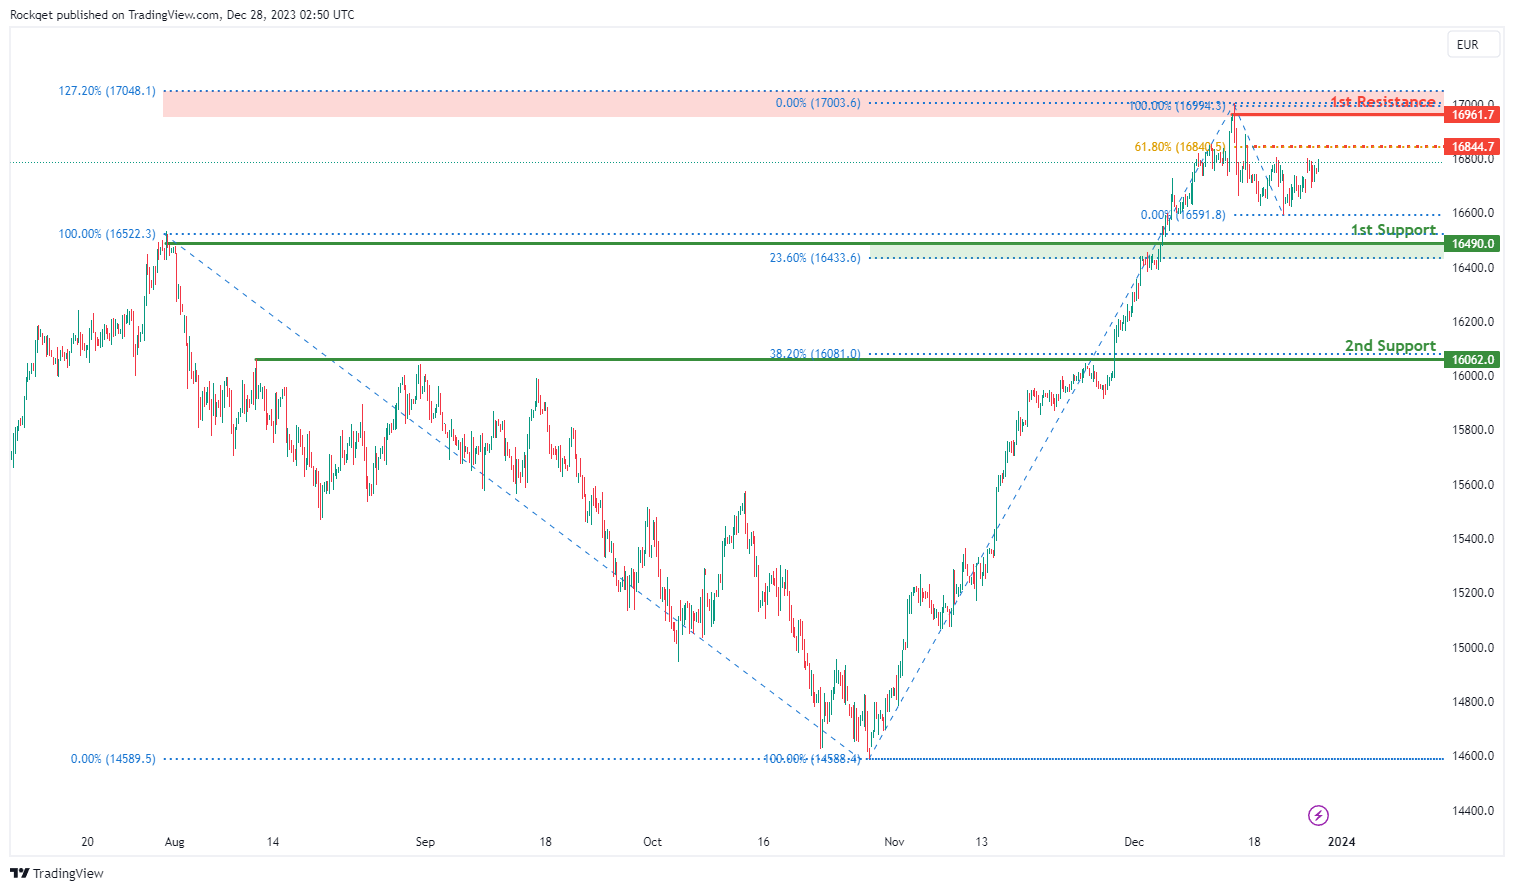
The GER40 chart currently exhibits a bullish overall momentum, contributing to the potential for a bullish continuation towards the 1st resistance.
The 1st support at 16490.00 is considered significant as it represents an overlap support and is associated with the 23.60% Fibonacci Retracement, indicating a historical area where buying interest has been present.
Furthermore, the 2nd support at 16062.00 is identified as another significant level, characterized as a pullback support and associated with the 38.20% Fibonacci Retracement, providing additional layers of potential support for the index.
On the resistance side, the 1st resistance at 16961.70 is considered significant as it is linked to a swing high resistance and the 127.20% Fibonacci Extension, indicating a level where selling interest could intensify.
Additionally, the intermediate resistance at 16844.70 is associated with a pullback resistance and the 61.80% Fibonacci Retracement, adding an extra layer of potential resistance for the index.
US500:
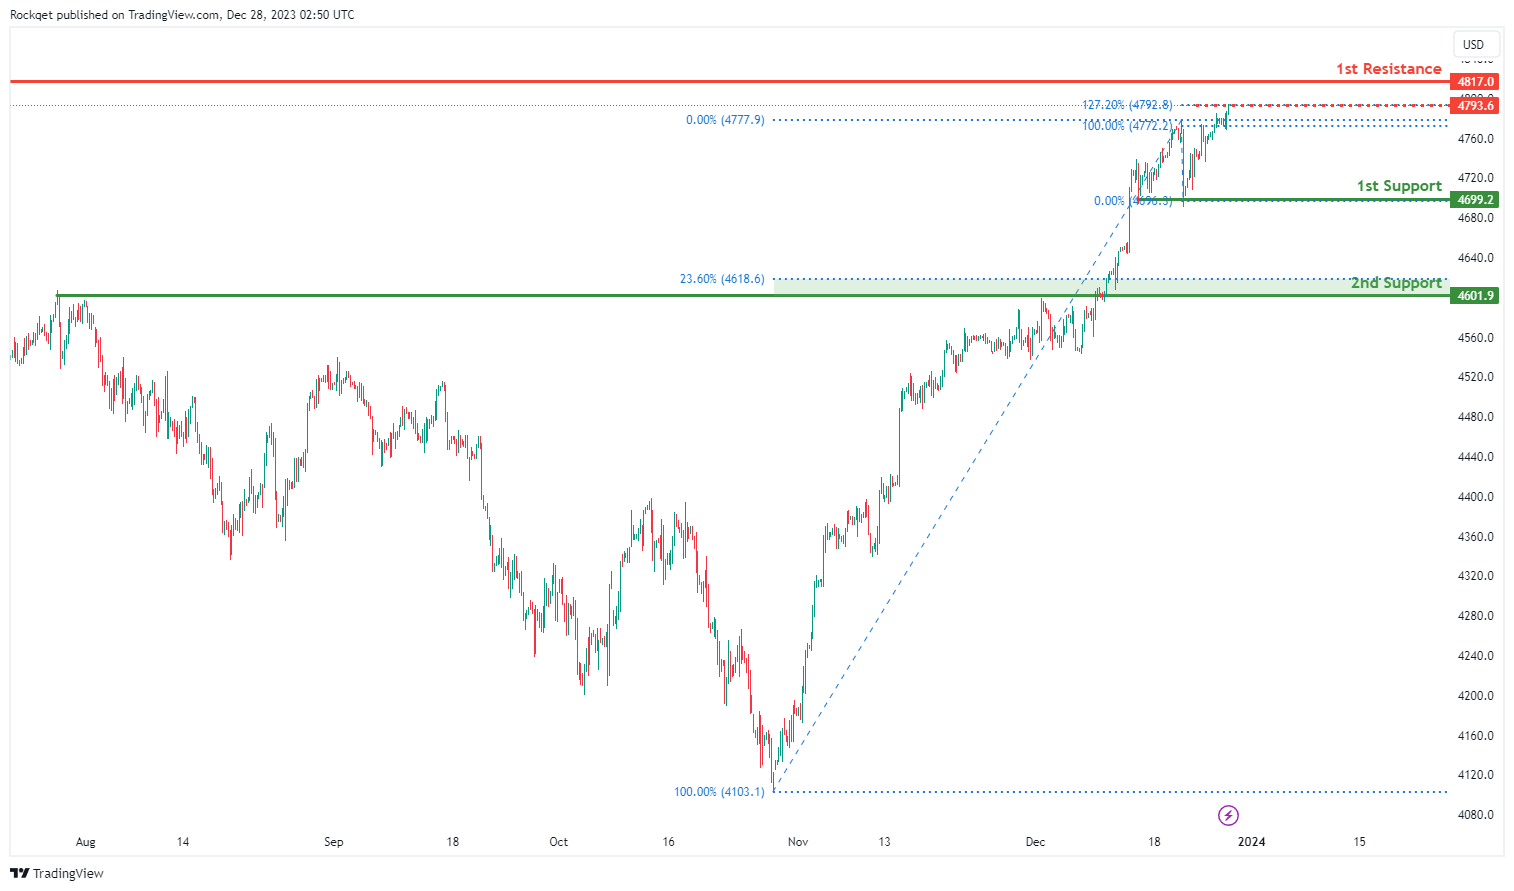
The US500 chart currently maintains a bullish overall momentum, driven by several factors. For potential upward movement, the chart could make a bullish continuation towards the 1st resistance.
The 1st support is a multi-swing low at 4699.2, signifying a historical area where buying interest has been prevalent.
Additionally, the 2nd support at 4601.9 is deemed significant as it represents an overlap support and is associated with the 23.60% Fibonacci Retracement, providing added support.
The intermediate resistance at 4793.6 is considered noteworthy, linked to the 127.20% Fibonacci Extension, indicating a level where selling interest may intensify.
Furthermore, the 2nd resistance at 4817.0 is associated with a swing high resistance, adding another layer of potential resistance for the index.
BTC/USD:
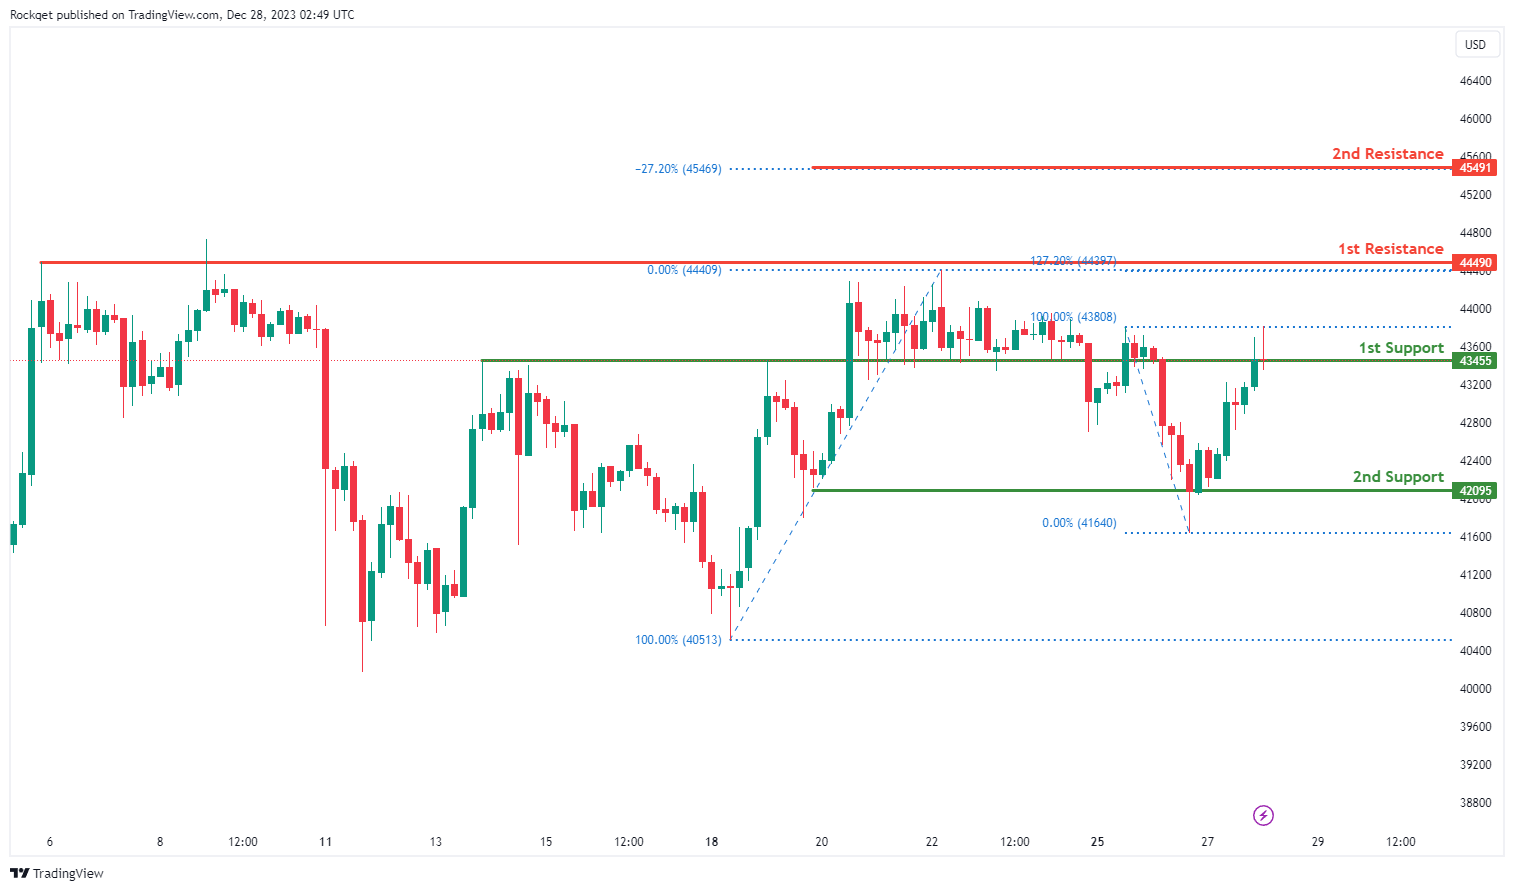
The BTC/USD chart exhibits a bullish overall momentum, and there’s potential for a bullish bounce off the 1st support, signaling a move towards the 1st resistance.
The 1st support at 43455 is considered significant as it represents an overlap support, indicating a historical area where buying interest has been present.
Additionally, the 2nd support at 42095 is identified as a pullback support, providing an additional layer of potential support for the cryptocurrency.
On the resistance side, the 1st resistance at 44490 is linked to a swing high resistance, representing a level where selling interest could intensify.
Furthermore, the 2nd resistance at 45491 is associated with a -27% Fibonacci Expansion, adding another layer of potential resistance for BTC/USD.
ETH/USD:
The ETH/USD chart demonstrates a bullish overall momentum, suggesting a potential for a bullish continuation towards the 1st resistance.
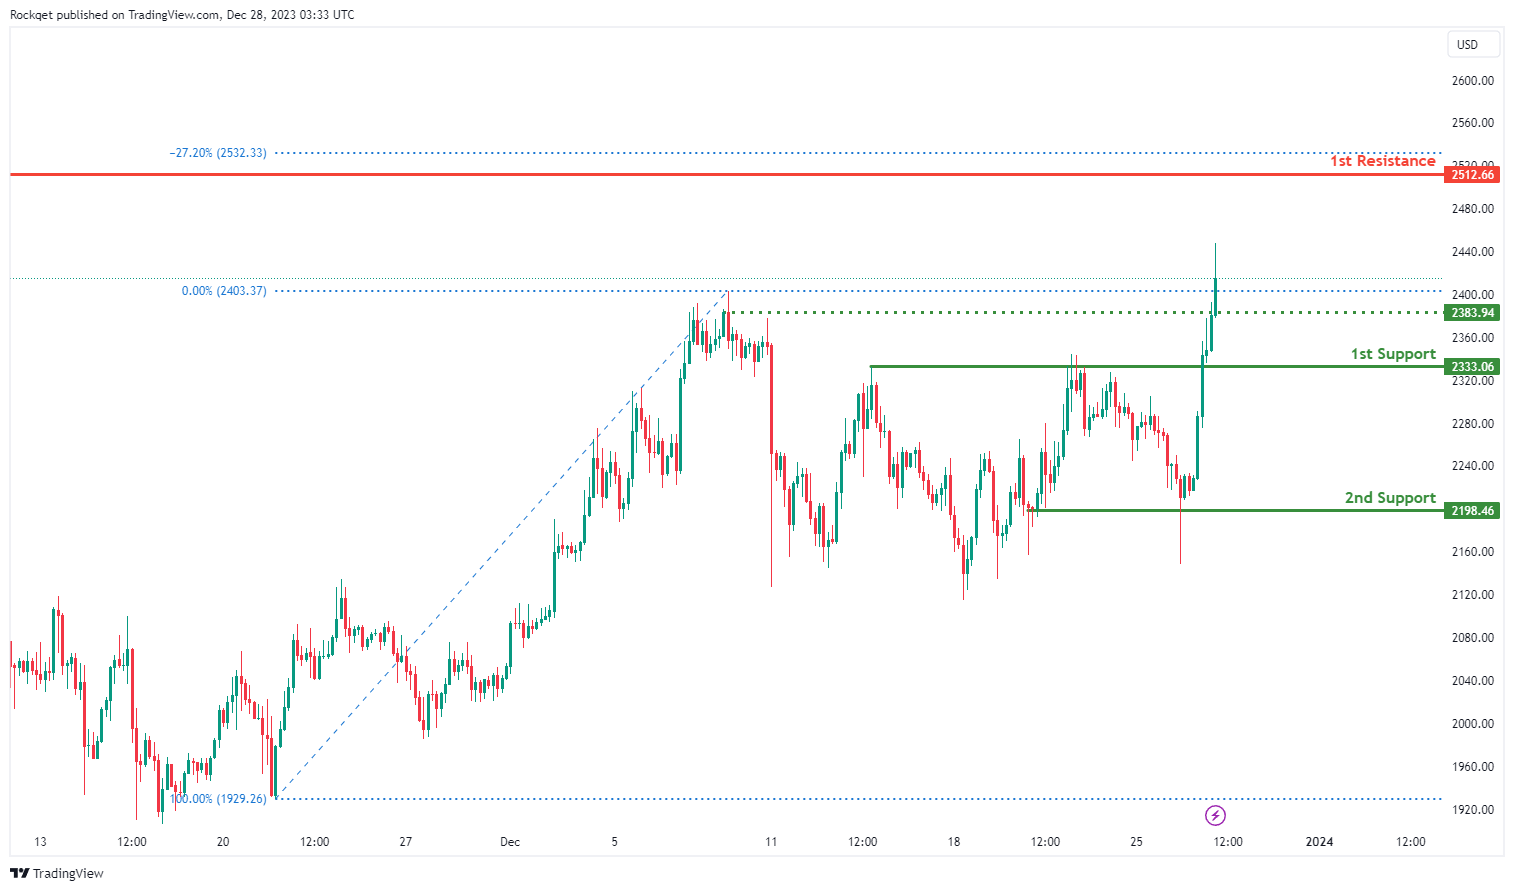
The 1st support at 2333.06 is considered significant as it represents a pullback support, indicating a historical area where buying interest has been present.
Additionally, the 2nd support at 2198.46 is identified as another pullback support, providing an additional layer of potential support for the cryptocurrency.
On the resistance side, the 1st resistance at 2512.66 is linked to a swing high resistance, representing a level where selling interest could intensify.
Furthermore, the intermediate support at 2383.94 is associated with an overlap support, adding another layer of potential support for ETH/USD.
WTI/USD:
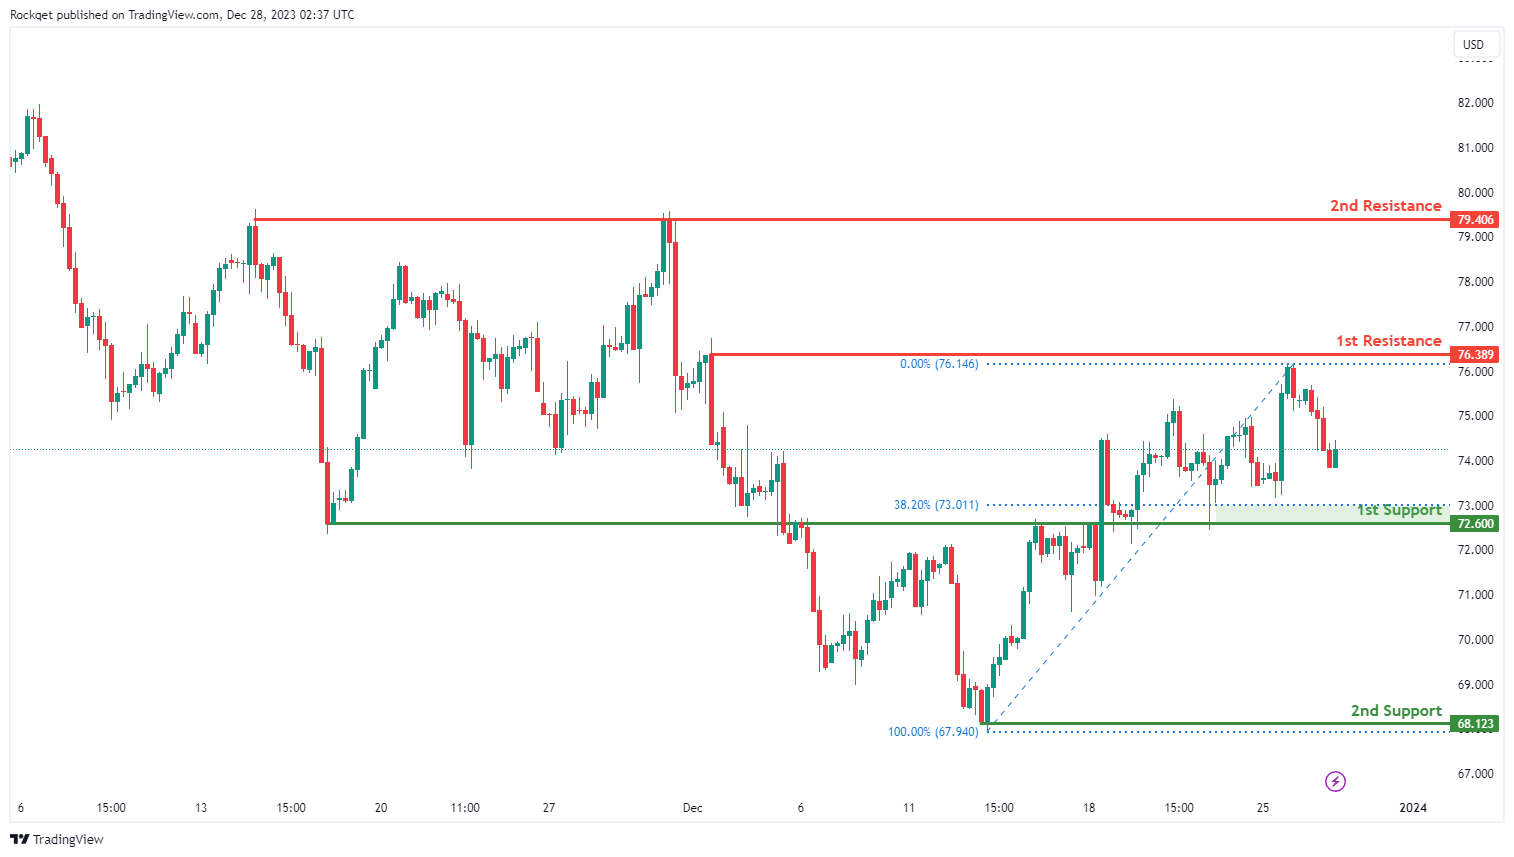
The WTI chart currently exhibits an overall bullish momentum, suggesting a prevailing uptrend. However, there is a potential scenario for price to fall towards the 1st support before resuming the uptrend.
The 1st support level at 72.60 is identified as an overlap support that aligns close to the 38.20% Fibonacci retracement level. Further below, the 2nd support level at 68.12 is marked as a swing-low support, reinforcing its importance as a key support level.
To the upside, the 1st resistance level at 76.38 is identified as a pullback resistance. Higher up, the 2nd resistance level at 79.40 is noted as a multi-swing-high resistance, further indicating its potential significance as a barrier for further upward movement.
XAU/USD (GOLD):
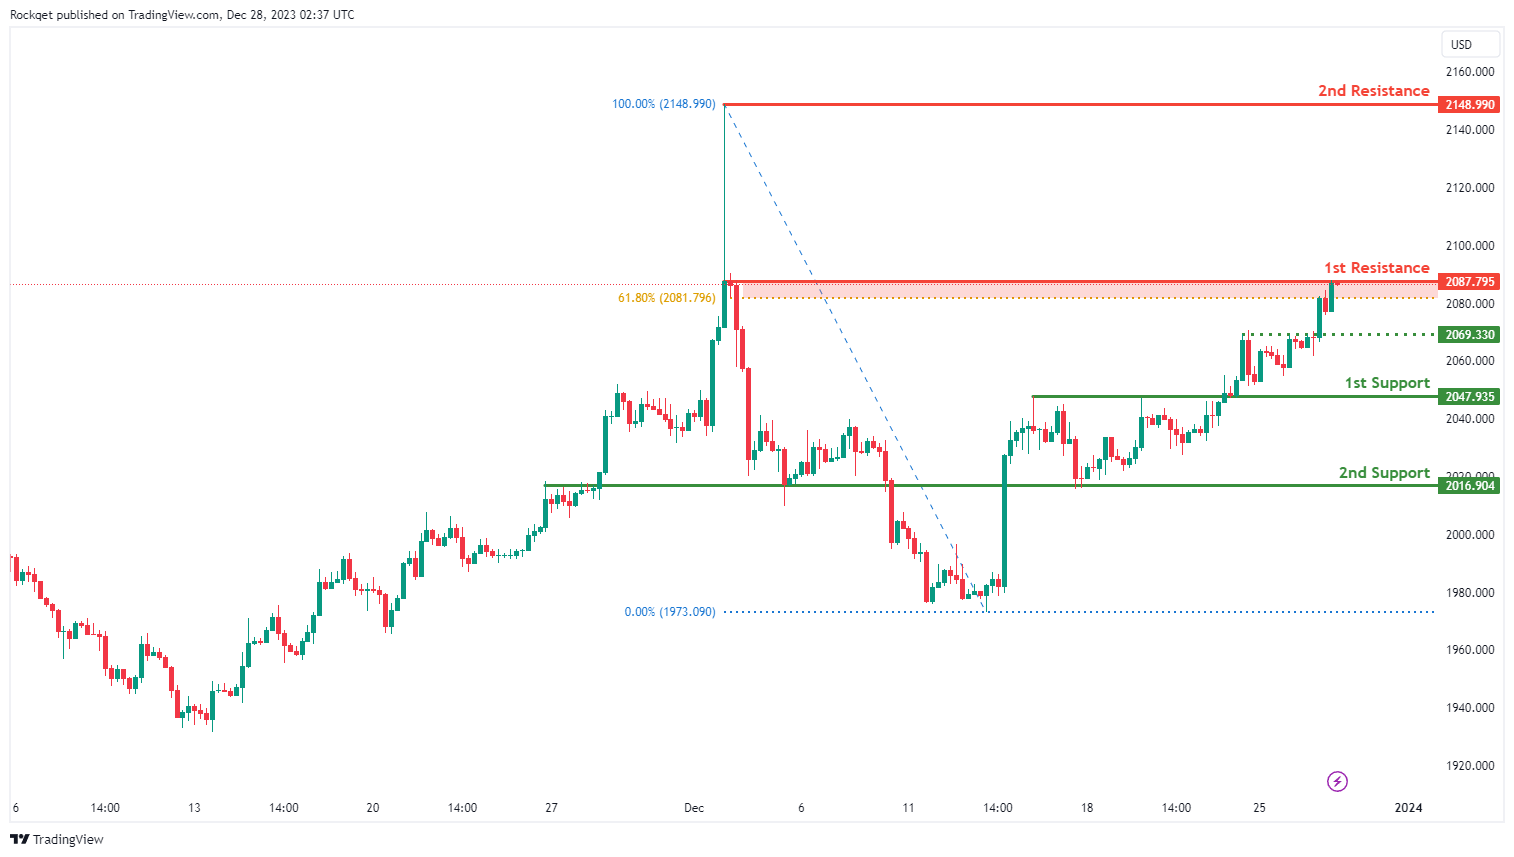
The XAU/USD chart currently demonstrates a bullish momentum, indicating a potential for price to break above the 1st resistance and make a bullish continuation towards the 2nd resistance.
The 1st resistance level at 2,087.79 is identified as a pullback resistance that aligns close to the 61.80% Fibonacci retracement level. Higher up, the 2nd resistance level at 2,148.99 is marked as a swing-high resistance, further indicating its potential significance as a barrier for further upward movement.
To the downside, the intermediate support level at 2,069.33 is identified as an overlap support while the 1st support level at 2,047.93 is also marked as an overlap support. Further below, the 2nd support level at 2,016.90 is also noted as an overlap support, reinforcing its importance as a key support level.
Japan’s industrial production down -0.9% mom, continues to seesaw indecisively
Japan's industrial production fell -0.9% mom in November, marking the first decrease in three months. This drop, however, was less severe than the expected -1.6% mom decline. A notable factor in the contraction was -2.5% mom fall in motor vehicle production. Among the 15 sectors surveyed, 11 reported decreased production, while four sectors experienced increases.
Index of industrial shipments also dropped by -1.3% mom, aligning with overall decline in industrial production. Conversely, Index of inventories saw a marginal increase of 0.1% mom.
The Ministry of Economy, Trade and Industry maintained its assessment of industrial output as "fluctuating indecisively." Looking ahead, manufacturers expect a rebound in output by 6.0% mom in December, followed by -7.2% mom decrease in January 2023.
An METI official said, "We'll continue to monitor the impact of the global economic downturn and rising prices".
In separate release, retail sales data painted a more positive picture. Sales in November rose 5.3% yoy, exceeding forecast of 5.0% yoy, and marked the 21st consecutive month of expansion since March 2022. On a month-on-month basis, retail sales grew 1.0%, following 1.7% growth in October.
Crude Oil Price Recovery Could Gather Pace Above $76
Key Highlights
- Crude oil prices started a recovery wave from the $67.70 zone.
- A key rising channel is forming with support near $73.80 on the 4-hour chart.
- Gold prices also gained pace and climbed above the $2,065 resistance.
- EUR/USD surged above the 1.1040 resistance zone.
Crude Oil Price Technical Analysis
In the past few days, Crude oil prices saw a decent recovery wave from the $67.70 zone. The price surpassed the $70.00 zone to move into a positive zone.
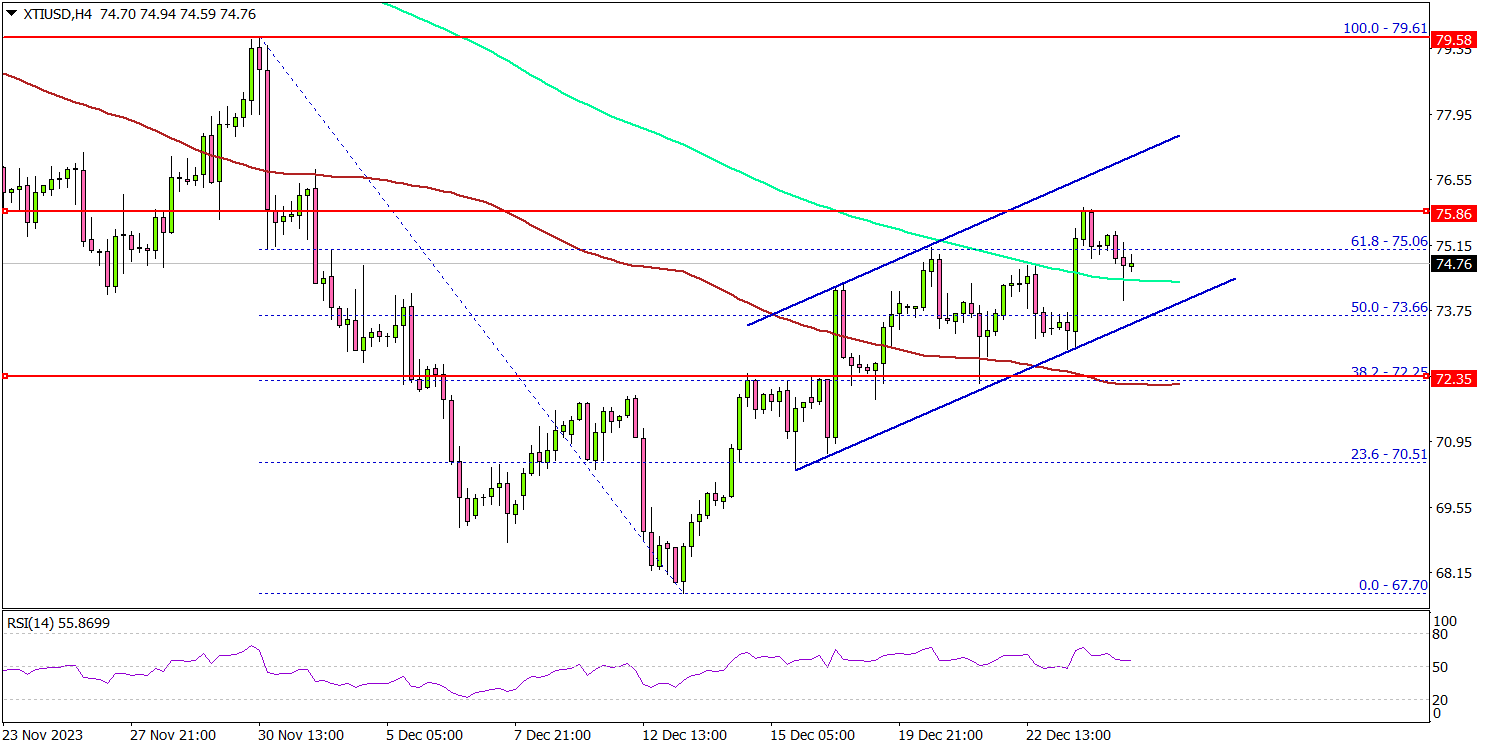
Looking at the 4-hour chart of XTI/USD, the price settled above the $73.50 zone, the 200 simple moving average (green, 4-hour), and the 100 simple moving average (red, 4-hour).
The price even broke the $75.00 level and the 61.8% Fib retracement level of the downward move from the $79.61 swing high to the $67.70 low. It is now consolidating gains near the $75.00 zone.
On the upside, the price is facing hurdles near the $75.80 level. The next major resistance is near the $77.20 zone, above which the price may perhaps accelerate higher. In the stated case, it could even visit the $78.00 resistance.
Immediate support is near the $73.60 level. There is also a key rising channel forming with support near $73.80 on the same chart. The next support is at $72.25, below which there is a risk of a sharp decline.
In the stated case, the price could dive toward the $70.00 support. Any more losses might call for a test of the $68.00 support zone.
Looking at gold prices, there was a steady increase and the bulls were able to push the price above the $2,065 resistance zone.
Economic Releases to Watch Today
- US Initial Jobless Claims - Forecast 210K, versus 205K previous.
- US Pending Home Sales for Nov 2023 (YoY) - Forecast +1%, versus -1.5% previous.
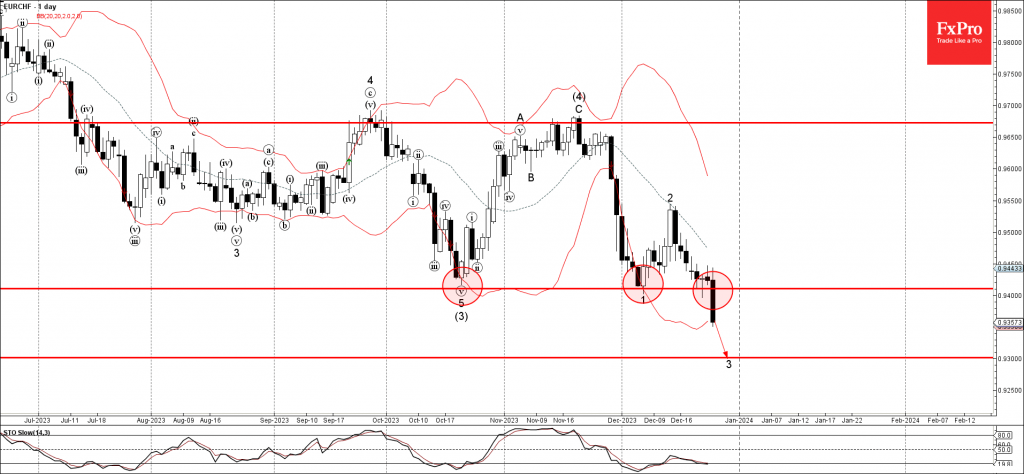
EURCHF Wave Analysis
- EURCHF broke key support level 0.9410
- Likely to fall to support level 0.9300
EURCHF recently broke the pivotal support level 0.9410 (former multi month low from July).
The breakout of the support level 0.9410 accelerated both of the active impulse waves 3 and (5).
Given the predominant weekly downtrend and the widespread Swiss franc gains seen today, EURCHF currency pair can be expected to fall further to the next support level 0.9300 (target for the completion of the active impulse wave 3).
USDCHF Wave Analysis
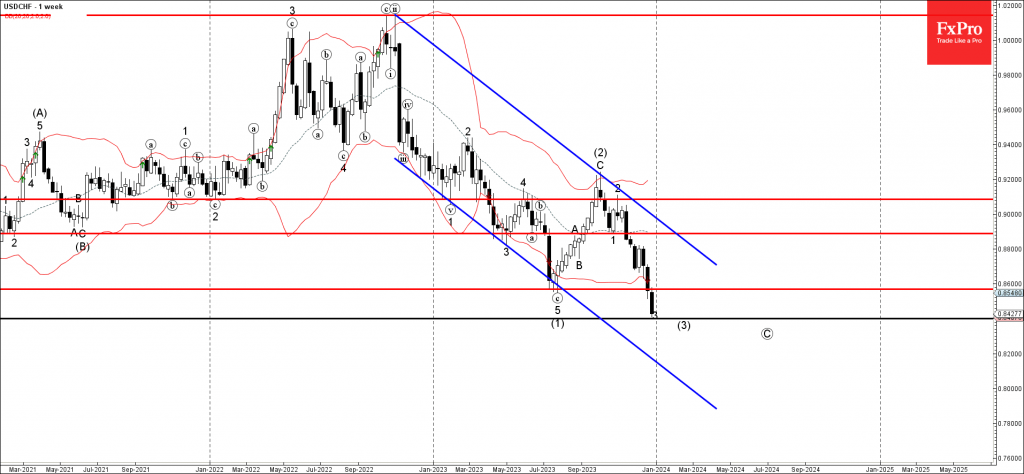
- USDCHF broke key support level 0.8570
- Likely to fall to support level 0.8400
USDCHF under the bearish pressure after the pair broke the key support level 0.8570 (former multi month low from July).
The breakout of the support level 0.8570 accelerated both of the active impulse waves 3 and (3).
Given the clear daily downtrend and the strongly bullish Swiss franc sentiment seen today, USDCHF currency pair can be expected to fall further to the next support level 0.8400 (target for the completion of the active impulse wave 3).
Swiss Franc Hits 9-Year High
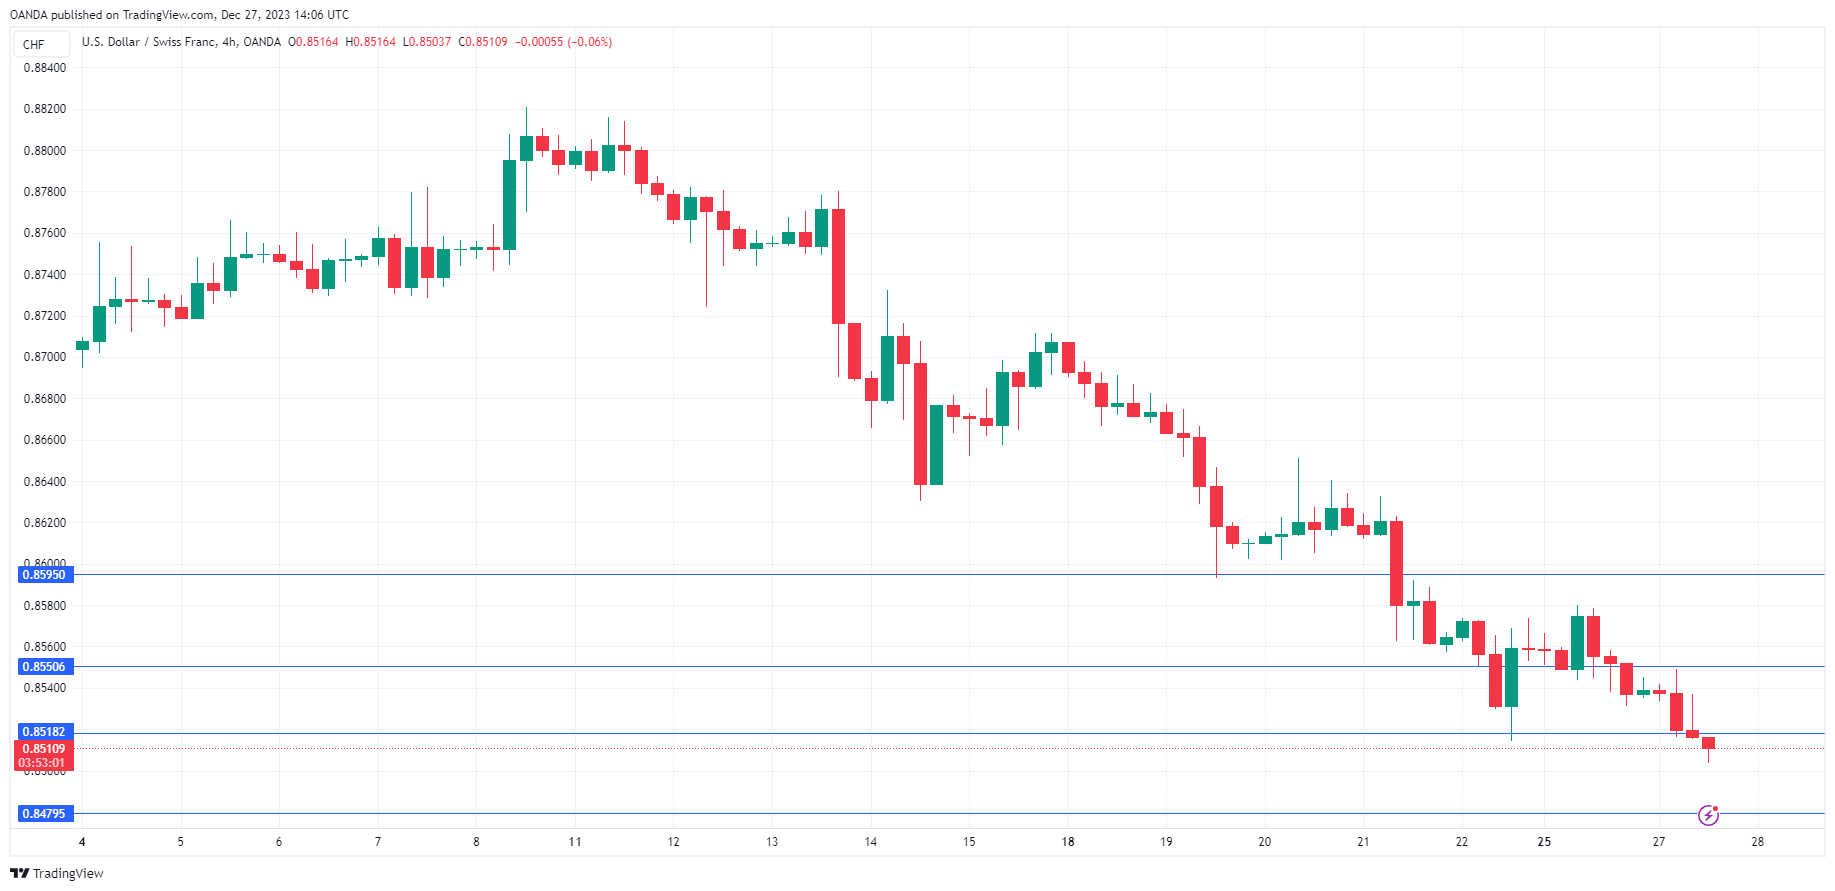
The Swiss franc is slightly lower in Wednesday trade. In the North American session, USD/CHF is trading at 0.8509, down 0.31%.
The Swiss franc continues to power higher and has climbed 2.5% against the slumping US dollar in the month of December. The Swissie has pummelled the greenback in 2023, gaining 7.7%, and is trading at its highest level since January 2015.
The Swiss National Bank has been buying Swiss francs during the year in order to boost its value and dampen inflation. This strategy has been successful but has come at a price, as the strong Swiss franc has made Swiss exports less competitive in global markets. The inflation rate is within the SNB’s target range of 0%-2% and the SNB’s inflation forecasts are also within the target range. This means that the central bank will likely decrease its currency intervention next year so long as there are no significant risks of inflation rising above 2%.
SNB unlikely to cut rates
The SNB has held the cash rate at 1.75% for two straight months and may have ended its rate-tightening cycle. The SNB has inflation right where it wants and there is little reason for the central bank to cut rates at this stage. The cash rate is not in restrictive territory as it is close to the expected level of inflation, which means that previous rate hikes are not hurting the economy, unlike the case in the US or the UK.
It’s a light data calendar between Christmas and New Year’s in the US. We’ll get a look at the Richmond Manufacturing Index today, with a market consensus of -6, compared to the -5 reading in November. On Thursday, unemployment claims are expected to drop to 205,000, down from 210,000 a week earlier..
USD/CHF Technical
- USD/CHF is testing support at 0.8518. Below, there is support at 0.8479
- 0.8550 and 0.8559 are the next resistance lines
USD/CHF Mid-Day Outlook
Daily Pivots: (S1) 0.8518; (P) 0.8550; (R1) 0.8569; More....
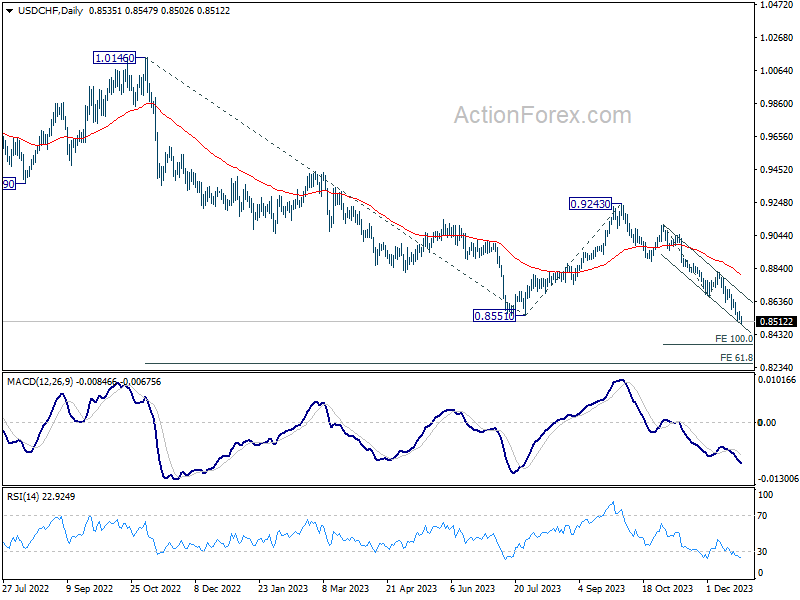
USD/CHF's decline resumes by breaching 0.8513 temporary low and intraday bias is back on the downside. Current fall should target 100% projection of 0.9111 to 0.8665 from 0.8819 at 0.8373 next. On the upside, above 0.8578 minor resistance will turn intraday bias neutral again. But outlook will stay bearish as long as 0.8665 support turned resistance holds, in case of recovery.
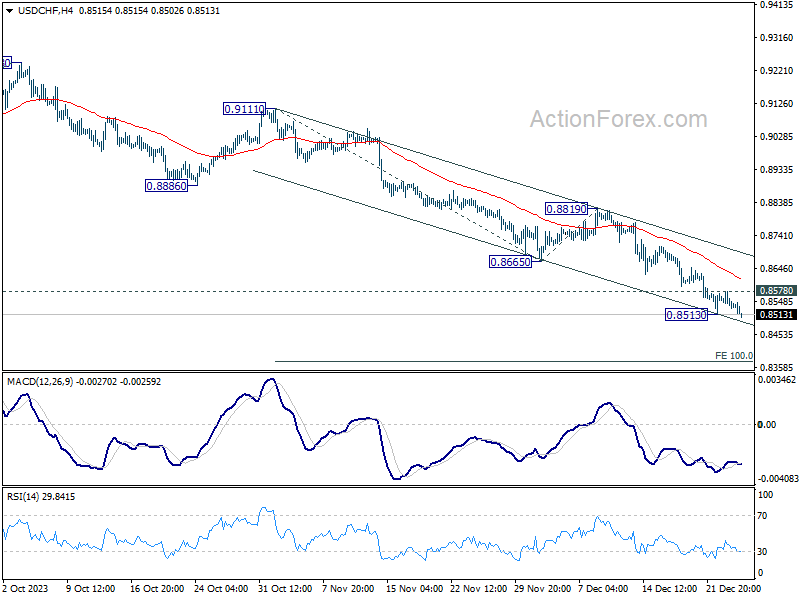
In the bigger picture, break of 0.8551 support indicates resumption of whole decline from 1.0146 (2022 high). Next target is 61.8% retracement of 1.0146 to 0.8551 from 0.9243 at 0.8257. Sustained break there could prompt downside acceleration to 100% projection at 0.7648. This will now remain the favored case as long as 0.8819 resistance holds.
USD/JPY Mid-Day Outlook
Daily Pivots: (S1) 142.11; (P) 142.37; (R1) 142.64; More...
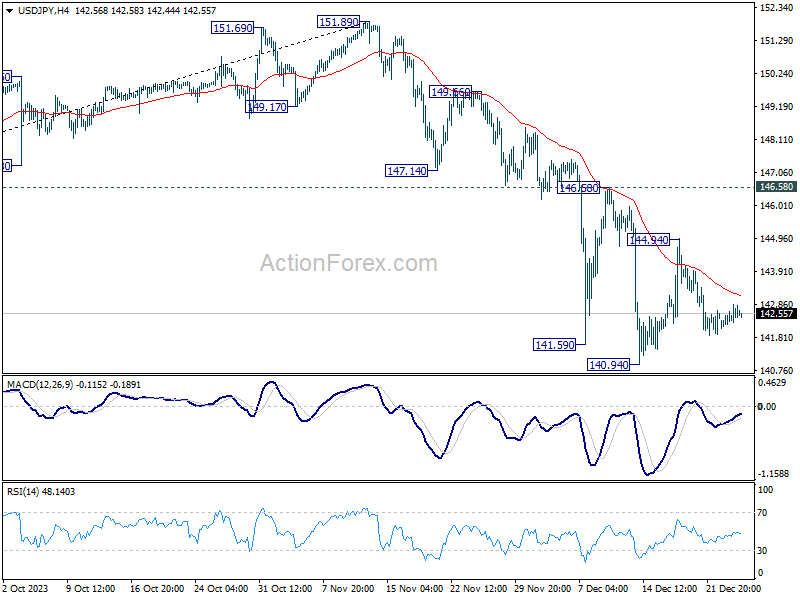
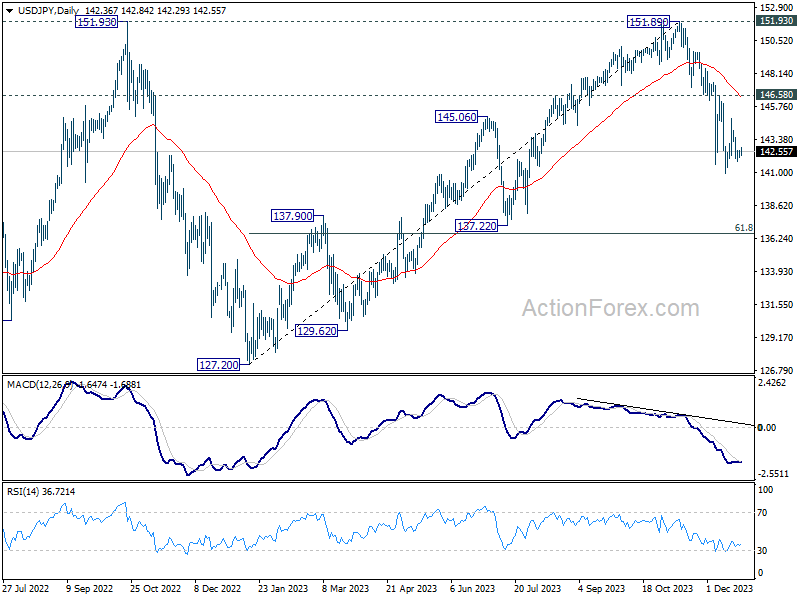
USD/JPY is staying in sideway consolidation and intraday bias remains neutral at this point. In case of stronger recovery, upside should be limited below 146.58 resistance. On the downside, firm break of 140.94 will resume the whole fall from 151.89. Next target will be next fibonacci level at 136.63.
In the bigger picture, fall from 151.89 is seen as the third leg of the corrective pattern from 151.93 (2022 high). Deeper decline would be seen to 61.8% retracement of 127.20 to 151.89 at 136.63, sustained break there will pave the way to 127.20 support (2022 low). This will now remain the favored as long as 146.58 resistance holds.
GBP/USD Mid-Day Outlook
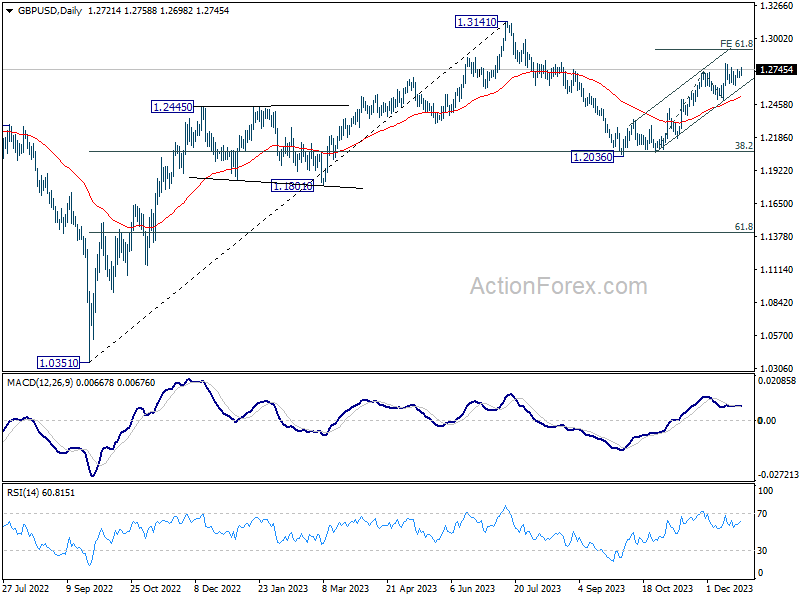
Daily Pivots: (S1) 1.2697; (P) 1.2714; (R1) 1.2742; More...
GBP/USD is still bounded in consolidation below 1.2793 and intraday bias stays neutral. As long as 1.2499 support holds, near term outlook will stay bullish and further rally is expected. On the upside, firm break of 1.2793 will resume the rally from 1.2036. Next target is 61.8% projection of 1.2068 to 1.2731 from 1.2499 at 1.2909.
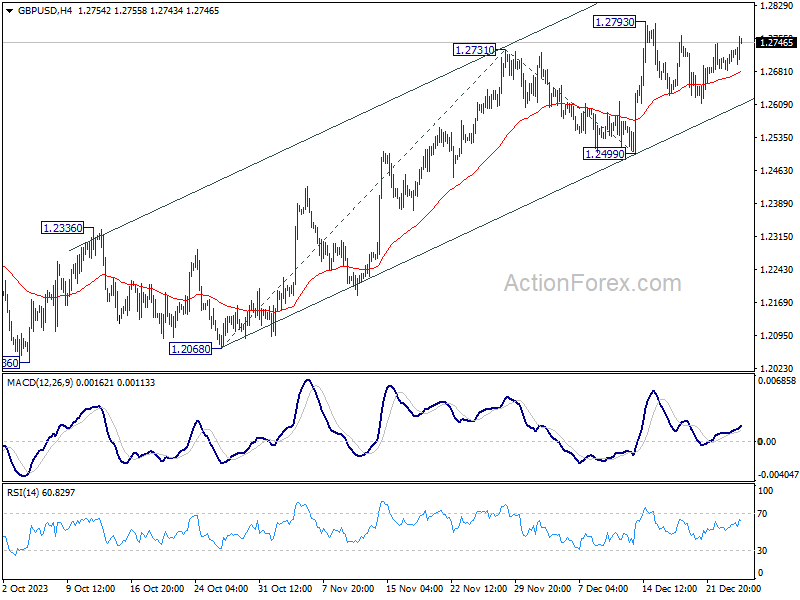
In the bigger picture, price actions from 1.3141 medium term top are seen as a corrective pattern to rise from 1.0351 (2022 low). Rise from 1.2036 is seen as the second leg that's in progress. Upside should be limited by 1.3141 to bring the third leg of the pattern. Meanwhile, break of 1.2499 support will argue that the third leg has already started for 38.2% retracement of 1.0351 (2022 low) to 1.3141 at 1.2075 again.