Sample Category Title
EUR/USD Mid-Day Outlook
Daily Pivots: (S1) 1.1020; (P) 1.1032; (R1) 1.1056; More...
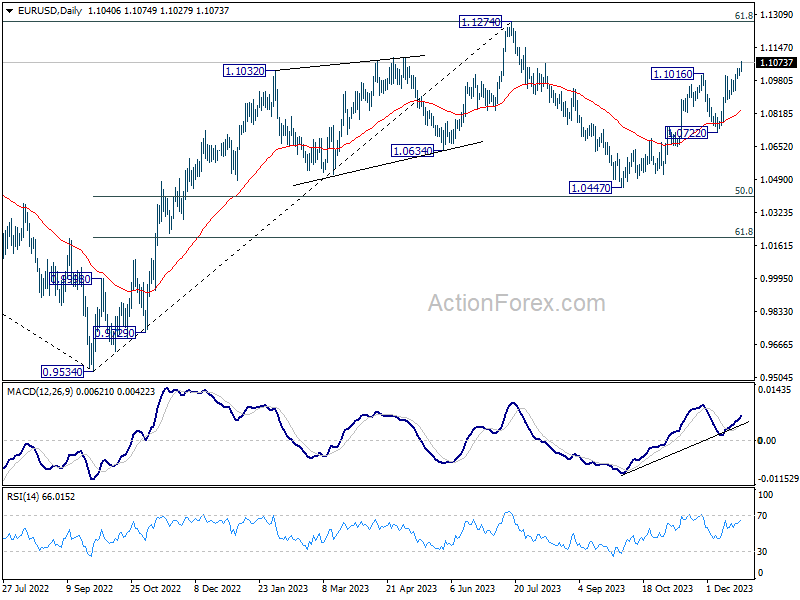
EUR/USD's rally continues today and hit as high as 1.0749 so far. Intraday bias remain son the upside for retesting 1.1274 high. Strong resistance should be seen from there to limit upside, at least on first attempt. On the downside, below 1.1027 minor support will turn intraday bias neutral first. But further rally will remain in favor as long as 1.0722 support holds, in case of retreat.
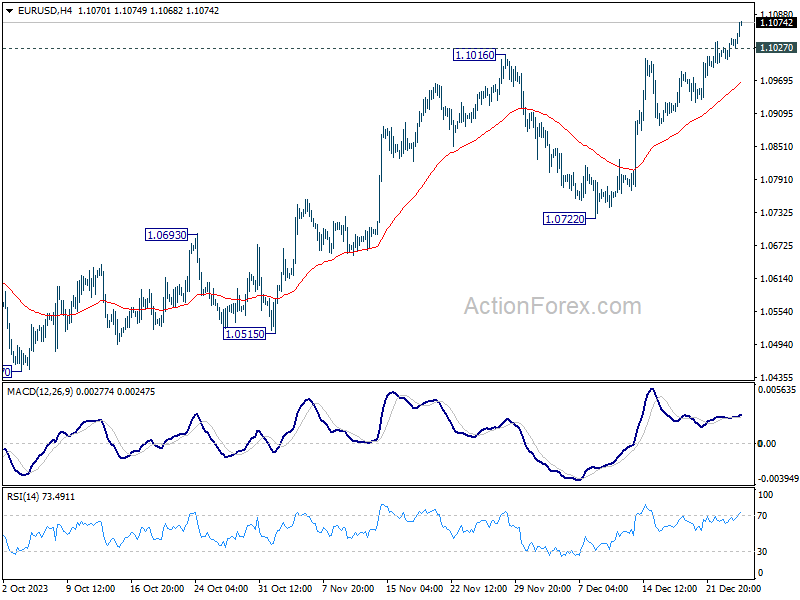
In the bigger picture, price actions from 1.1274 are viewed as a corrective pattern to rise from 0.9534 (2022 low). Rise from 1.0447 is seen as the second leg. While further rally could cannot be ruled out, upside should be limited by 1.1274 to bring the third leg of the pattern. Meanwhile, sustained break of 1.0722 support will argue that the third leg has already started for 1.0447 and below.
Euro and Sterling Take Back the Lead in Quiet Market
In today's subdued trading environment, Sterling Euro have emerged as the strongest currencies, outperforming Australian Dollar and New Zealand Dollar. The ascendancy of these European currencies does not appear to be driven by any specific fundamental factors. Instead, it seems to be part of a rotational trend where different currencies take turns rallying against Dollar and Japanese Yen. Currently, it is the turn of Euro and Pound to experience this upward movement.
Australian Dollar also remains firm, supported by a general recovery in risk sentiment across Asian markets. However, the currency's momentum is somewhat limited. This restraint indicates that investors are maintaining a cautious stance towards China's economic recovery. Despite recent positive indicators, there seems to be a preference for a wait-and-see approach during the holiday period. Market participants are likely looking for further evidence to confirm the sustainability of China's recovery, with the upcoming PMI data this Sunday being a potential catalyst. The outcome of this data may play a crucial role in shaping investor engagement and market dynamics at the start of January.
In Europe, at the time of writing, FTSE is up 0.65%. DAX is up 0.40%. CAC is up 0.30%. Germany 10-year yield is down -0.0505 at 1.913. UK 10-year yield is down -0.031 at 3.471. Earlier in Asia, Nikkei rose 1.13%. Hong Kong HSI rose 1.74%. China shanghai SSE rose 0.54%. Singapore Strait Times rose 0.98%. 10-year JGB yield fell -0.0349 to 0.599.
China's Shanghai SSE recovers, but risks remain on the downside
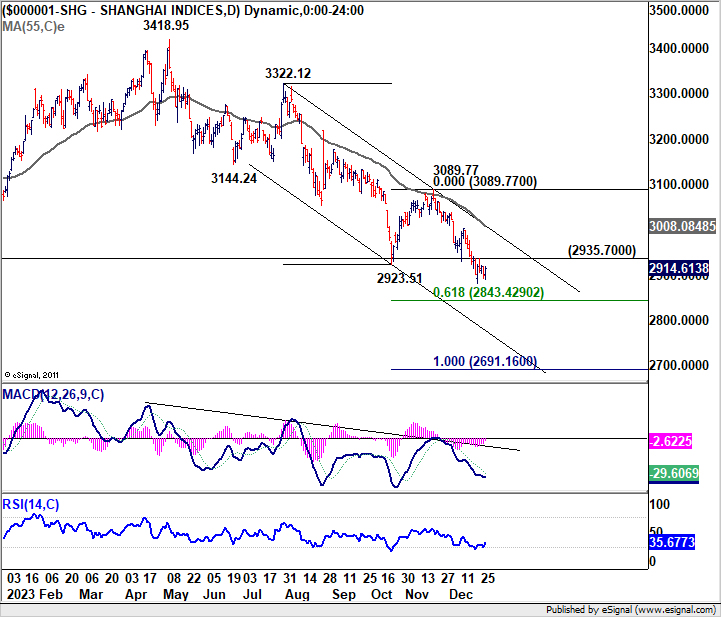
China's Shanghai SSE recovered mildly by closing up 0.54% earlier today. Sentiment was lifted by data from showing that industrial profits saw a substantial year-on-year jump of 29.5% in November, a significant acceleration from the modest October's 2.7% growth.
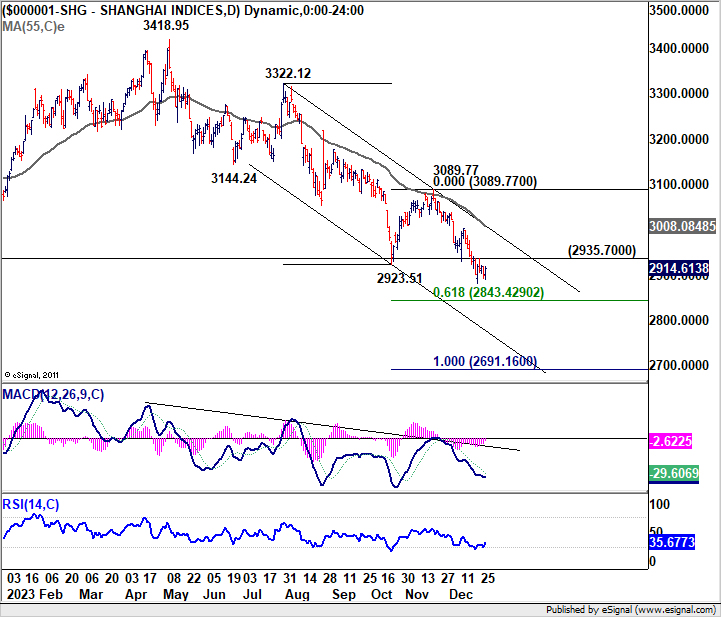
However, there is no change in outlook of SSE for now. As long as 2935.70 resistance holds, fall from 3089.77 should still extend further to 61.8% projection of 3322.12 to 2923.51 from 3089.77 at 2843.42.
Break of 2935.70 would indicate short term bottoming and bring stronger rebound. In this case, the key hurdle will be 55 D EMA (now at 3008.08) which is close to medium term trend line resistance, as well as 3000 psychological level.
BoJ's Ueda: Policy adjustment possible with strengthened wage-price relationship
BoJ Governor Kazuo Ueda, in a speech yesterday, acknowledged that while the probability of achieving the central bank's price target is gradually increasing, it is still not high enough to justify a change in the current monetary policy.
Ueda highlighted, "The likelihood of Japan's economy getting out of the low-inflation environment and achieving our price target is gradually rising, though the likelihood is still not sufficiently high at this point."
The Governor pointed out the significant uncertainties surrounding economic and price conditions both domestically and internationally. He emphasized the importance of observing how firms' wage- and price-setting behaviors evolve in response to these conditions.
Ueda also mentioned that "we will likely considering changing policy," if there is significant strengthening of the virtuous cycle between wages and prices, leading to a sustainable and stable likelihood of achieving BoJ's price target.
BoJ's Dec meeting highlights lack of urgency in tightening
Summary of Opinions of BoJ's December 18-19 meeting revealed a prevailing view among the board members on a lack of urgency in tightening monetary policy. The consensus was that delaying the decision to tighten poses minimal risk. This general sentiment indicates BoJ's preference for a measured approach, prioritizing stability and sufficient data before considering changes.
The summary acknowledged that the sustainable and stable achievement of price stability target, set at 2%, is not yet certain. In considering whether to end the negative interest rate policy and yield curve control framework, the board stressed the importance of confirming a virtuous cycle between wages and prices.
To reach the 2% inflation target sustainably, one member noted that "growth momentum in nominal wages needs to strengthen further". It's also noted that wage growth has not kept pace with inflation. And, even with potentially higher wage hikes in the spring, the risk of inflation significantly surpassing 2% remains "low". Current policy approach does not risk "falling behind the curve" in response to inflation dynamics.
The summary also noted that acknowledged that the need to "rapidly tighten monetary policy is small". At the same time, "the cost incurred if this risk materializes would be significant."
EUR/USD Mid-Day Outlook
Daily Pivots: (S1) 1.1020; (P) 1.1032; (R1) 1.1056; More...
EUR/USD's rally continues today and hit as high as 1.0749 so far. Intraday bias remain son the upside for retesting 1.1274 high. Strong resistance should be seen from there to limit upside, at least on first attempt. On the downside, below 1.1027 minor support will turn intraday bias neutral first. But further rally will remain in favor as long as 1.0722 support holds, in case of retreat.
In the bigger picture, price actions from 1.1274 are viewed as a corrective pattern to rise from 0.9534 (2022 low). Rise from 1.0447 is seen as the second leg. While further rally could cannot be ruled out, upside should be limited by 1.1274 to bring the third leg of the pattern. Meanwhile, sustained break of 1.0722 support will argue that the third leg has already started for 1.0447 and below.
Economic Indicators Update
| GMT | Ccy | Events | Actual | Forecast | Previous | Revised |
|---|---|---|---|---|---|---|
| 23:50 | JPY | BoJ Summary of Opinions | ||||
| 05:00 | JPY | Housing Starts Y/Y Nov | -8.50% | -4.30% | -6.30% | |
| 09:00 | CHF | Credit Suisse Economic Expectations Dec | -23.7 | -29.6 |
China’s Shanghai SSE recovers, but risks remain on the downside
China's Shanghai SSE recovered mildly by closing up 0.54% earlier today. Sentiment was lifted by data from showing that industrial profits saw a substantial year-on-year jump of 29.5% in November, a significant acceleration from the modest October's 2.7% growth.
However, there is no change in outlook of SSE for now. As long as 2935.70 resistance holds, fall from 3089.77 should still extend further to 61.8% projection of 3322.12 to 2923.51 from 3089.77 at 2843.42.
Break of 2935.70 would indicate short term bottoming and bring stronger rebound. In this case, the key hurdle will be 55 D EMA (now at 3008.08) which is close to medium term trend line resistance, as well as 3000 psychological level.
USD/JPY Steady, BoJ Releases Summary of Opinions
- BoJ Summary of Opinion highlights split over shift in policy
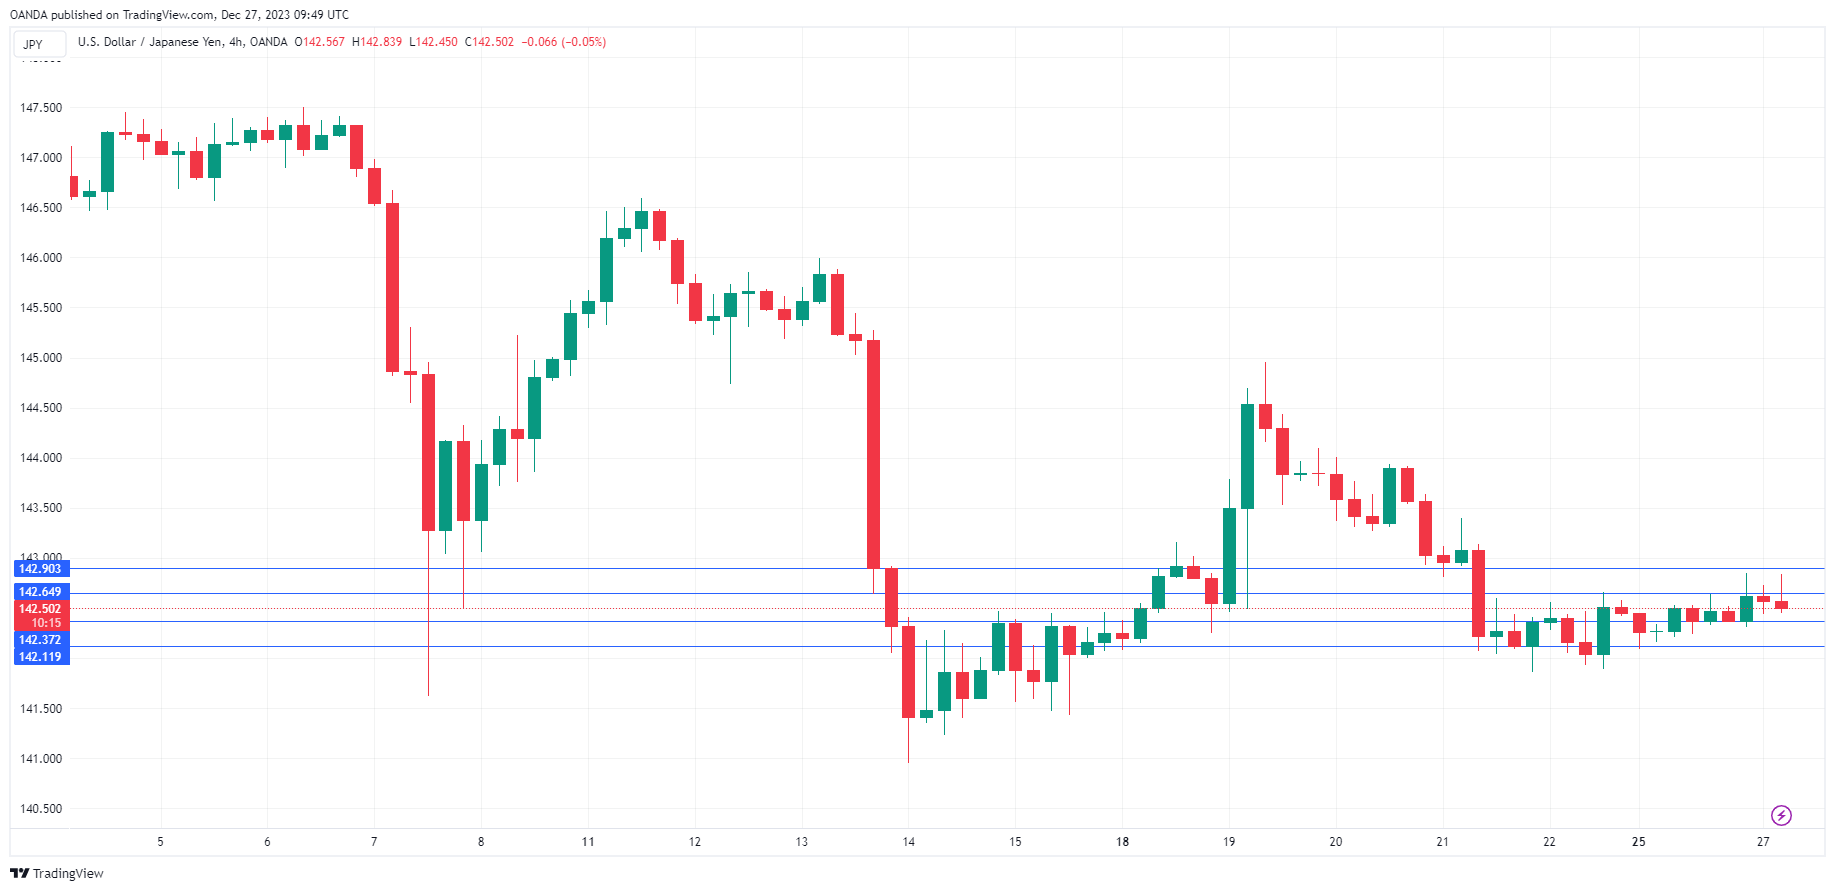
The Japanese yen continues to have a quiet week. In the European session, USD/JPY is trading at 142.54, up 0.12%.
The Bank of Japan’s summary of opinions from the December meeting was released earlier today. That meeting was somewhat of a disappointment to the markets, as there were expectations of a move after senior BoJ members hinted prior to the meeting that the Bank was looking to lift interest rates out of negative territory. In the end, the BoJ stayed put and maintained policy settings.
The summary highlighted the split amongst board members regarding the exit from ultra-loose monetary policy. One member stated that the timing of normalizing policy was “getting closer” but another member said that the BoJ could wait until after wage talks next spring.
The internal debate revolves around the key question as to when inflation will become sustainable at the 2% target. Governor Ueda has argued that wage growth must increase before inflation is sustainable and that the current high rate of inflation is due to cost-push factors. This means that national wage talks in April will play a key role in determining the BoJ’s rate policy. The takeaway from the summary is that an exit from ultra-loose policy is a question of when rather than if, and that there are differences of opinion within the central bank as to the timing of a shift in policy.
We have seen that tweaks to the yield curve control program have triggered sharp movement from the yen, and it’s a safe bet that a shift in policy would send the yen flying higher. BoJ policy meetings have become market-moving events and every comment from a senior BoJ official has the potential to shake up the currency markets. The BoJ holds its next meeting on January 22-23.
USD/JPY Technical
- USD/JPY is putting pressure on resistance at 142.55. Above, there is resistance at 142.78
- There is support at 142.34 and 142.11
Brent Oil Price Reaches New December High
Financial markets are experiencing a traditional decline in trading activity associated with the holiday period. Notable events:
- S&P-500 and NASDAQ-100 stock indices updated their maximum for the year after the holiday Monday, thereby confirming the idea that the decline on Wednesday, September 20, was in the nature of a correction. Santa and his rally do not disappoint.
- The dollar index drops to six-month lows due to expectations of an interest rate cut in March 2024.
- The price of oil reached a new high in December.
The rise in oil prices is caused by geopolitical tensions:
- WSJ: Iran-backed militias fire at US bases in the Middle East.
- Bloomberg: Continued Houthi attacks on shipping and US strikes on targets in Iraq raise the risk of the war expanding in the Middle East.
- Reuters: The war in Gaza will last several months. Concerns about the spread of the conflict are growing.
- Barron's: Dispute between Venezuela and Guyana could threaten oil production and higher prices.
If military action disrupts the production and supply of oil, this could sharply increase its price.
The XBR/USD chart shows that:
- the price is still in a downtrend (as shown by the red channel);
- moving within the ascending channel (shown in blue) in December, the price has reached the upper limit of the red channel, and is now in a vulnerable position.
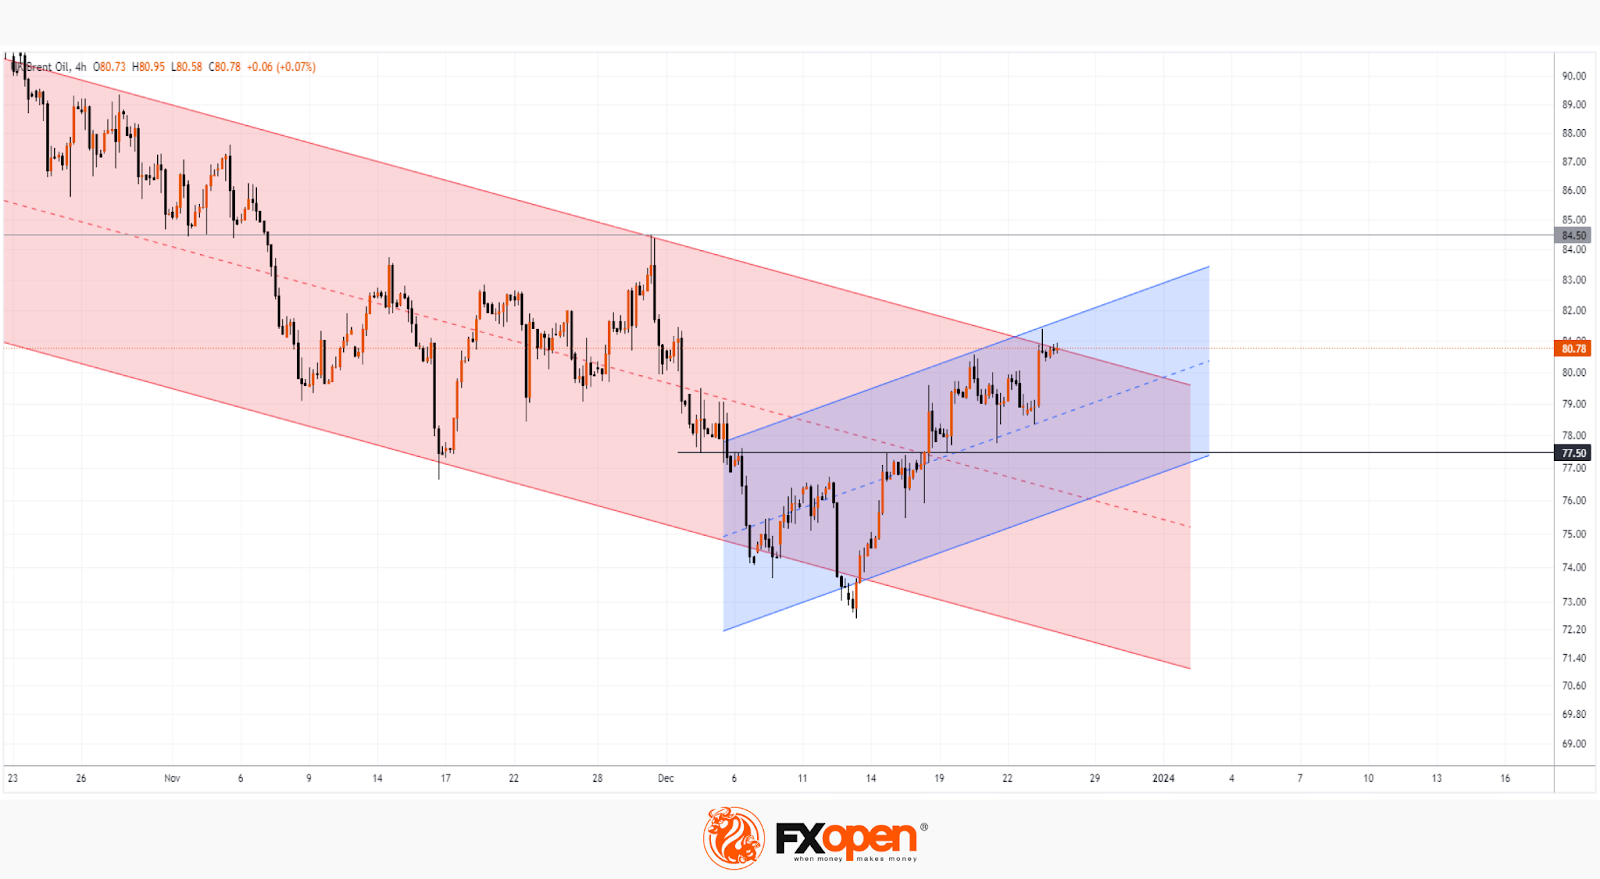
On the one hand, bears may try to resume the downward trend. On the other hand, if demand forces truly dominate the market, then only a minor pullback from the upper boundary of the red channel can be expected. Note the 77.50 level, which acted as resistance but changed its role after the breakout. Around this level there is a value of 50% of the price increase from the December low. So as long as the price is above 77.50, it is acceptable to assume that the chances of an attempt at a bullish breakout of the red channel will remain high.
This article represents the opinion of the Companies operating under the FXOpen brand only. It is not to be construed as an offer, solicitation, or recommendation with respect to products and services provided by the Companies operating under the FXOpen brand, nor is it to be considered financial advice.
NZDUSD Clocks Fresh 5-Month High; Looks Overbought
- NZDUSD stages a steady recovery from 2023 lows
- But momentum indicators warn of overbought risks
- Is there a pullback in sight?
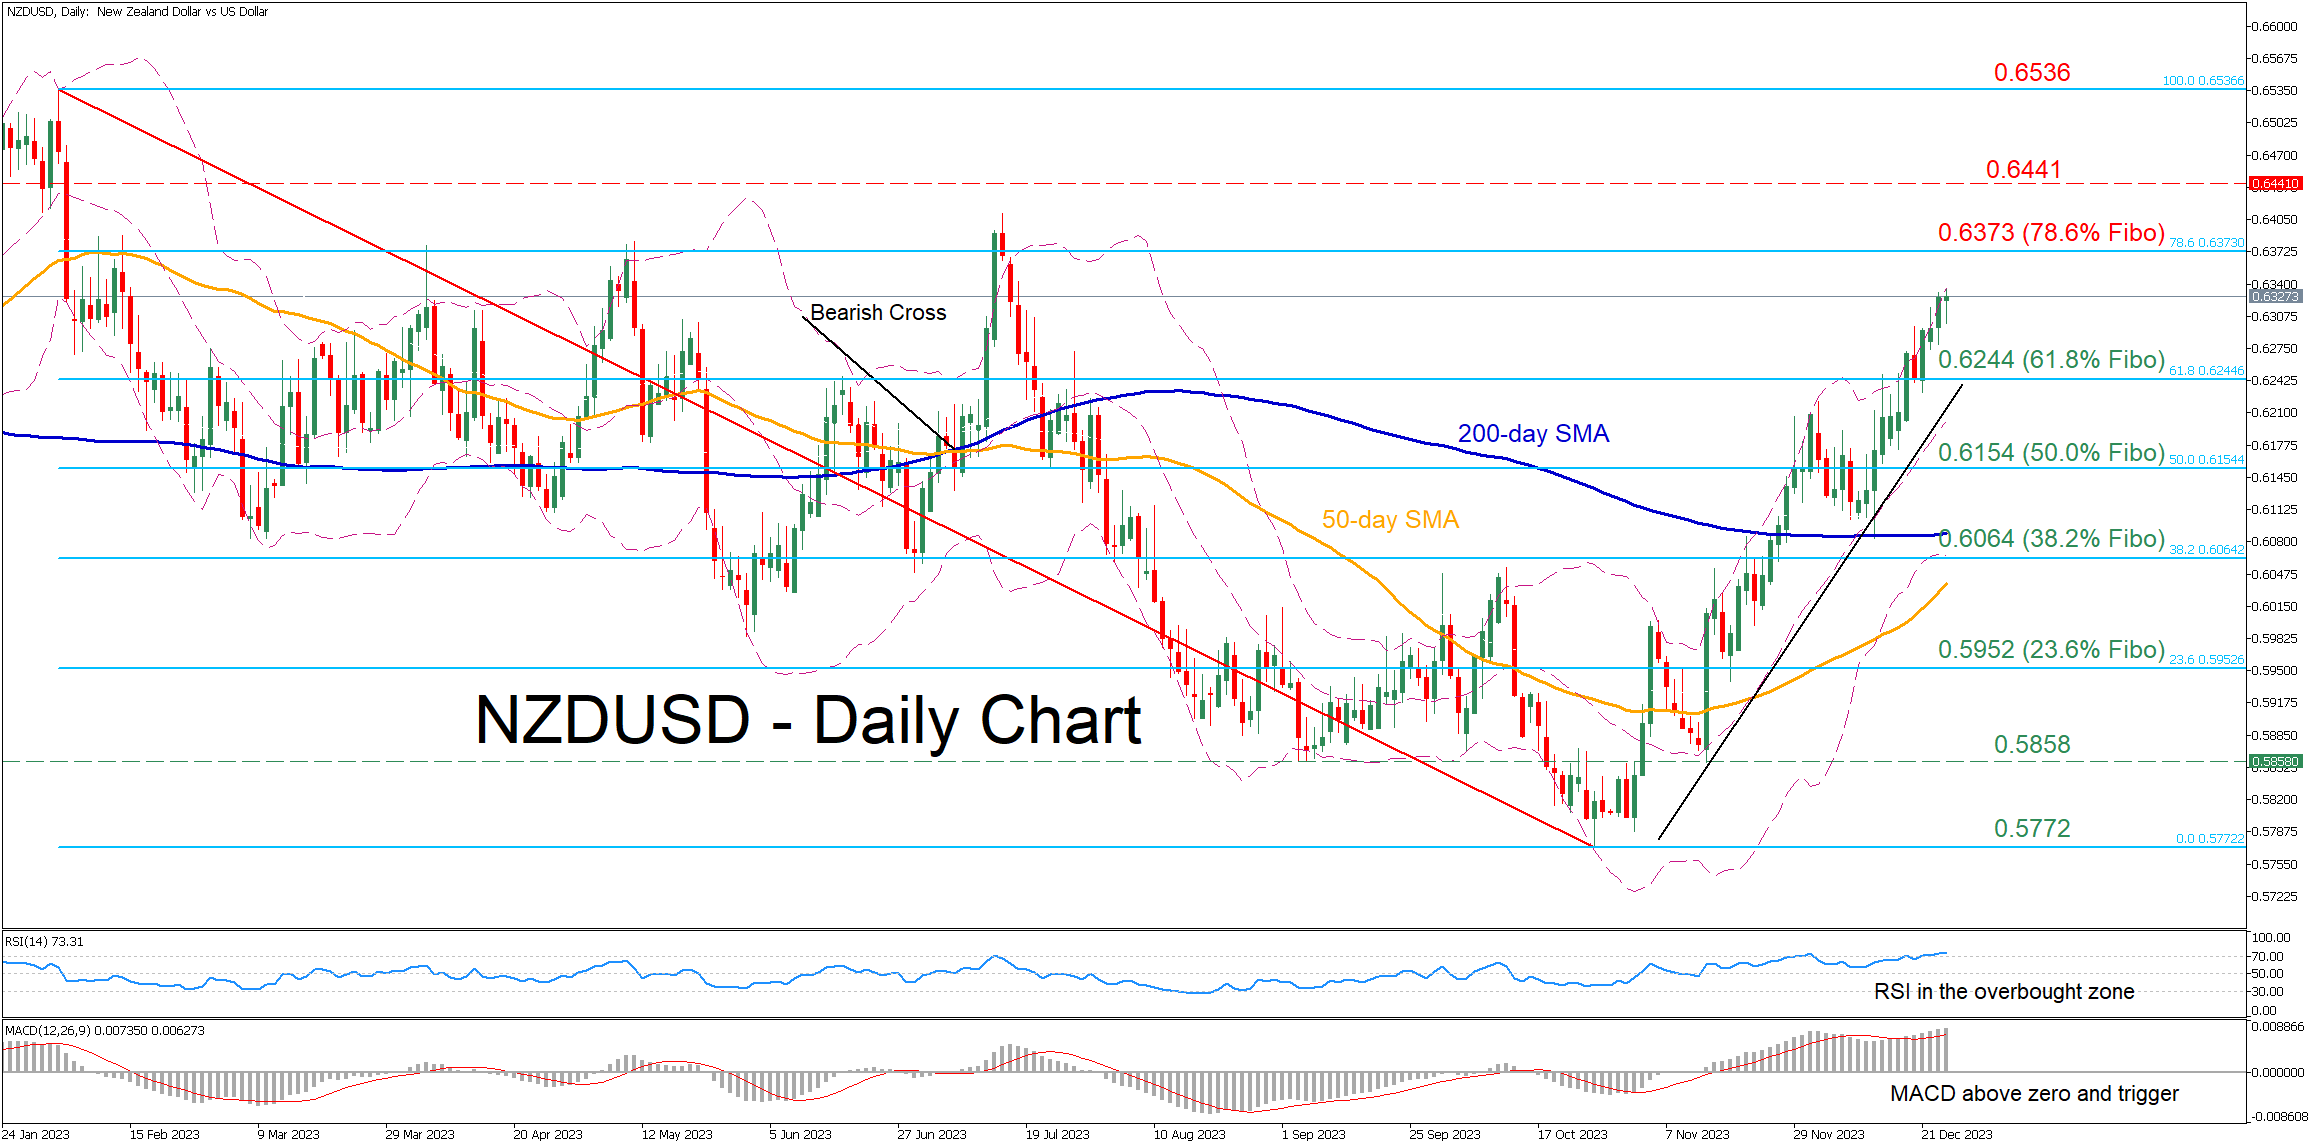
NZDUSD has been in a steep uptrend since its 2023 low of 0.5772, generating consecutive higher highs and a V-shaped recovery pattern. However, the latest advance seems substantially overstretched as the RSI has been within its overbought zone for more than a week.
Should the price defy overbought signals, the bulls could aim at 0.6373, which is the 78.6% Fibonacci retracement of the 0.6536-0.5772 downtrend. Violating that crucial zone, the pair may ascend towards the December 2022 resistance of 0.6441. Even higher, further upside attempts could stall at the 2023 peak of 0.6536.
On the flipside, if the pair experiences a downside correction, immediate support could be met at the 61.8% Fibo of 0.6244. A break below that region could shift the spotlight to the 50.0% Fibo of 0.6154. Failing to halt there, the pair could face the 38.2% Fibo of 0.6064.
Overall, NZDUSD stormed to a fresh five-month high on Wednesday, but its advance is starting to look overdone. Can the pair extend its bullish structure or are we heading towards a correction?
EURUSD Edges Higher, Tests Key Resistance Area
- EURUSD edges higher again today, makes higher high
- It tests the resistance set by a key area, north of 1.1032
- Momentum indicators support the current bullish move
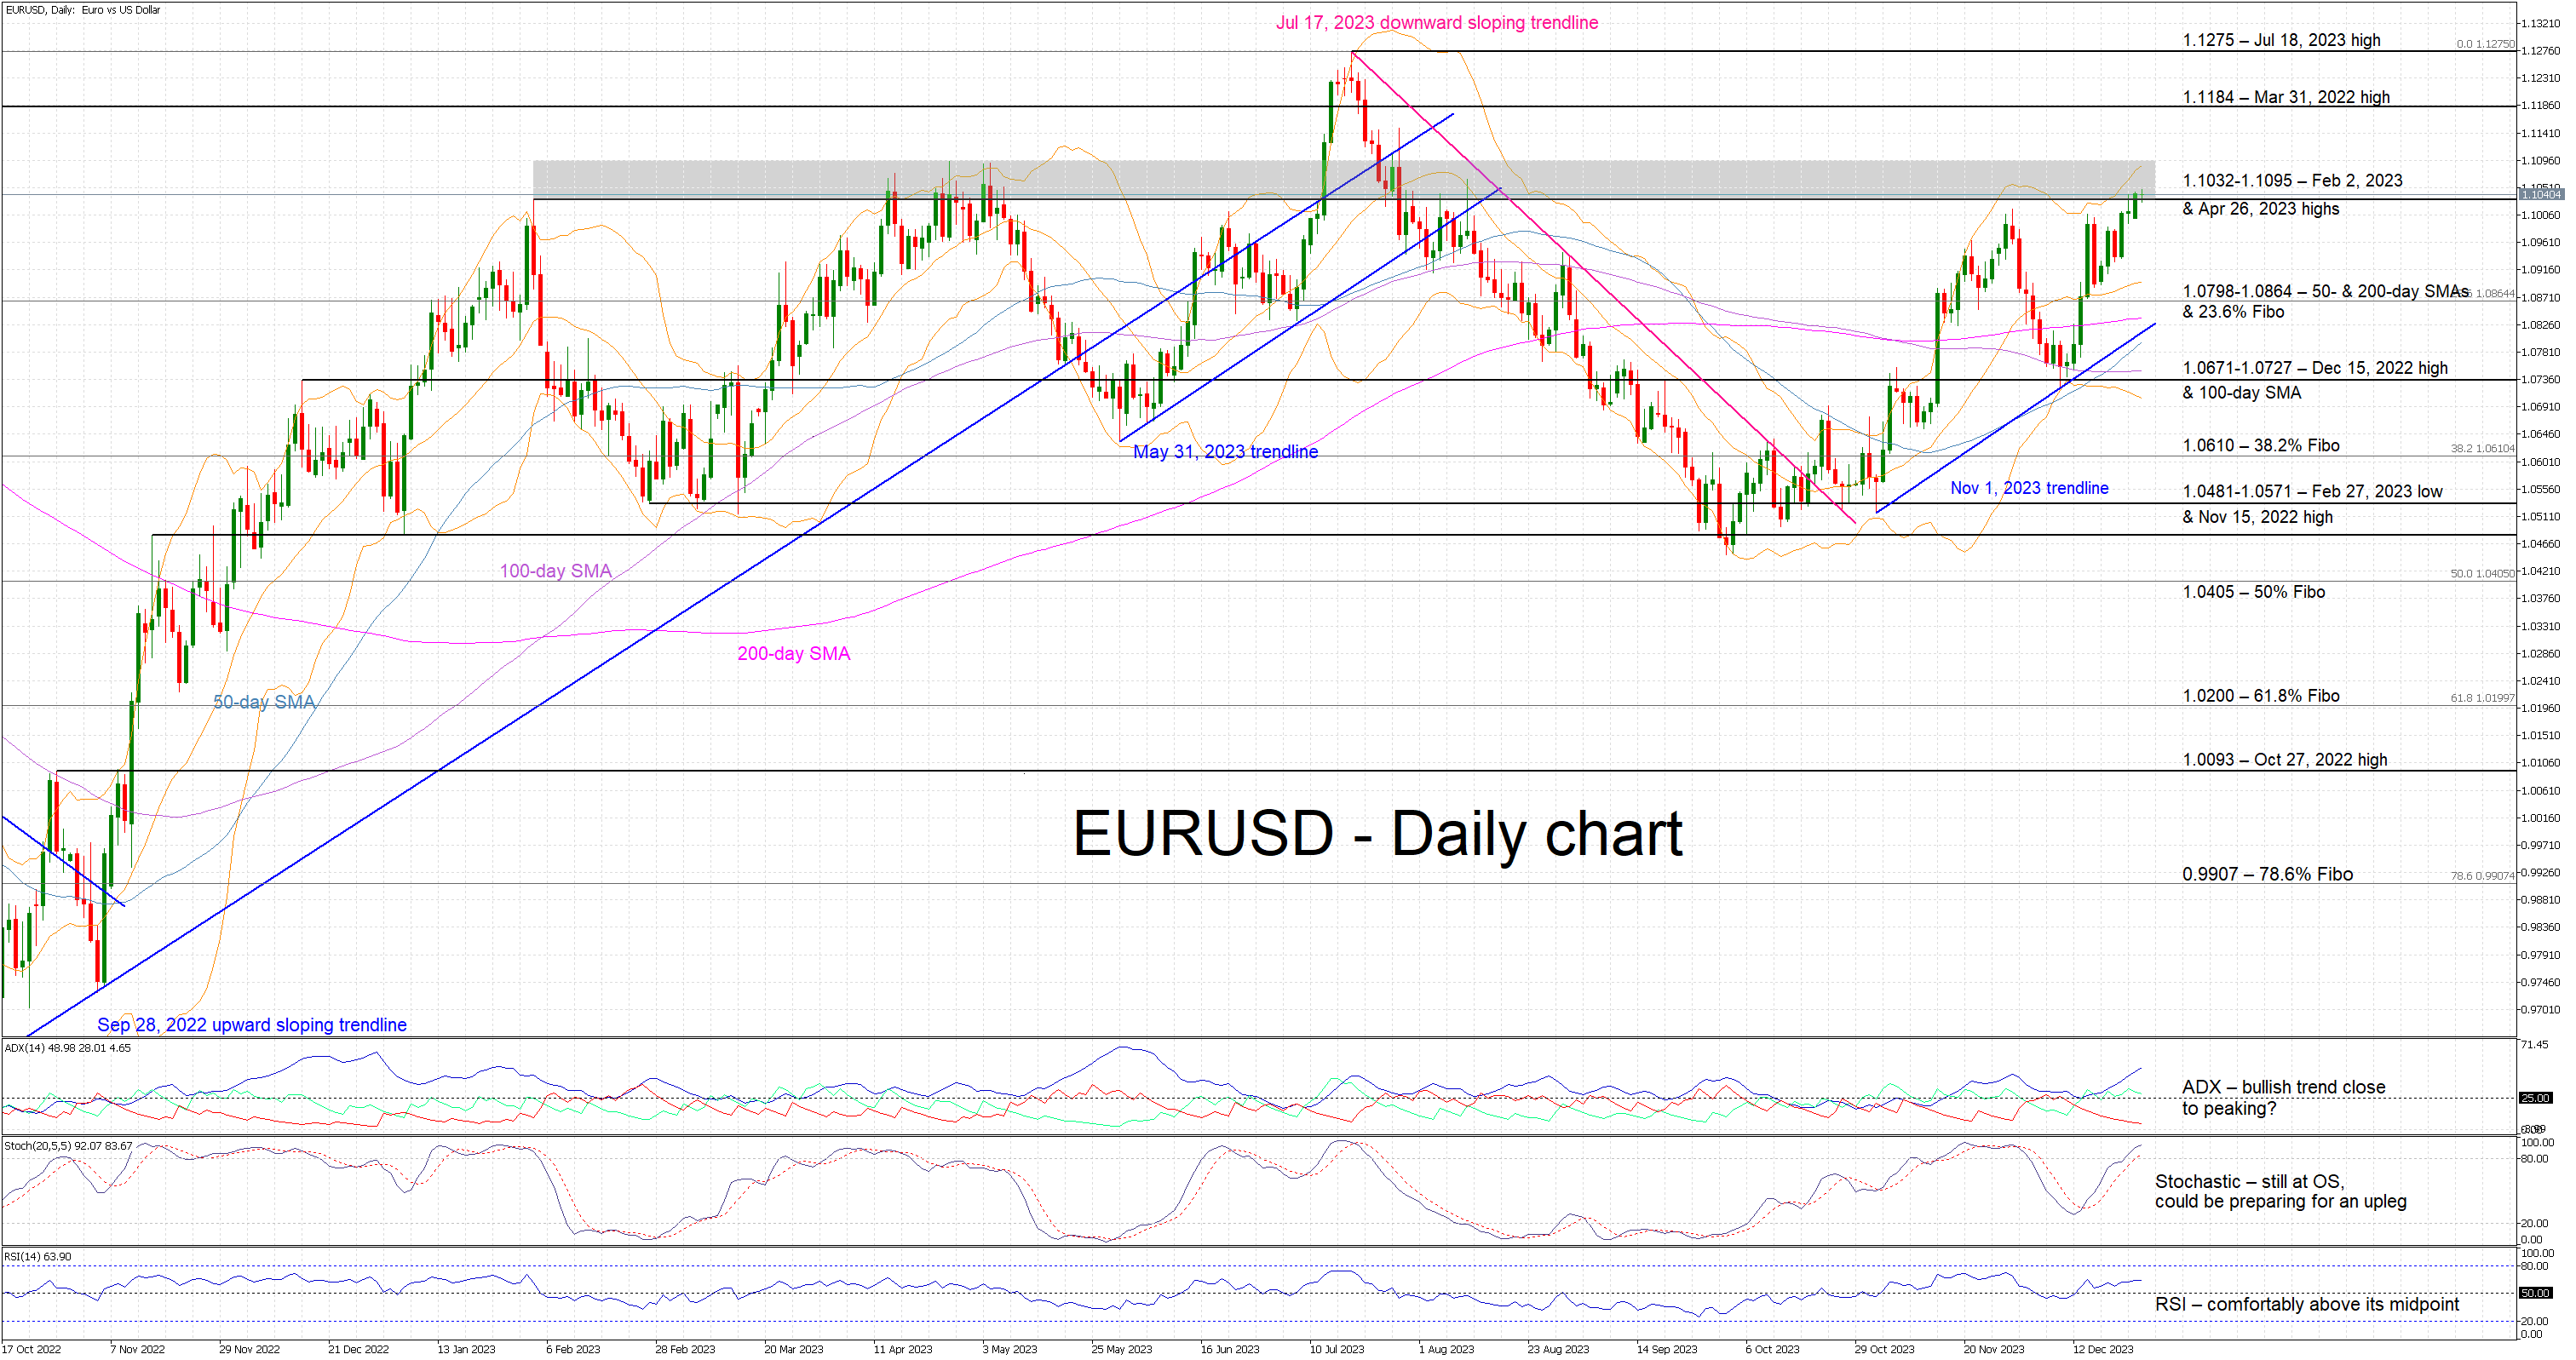
EURUSD is trying to record its fourth consecutive green candle as it has entered the 1.1032-1.1095 area. This is a key resistance area, which has been making the bulls’ lives difficult since February 2023 with a number of failed breakout attempts recorded. EURUSD has also recorded a higher high, above the recent local peak of 1.1016, thus keeping the bullish trend, which has been in place since the November 2023 lows, intact.
The bulls are probably feeling confident as the momentum indicators are yet to show strong rally-exhaustion signs. The RSI is hovering comfortably above its 50-threshold and the Average Directional Movement Index (ADX) is edging aggressively higher and thus pointing to a trending market. Similarly, the stochastic oscillator is trading in its overbought territory and trying to record a new higher high, matching EURUSD’s performance.
Should the bulls remain hungry, they could try to overcome the busy 1.1032-1.1095 area. If they are successful, they could then have a go at pushing EURUSD towards the March 31, 2022 and the July 18, 2023 highs at 1.1184 and 1.1275 respectively.
On the flip side, the bears are keen to defend the 1.1032-1.1095 range and then stage a move towards the 1.0798-1.086 area that is populated by the 50- & 200-day simple moving averages (SMAs) and the 23.6% Fibonacci retracement of the September 28, 2022 – July 18, 2023 uptrend. Even lower, the 1.0671-1.0727 region set by the December 15, 2022 high and the 100-day SMA could prove stronger to break than currently foreseen.
To sum up, EURUSD bulls are comfortably in control of the market, but they have now entered a key resistance area that could again lead to a sizeable correction.
EUR/USD Extends Rally While USD/JPY Revisits Support
EUR/USD gained bullish momentum above the 1.0985 resistance. USD/JPY is declining and showing bearish signs below the 142.85 level.
Important Takeaways for EUR/USD and USD/JPY Analysis Today
- The Euro remained in a bullish zone and climbed above the 1.0985 resistance zone.
- There is a key bullish trend line forming with support near 1.1020 on the hourly chart of EUR/USD at FXOpen.
- USD/JPY is trading in a bearish zone below the 143.40 and 142.85 levels.
- There was a break above a major bearish trend line with resistance near 142.25 on the hourly chart at FXOpen.
EUR/USD Technical Analysis
On the hourly chart of EUR/USD at FXOpen, the pair started a fresh increase above the 1.0930 zone. The Euro climbed above the 1.0985 resistance zone against the US Dollar.
The pair even settled above the 1.1020 resistance and the 50-hour simple moving average. Finally, it tested the 1.1040 resistance. A high is formed near 1.1044 and the pair is now consolidating gains.
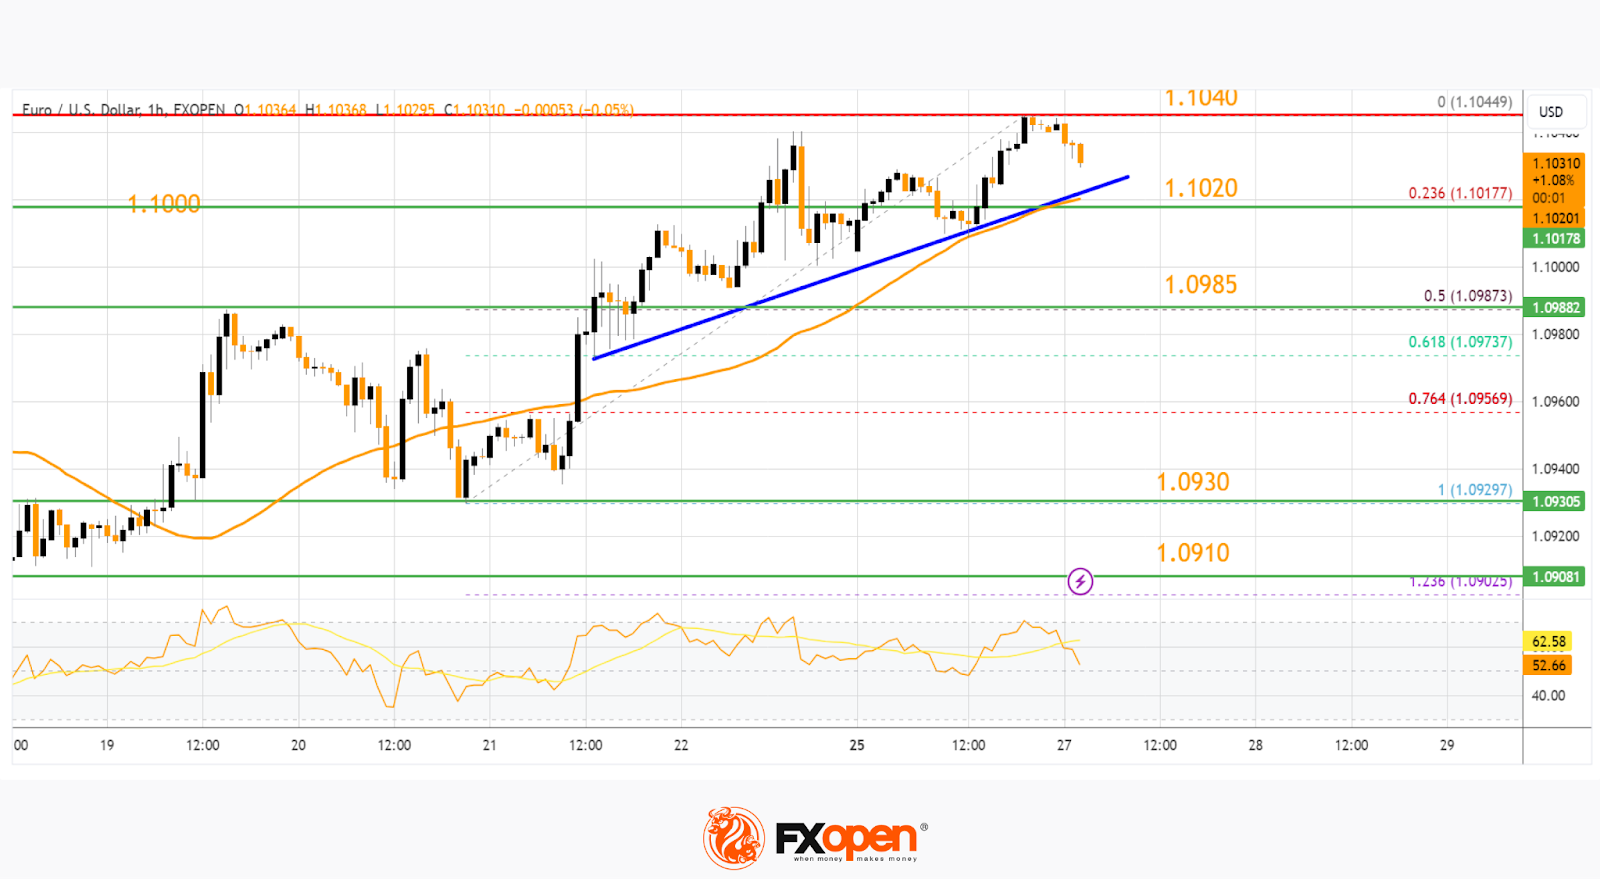
If there is a downside correction, the pair might test the 23.6% Fib retracement level of the upward move from the 1.0929 swing low to the 1.1044 high at 1.1020. There is also a key bullish trend line forming with support near 1.1020 and the 50-hour simple moving average.
The next major support is near the 50% Fib retracement level of the upward move from the 1.0929 swing low to the 1.1044 high at 1.0985.
If there is a downside break below 1.0985, the pair could drop toward the 1.0930 support. The main support on the EUR/USD chart is near 1.0910, below which the pair could start a major decline.
On the upside, the pair is now facing resistance near 1.1040. The next major resistance is near the 1.1065 level. An upside break above 1.1065 could set the pace for another increase. In the stated case, the pair might rise toward 1.1120.
USD/JPY Technical Analysis
On the hourly chart of USD/JPY at FXOpen, the pair started a strong decline well above the 143.50 zone. The US Dollar gained bearish momentum below the 142.85 support against the Japanese Yen.
The pair even settled below the 142.85 level and the 50-hour simple moving average. Finally, it broke the 142.20 pivot level. A low was formed near 141.88 and the pair is now attempting a recovery wave.
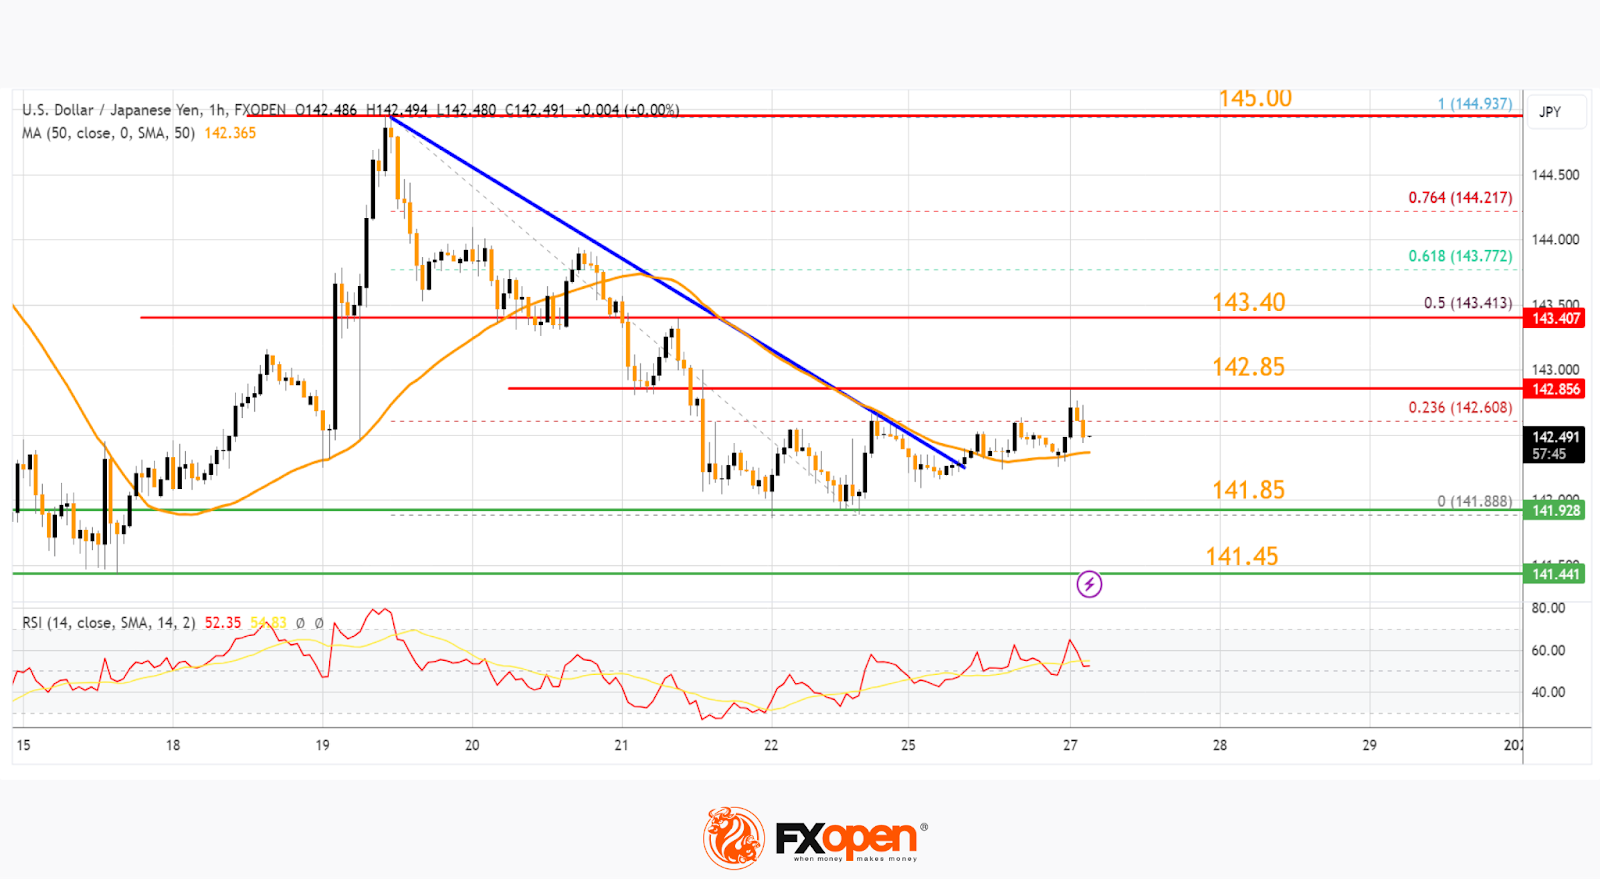
There was a break above a major bearish trend line with resistance near 142.25 and the 50-hour simple moving average. The pair spiked above the 23.6% Fib retracement level of the downward move from the 144.93 swing high to the 141.88 low. Immediate resistance on the USD/JPY chart is near 142.85.
The first major resistance is near the 50% Fib retracement level of the downward move from the 144.93 swing high to the 141.88 low at 143.40.
If there is a close above the 143.40 level and the hourly RSI moves above 60, the pair could rise toward 144.50. The next major resistance is near 145.00, above which the pair could test 146.20 in the coming days.
On the downside, the first major support is near 141.85. The next major support is near the 141.45 level. If there is a close below 141.45, the pair could decline steadily. In the stated case, the pair might drop toward the 140.00 support.
This article represents the opinion of the Companies operating under the FXOpen brand only. It is not to be construed as an offer, solicitation, or recommendation with respect to products and services provided by the Companies operating under the FXOpen brand, nor is it to be considered financial advice.
Rally Extends
The barrel of American crude finally cleared the $74/75pb resistance range on the mounting geopolitical tensions in the Red Sea and traded at $76pb on Tuesday. Yet the bullish market reaction looks relatively week given the amplitude of the issues in the region. The rally will likely continue at a gentle speed. The next natural target for oil bulls stands at 200-DMA, near $78pb, but the price should meet solid resistance at this level due to weak momentum.
Other than oil, yesterday was a slow day where the dovish Fed expectations continued to remain in the driver seat and drive the US stock and bond markets higher… while many other markets were peacefully sleeping. Buyers rushed into the US Treasury’s bond auctions yesterday to close in some good deals before the year ends on expectations that the Federal Reserve (Fed) will start chopping the rates by spring. According to Bloomberg, Treasury’s 52-week bill auction saw a record demand from indirect bidders – a group that includes foreign central banks – and the 6-month bill saw 71.6% demand, the 3rd biggest in history. This means that investors expect the yields to come significantly lower in the next 6-12 months. Consequently, the US 2-year yield slipped below the 4.30% mark, the US 10-year yield steadied below the 3.90% level.
The US dollar remains under a decent selling pressure, gold extends gains on the back of softening US yields – that decrease the opportunity cost of holding the non-interest-bearing gold, the EURUSD continues to push higher above the 1.10 level on the back of hawkish European Central Bank (ECB) commentaries, yet the rally in the Japanese yen starts giving signs of exhaustion into the 140 mark in the short run. A stronger yen will help the Bank of Japan (BoJ) rein in on inflation and decrease the need of normalizing. In the longer run, even if the BoJ doesn’t act, a dovish shift from the Fed should ensure a fall in the USDJPY towards 130/132.
The interesting thing is, we see the negative correlation between the Japanese Nikkei and the yen – wane. The latest appreciation in the Japanese yen didn’t bother stock buyers. The Nikkei continued to find buyers even with a stronger Japanese yen, meaning that either the stock investors don’t want to price in a potential easing from the BoJ – and maybe THEY are right, or the Fed dovishness is a nice boost to global stock markets and Japanese stocks benefit from the dovish Fed winds. In all cases, Japanese stocks remain on track for more gains.
In America, the S&P500 buyers will certainly not back down before sending the index to a fresh high this week, or the next. The index was trading just 0.5% below its ATH yesterday, so it would clearly be a shame if we finished this year without an S&P500 record, no?
But yes, the market optimism is overstretched, the Fed’s rate cut expectations are unfunded – in that, yes, the Fed will probably cut rates but not at the speed that’s been currently priced in – the oversold market conditions do hint that a downside correction would be healthy. Once the Santa high fades, the hangover will hit.
GBP/JPY Daily Outlook
Daily Pivots: (S1) 180.56; (P) 180.93; (R1) 181.54; More...
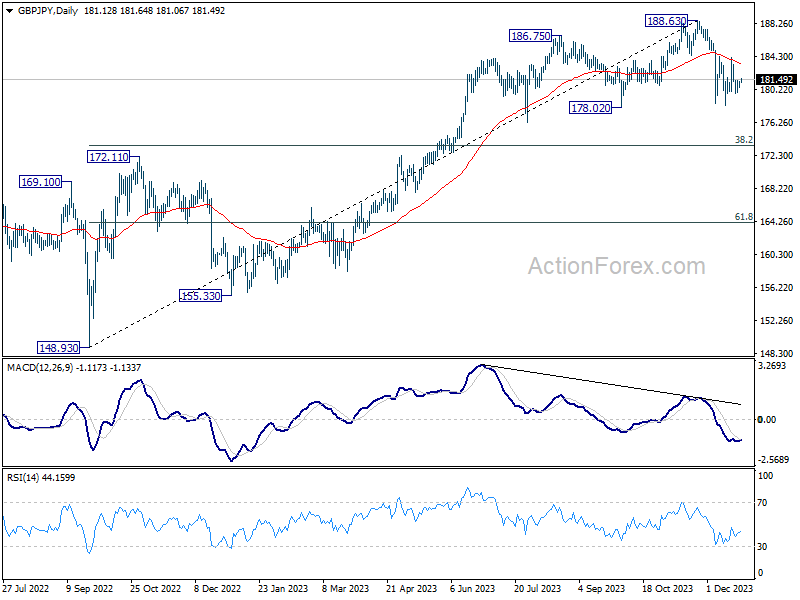
Range trading continues in GBP/JPY and intraday bias remains neutral for the moment. Further decline is expected as long as 184.15 resistance holds. On the downside, break of will resume the decline from 188.63 and target 38.2% retracement of 148.93 to 188.63 at 173.46. However, decisive break of 184.15 will argue that pull back from 188.63 has completed and bring retest of this high.
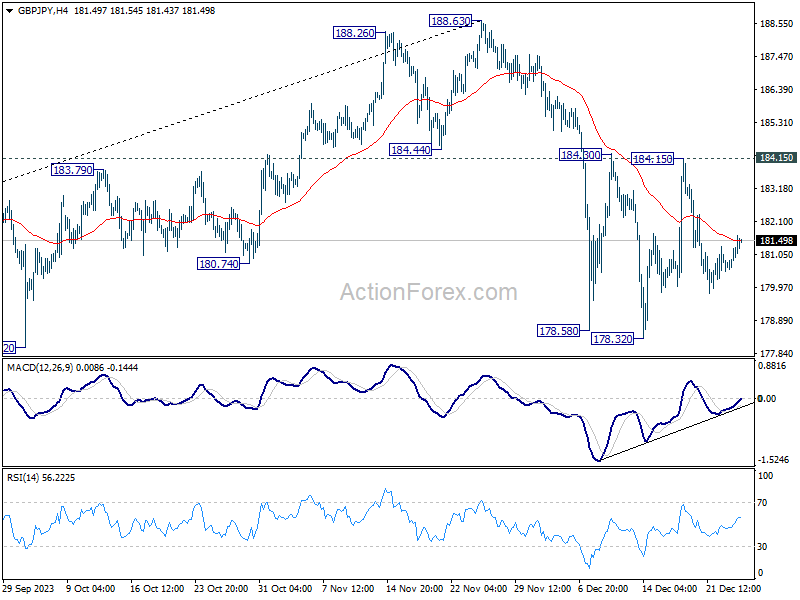
In the bigger picture, price actions from 188.63 medium term top are currently seen as a correction to the up trend from 148.93 (2022 low) only. As long as 172.11 resistance turned support holds, larger up trend from 123.94 (2020 low) is still in favor to resume through 188.63 at a later stage.