Sample Category Title
Will Nonfarm Payrolls Hint at a Fed Pause in June?
The Federal Reserve delivered its tenth consecutive rate hike on Wednesday, as expected, but reset its guidance to indicate increased emphasis on incoming data. Hence, Friday’s nonfarm payrolls will be the next test for the US dollar at 12:30 GMT, with forecasts pointing to a discouraging outcome.
A dovish rate hike
The Federal Open Market Committee (FOMC) decided to increase its funds rate by a quarter percentage point to the highest range in sixteen years of 5.0-5.25% for the sake of fighting inflation, despite three private banks collapsing recently. Although Powell reiterated that the banking system remains sound and resilient, he acknowledged that downside risks in the sector have grown, and a more cautious approach might be needed.
Unlike the ECB, the Fed is now more confident that a pause in monetary tightening could be around the corner but with inflation standing at 5.0% y/y – more than twice its symmetrical 2.0% target – it could not make any promises. Alternatively, it chose a safer path, adopting a less hawkish guidance to state that additional tightening could still be possible if there are signs of stronger-than-expected growth, inflation, and hiring. Previously, policymakers were focused on signs of slowing inflation to ease the pace of tightening.
Nonfarm payrolls might be the next challenge for markets
Consequently, the central bank’s new guidance added extra importance to the upcoming nonfarm payrolls report due on Friday. Investors expect employment growth to have eased to a more-than-a-year low of 180k in the month of April, while projecting a negligible pickup in the unemployment rate to 3.6% and a steady wage growth of 4.2% y/y.
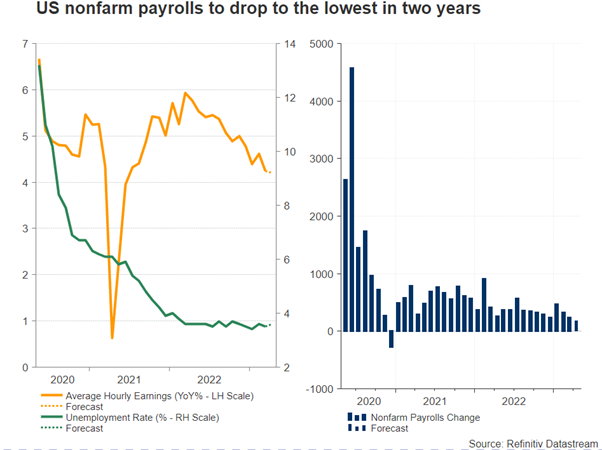
If forecasts are correct, the data would still reflect a tight labor market, though given the persisting rate cut pricing in futures markets, a significant decline in jobs growth could send fresh negative shockwaves to the US dollar, especially if the participation rate pulls lower as well. Powell tried to convince investors that rate cuts are not on the table at the moment, but his efforts proved fruitless, with investors currently providing a small probability of 13.5% for a 25bps rate cut in June while projecting an equivalent rate cut at some point in the fourth quarter.
USD/JPY levels to watch
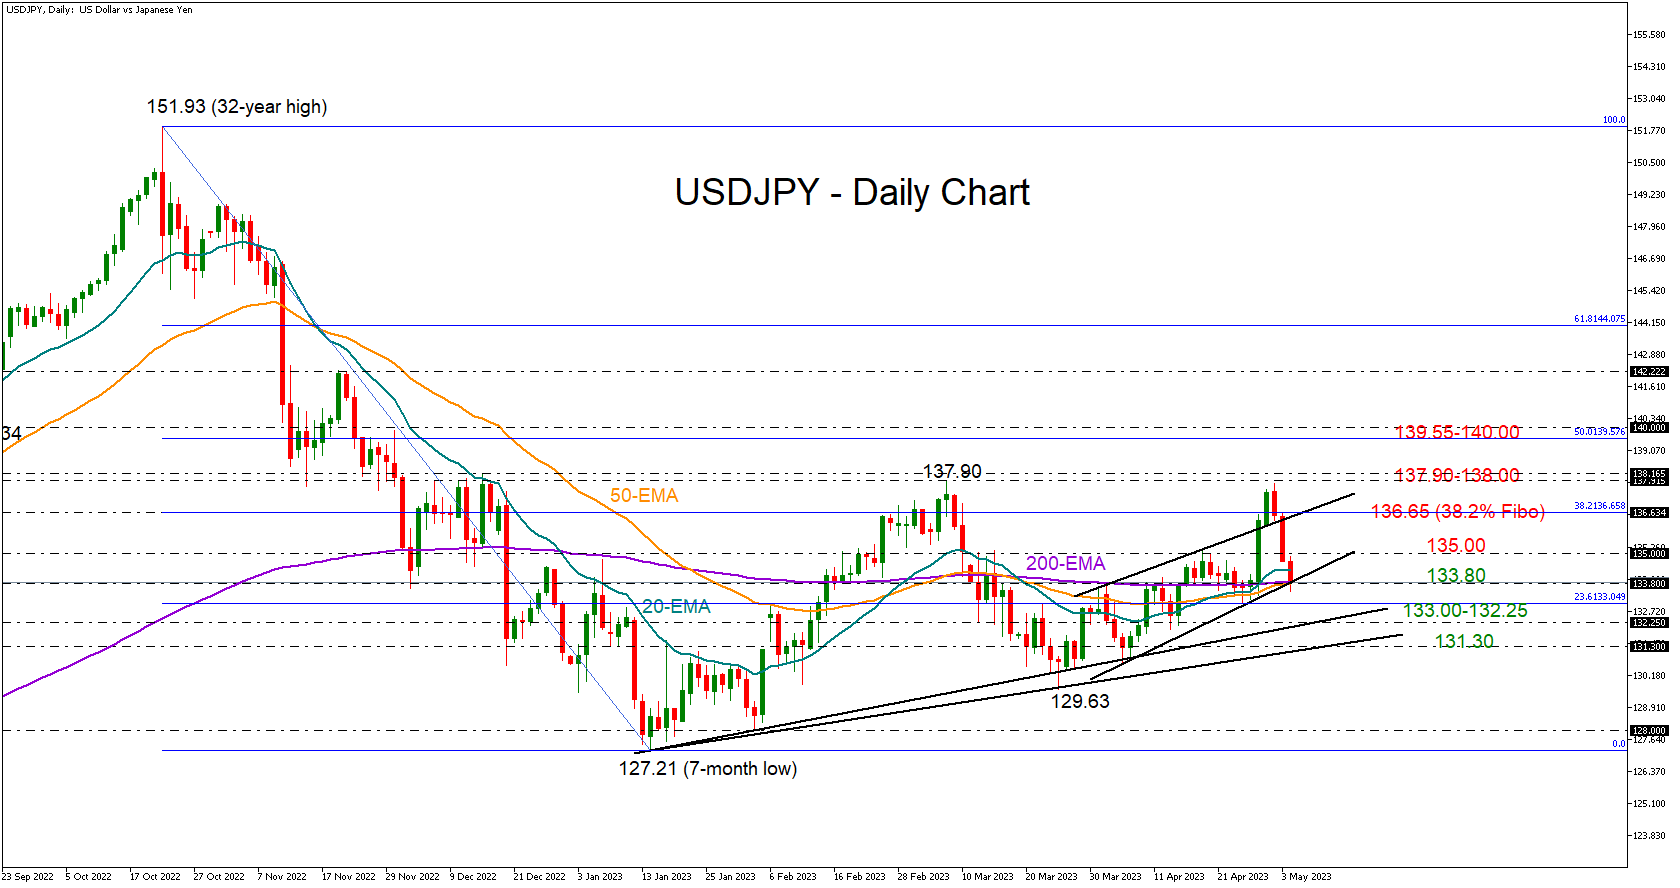
The group of dovish traders could grow further if the employment report misses forecasts, likely staging a new bearish wave in dollar/yen. The pair is testing the key 134.00-133.80 support region at the moment, a break of which could extend losses towards the former 133.00-132.25 support region and then down to 131.30.
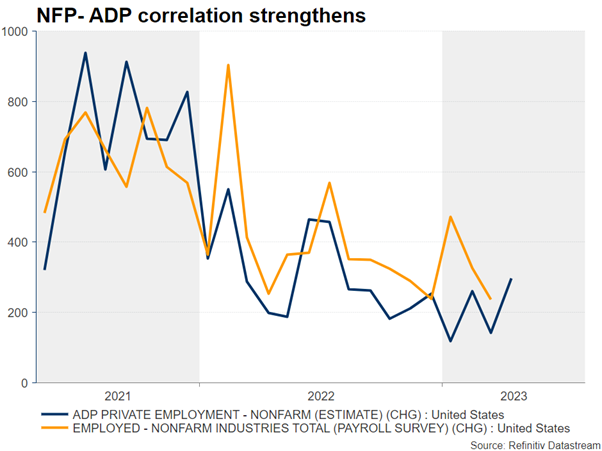
On the other hand, the improvement in the ISM employment indices and the remarkable spike in the private ADP employment report, which came in twice as high as analysts forecast, is feeding speculation that the outcome might arrive brighter than expected. It’s worthy to note that although the private ADP data has been a misleading proxy for the government’s comprehensive NFP report for some time now, the correlation between the two surveys has been improving over the past few months.
Technically, the data will need to be strong enough to help dollar/yen crawl back above 135.00. In this case, the pair may extend its recovery towards the 136.65 constraining. Yet, only a sustainable extension above 137.90-138.00 would switch the short- and medium-term outlook back to bullish.
Cliff Notes: An Event-Filled Week
It has been a busy but highly-informative week, with the RBA, FOMC and ECB all meeting and a slew of significant data releases in between.
Beginning in Australia, the RBA’s 25bp rate hike came as a surprise to ourselves and markets. Crucial to this decision was the Board’s interpretation of the Q1 CPI report, focussing on the strength of inflation amongst service components despite the moderation in the headline and trimmed mean measures seemingly running ahead of the Board’s expectations. With inflation rightly noted as being uncomfortably high, there was a greater emphasis on “the importance to returning inflation to target within a reasonable timeframe”. Note, a full update of the RBA’s forecasts was released as part of today’s May Statement on Monetary Policy.
Following the RBA’s decision, Chief Economist Bill Evans noted that, although the cash rate is currently at a level we believe will prove the peak for this cycle, the evolution of inflation and labour market outcomes represent a material risk for policy moving forward. Updated information on these indicators will be available prior to the August Board meeting. Our baseline expectation is for a further moderation in annual headline inflation (7.0% to 6.3%) and trimmed mean inflation (6.6% to 6.1%) in Q2, results which will allow the RBA to feel comfortable they are on track and allow policy to remain on hold. At the same time, the labour market is expected to remain very tight; so, should inflation not decelerate to an acceptable degree, the RBA may see cause to raise interest rates further.
Domestic data releases this week highlighted a diverging sectoral performance. Of note, nominal retail sales have only made a partial recovery so far this year, rising 0.4% in March to effectively be flat on a quarter-average basis. Given the persistence of price rises, a material contraction in inflation-adjusted sales over Q1 is likely and is therefore pointing to downside risk to household consumption as a whole, which we forecast will print an already-soft 0.3% in Q1. In contrast, the CoreLogic home value index lifted by 0.7% in April, with gains seemingly broadly-based across the nation, albeit led by Sydney where prices are up a stellar 2.7% since February. The evidence clearly indicates that the housing market’s correction phase has concluded. Meanwhile, the trade surplus surprised to the upside in March, widening $1.1bn to the second-highest surplus in the history of the series, $15.3bn.
Before moving offshore, it is worth mentioning that the Federal Budget will be released early next week. In our budget preview, we highlight that the budget position relative to October 2022 has improved materially given higher-than-anticipated commodity prices, inflation and strength in the labour market. Given the ongoing pressures facing households, there will be some flexibility to deliver targeted relief to those who are most vulnerable, but the Government is expected to show restraint by retaining the bulk of the windfall revenue gain.
To the US, the data out this week showed further evidence of an economy under pressure. The ISM manufacturing survey reported another contractionary outcome in April as production and new orders continued to decline. Employment showed resilience however, bouncing back to a marginally expansionary 50.2 after declining in February and March. Meanwhile, moderate growth continued to be seen in the service sector across both activity and employment. Of the other activity indicators released this week, construction and durable goods (a partial indicator of equipment investment) remained weak, while the JOLTS survey continued to point to a loss of momentum in new job creation without any evidence of wide-spread staff retrenchment.
Taking this information and the other data points available between the March and May FOMC meetings into consideration, the FOMC raised the fed funds rate by 25bps this week but then provided guidance consistent with a conditional pause. Notable in both the meeting decision statement and Chair Powell’s press conference was a focus on the accumulated impact of policy tightening to date and an awareness of the potential impact of recent bank closures and deposit flight on credit growth and standards. The full impact of monetary tightening and developments in the banking sector are not yet known; authorities have also made clear that regulation in the sector will be tightened hence, creating yet another headwind. For policy, the deceleration in inflation and wage pressures is therefore timely, giving the Committee another reason to be less concerned over inflation risk, and allowing more scope to consider the outlook for activity.
We remain of the view that, by December 2023, the FOMC will have enough evidence to believe that annualised inflation is back near target; with developments in the banking sector proving a persistent threat, the case to begin cutting will be proven, first by 25bps in December then by 50bps per quarter through 2024 and Q1 2025. By mid-2025, we expect a low of 2.125% to have been reached for the fed funds rate. This view is predicated on a mild recession in late-2023 and a slow recovery back to trend growth at end-2025. We view there being downside risks for activity throughout the period, while lingering upside risks for inflation should dissipate. The market is clearly more concerned over the immediate downside risks to activity, having now priced in 100bps of cuts by end-2023 and a continuation of those cuts in 2024.
In Europe, the ECB’s May meeting was the focus. While some Council members would have preferred to increase their key rates by 50bps, the consensus decision was for a 25bp rise. In contrast to the FOMC, President Lagarde made clear that the Council believe they have more to do to bring inflation back under control. While headline inflation has declined materially since its late-2022 peak, from near 11% to 7%, core price pressures have shown greater persistence, annual price growth excluding food and energy only 0.1ppts below and one month on from its peak. In recent months, both economic activity and the labour market have also shown greater resilience than was anticipated last year, giving the Council more reason to fear demand-driven inflation pressures.
The important offset to the above developments is that the latest quarterly Bank Lending Survey points to a “further substantial tightening” in standards and that “Demand for loans [has] decreased strongly”. This survey has a strong track record of guiding on the conditions faced by households and business and so, as the ECB do, should be given significant weight in assessments of the economy. All considered, it looks as though the ECB will continue their tightening cycle to mid-year then hold a tightening bias into the second half. By late in the year, the impact of policy and banking sector developments should see inflation risks abate and the case for easing develop. Cuts are still most likely to come in 2024; though the market is more concerned, with a modest probability of cuts priced in by year end. In either event, support for Euro is likely to remain in place through 2024 as policy and the balance of risks around the economic outlook favour Europe over the US.
Reversing course back to the beginning of the week, there is one further data point to discuss, China’s official NBS PMIs for April. The results of these surveys were mixed, with activity in the manufacturing sector pulling back in the month while services continued to experience robust growth. From the detail of the reports, it is clear that the weakness becoming evident in developed-world demand is impacting export orders. Further weakness has to be expected in coming months, although increasingly Asian markets and Chinese construction will have capacity to offset. Services meanwhile is likely to continue to see robust gains, with the household sector experiencing real income growth through 2022 into 2023, expansionary monetary policy (in stark contrast to the developed world), and with considerable pent-up demand to push through. A full discussion of China’s outlook relative to that of the US and Europe as well as the implications for FX markets is provided in our May Market Outlook, due for release today on Westpac IQ.
USD/JPY Extends Losses While Gold Spikes To New ATH
Key Highlights
- USD/JPY started a fresh decline after the Fed rate hike.
- It broke a key bullish trend line with support at 134.45 on the 4-hour chart.
- Gold price surged to a new all-time high at $2,079.84 on TitanFX.
- The US nonfarm payrolls could change by 179K in April 2023, down from 236K.
USD/JPY Technical Analysis
The US Dollar saw strong bullish moves above 136.00 against the Japanese Yen. USD/JPY traded to a new multi-week high at 137.77 before the bears appeared.
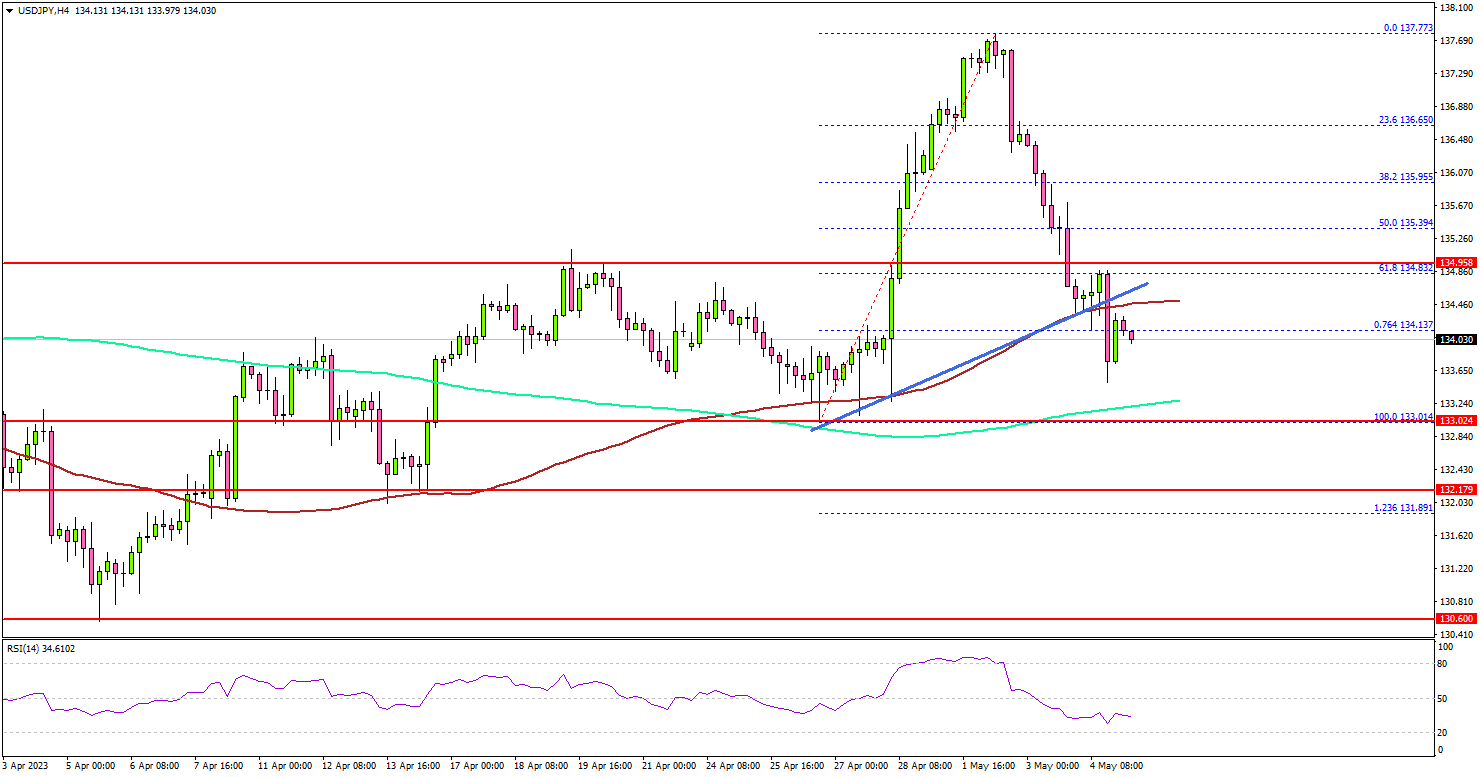
Looking at the 4-hour chart, the pair started a downside correction below the 137.50 support. The pair gained bearish momentum after the recent Fed rate hike to 5.25%. The pair declined heavily below the 136.00 support.
It broke a key bullish trend line with support at 134.45 on the 4-hour chart. The pair spiked below the 100 simple moving average (red, 4 hours).
The next major support is near the 133.25 level or the 200 simple moving average (green, 4 hours). If there is a downside break below the 133.25 support, the pair could accelerate lower. In the stated case, the pair might even test 132.00.
Immediate resistance on the upside is near the 134.80 level. The next key resistance is near the 135.40 level. A clear upside break and close above the 135.40 resistance might start a steady increase. The next key resistance is near the 136.00 zone. Any more gains might send the pair toward 137.00.
Looking at Gold price, there was a strong upward move above the $2,050 resistance and the price even traded to a new all-time high at $2,079.84.
Economic Releases
- US nonfarm payrolls for April 2023 – Forecast 179K, versus 236K previous.
- US Unemployment Rate for April 2023 - Forecast 6.7%, versus 6.7% previous.
- Canada’s employment Change for April 2023 – Forecast 20K, versus 34.7K previous.
- Canada’s Unemployment Rate for April 2023 - Forecast 5.1%, versus 5.0% previous.
USDCHF Rally Should Fail for More Downside
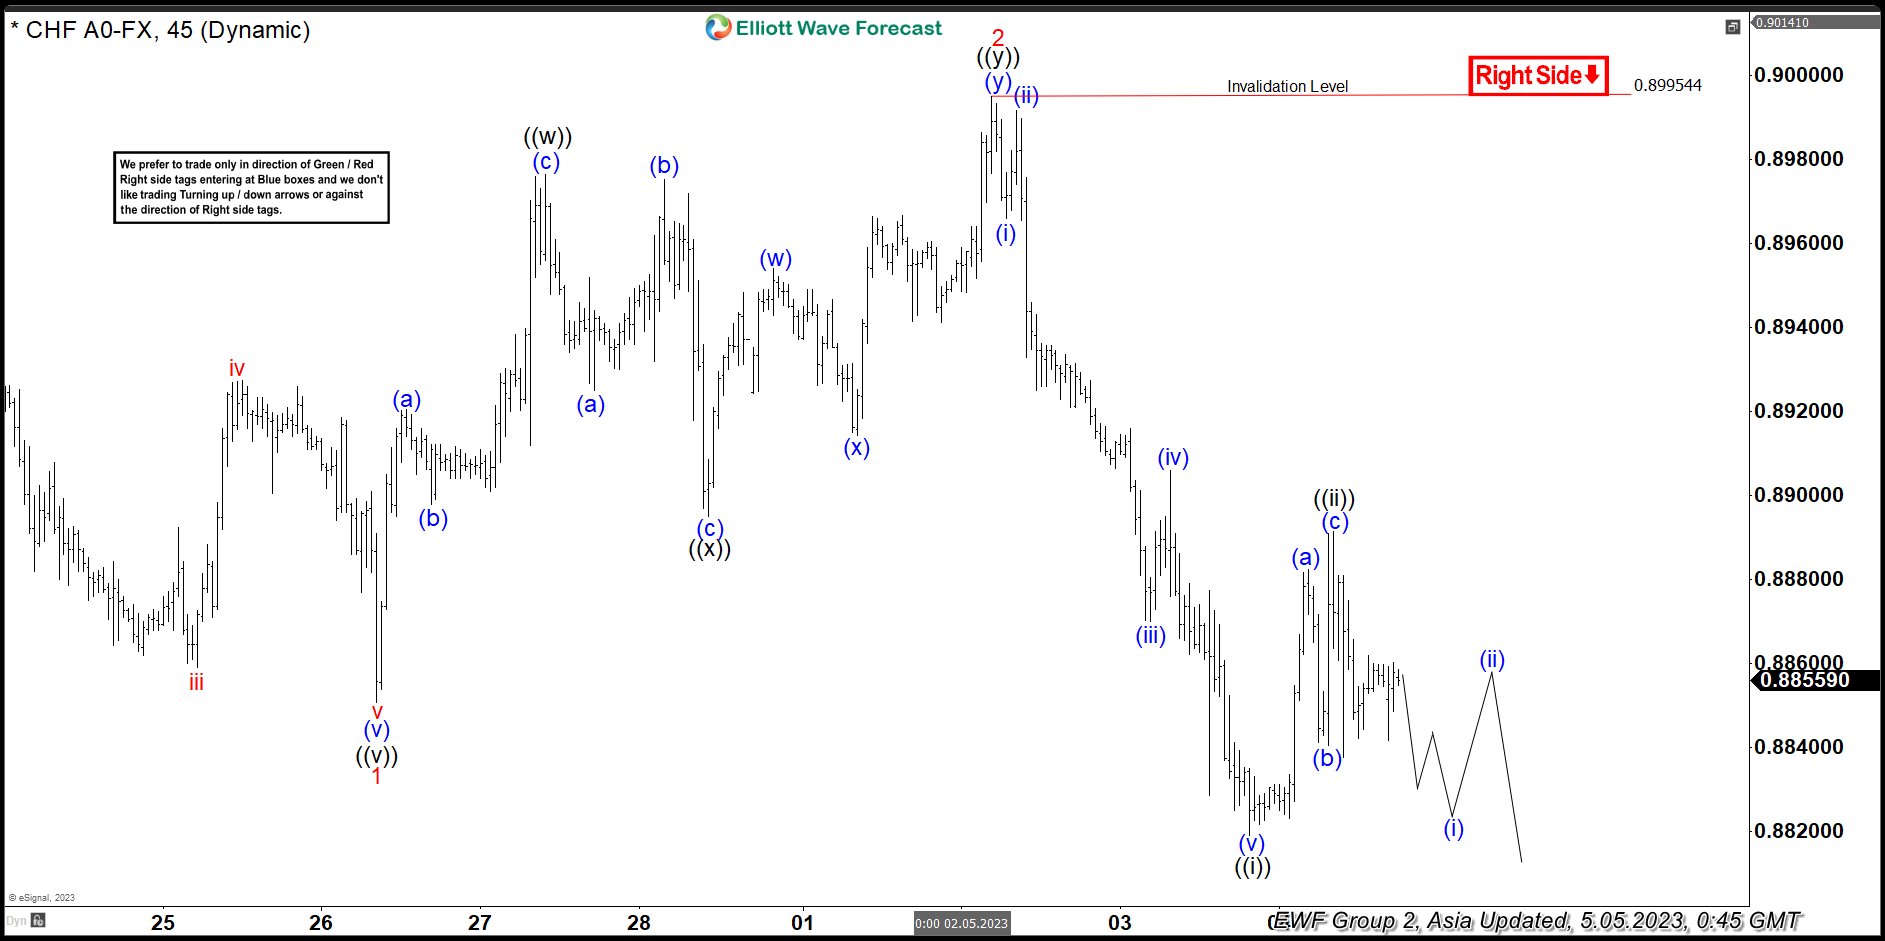
The 45 minutes chart below shows $USDCHF ended wave 1 at 0.885 and rally in wave 2 ended at 0.899. Internal subdivision of wave 2 unfolded as a double three Elliott Wave structure. Up from wave 1, wave (a) ended at 0.892 and wave (b) ended at 0.8898. Wave (c) higher ended at 0.8976 which completed wave ((w)). Pullback in wave ((x)) ended at 0.8895 with internal subdivision as a zigzag. Down from wave ((w)), wave (a) ended at 0.8925, wave (b) ended at 0.8975, and wave (c) lower ended at 0.8895. This completed wave ((x)) in higher degree. Wave ((y)) higher unfolded as a double three structure. Up from wave ((x)), wave (w) ended at 0.8954, wave (x) ended at 0.8914, and wave (y) ended at 0.899. This completed wave ((y)) of 2 in higher degree.
Pair has resumed lower in wave 3 and broken below wave 1 at 0.885. This confirms the next leg lower has started. Down from wave 2, wave (i) ended at 0.8966 and wave (ii) rally ended at 0.899. Pair turns lower in wave (iii) towards 0.887 and rally in wave (iv) ended at 0.89. It then extends lower again in wave (v) towards 0.8822 which completed wave ((i)). Rally in wave ((ii)) ended at 0.8891 with internal subdivision as a zigzag structure. Up from wave ((i)), wave (a) ended at 0.888, pullback in wave (b) ended at 0.884, and wave (c) higher ended at 0.88914. This completed wave ((ii)) in higher degree. Near term, as far as pivot at 0.899 stays intact, expect rally to fail in 3, 7, 11 swing for further downside.
USDCHF 45 Minutes Elliott Wave Chart
USDCHF Elliott Wave Video
https://www.youtube.com/watch?v=J1fBkucCpZI
EURCAD Buying The Dips At The Blue Box Area
Hello fellow traders. In this technical article we’re going to take a quick look at the Elliott Wave charts of EURCAD published in members area of the website. As our members know, the pair is showing bullish sequences in the cycle from the August 2022 low. Our team recommended members to avoid selling , while keep favoring the long side. Recently we got correction that reached our buying zone. The pair found buyers and made rally from the blue box as expected. In the further text we are going to explain the Elliott Wave Forecast and trading strategy.
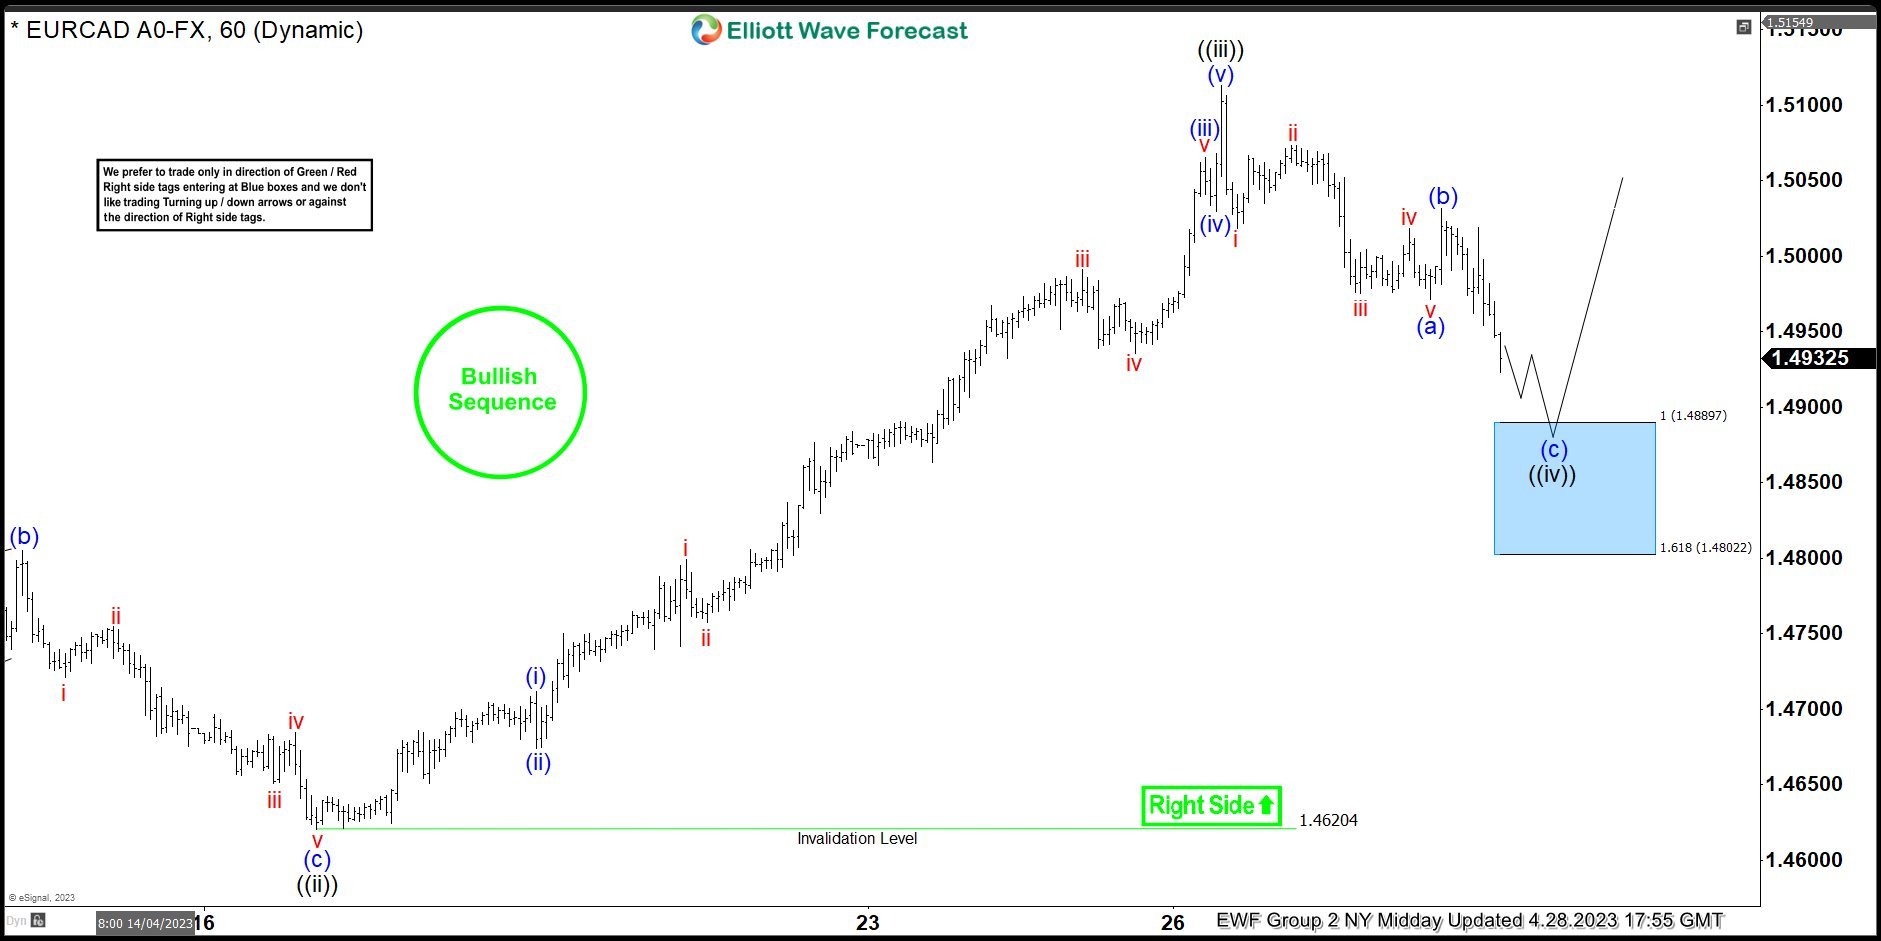
EURCAD Elliott Wave 1 Hour Chart 04.28.2023
The pair is giving us wave ((iv)) pull back that is unfolding as Zig Zag pattern. We expect to get more short term weakness toward 1.4889-1.4802 area which will be our buying zone. We don’t recommend selling the pair against the main bullish trend. Strategy is waiting for the price to reach blue box- equal legs zone, before entering the long trades again. Once bounce reaches 50 Fibs against the (b) blue high , we will make long position risk free ( put SL at BE) and take partial profits. Invalidation for the long trades is break of 1.618 fib ext : 1.4802
Quick reminder:
Our charts are easy to trade and understand:
Red bearish stamp+ blue box = Selling Setup
Green bullish stamp+ blue box = Buying Setup
Charts with Black stamps are not tradable. 🚫
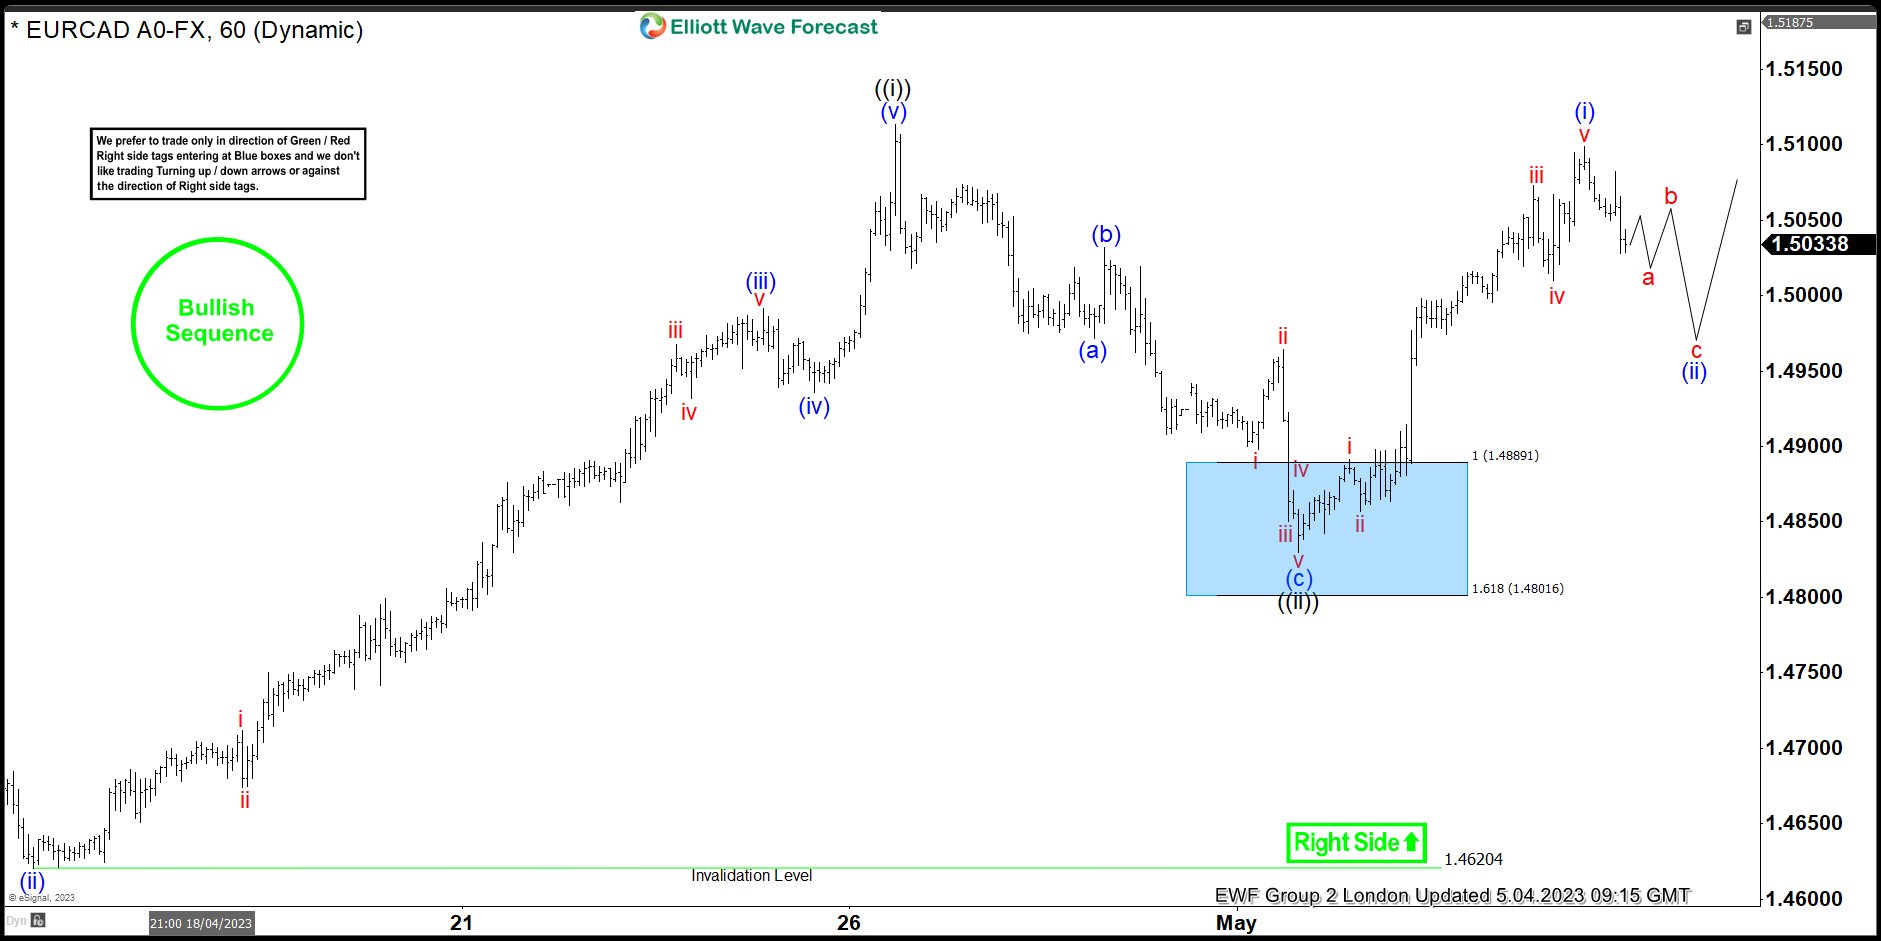
EURCAD Elliott Wave 1 Hour Chart 05.04.2023
EURCAD made decline in (c) leg and reached buying zone at 1.4889-1.4802 area( blue box) . Pull back completed at the 1.4841 low and we got a very good reaction from the buying zone. Members who took the long trade are enjoying profits now in a risk free positions. Currently EURCAD is giving us pull back against the 1.4841 low. If pivot at that low gives up, we can get a deeper pull back per alternative view.
NZDJPY Elliott Wave Forecasting The Path: Zig Zag Pattern
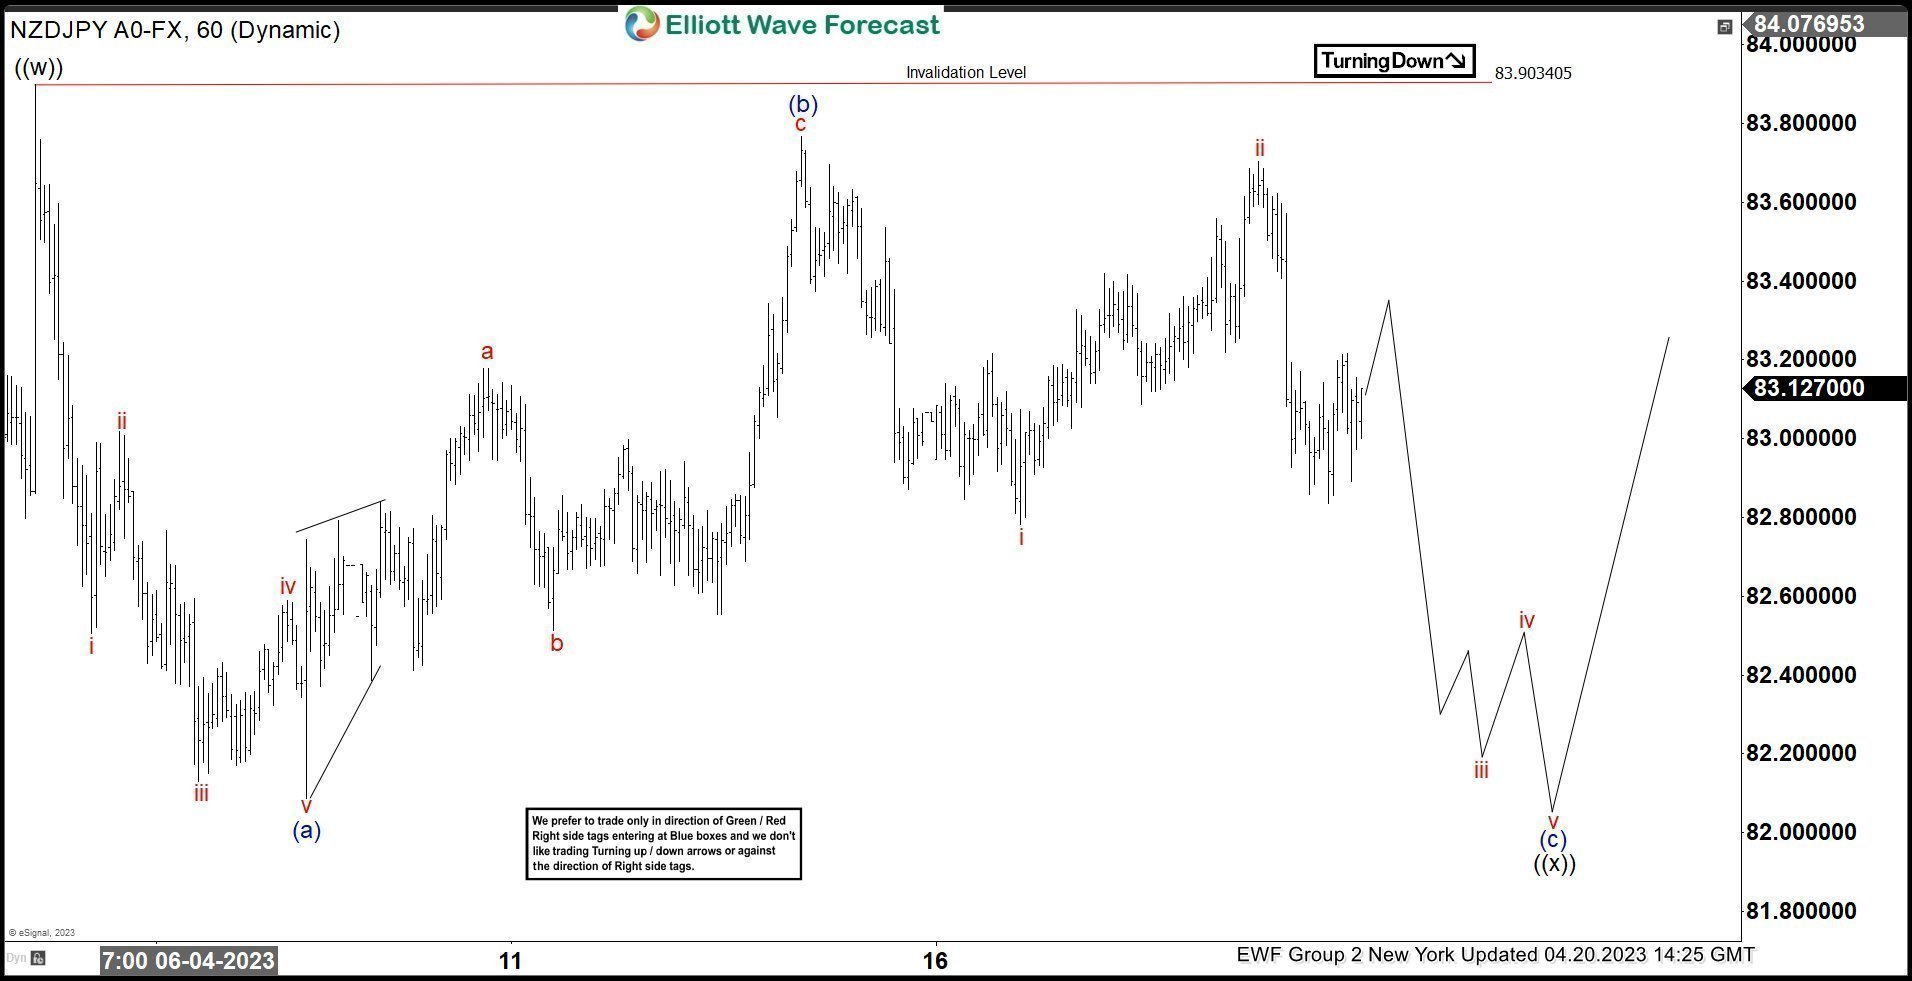
Hello fellow traders. In this article we’re going to take a quick look at the Elliott Wave charts of NZDJPY published in members area of the website. NZDJPY has given us recently ((x)) connector that unfolded as Elliott Wave Zig Zag pattern. Pull back completed right at the extreme zone as we expected. In the further text we are going to explain the Elliott Wave Forecast.
NZDJPY Elliott Wave 1 Hour Chart 04.20.2023
We are calling cycle from the 83.90 still in progress. We got 5 waves decline from the mentioned peak which suggests we ended only first leg of the correction. Wave (b) was deep recovery, however as far as the price stays below 83.72 high, we still expect to see another wave down which should also unfold as 5 waves. More precisely we are now in wave iii of (c) of ((x)). The pair is targeting 81.95-81.52 area. As our members know we target get by Fibonacci extension tool. Mentioned zone is equal legs area from the 83.90 peak
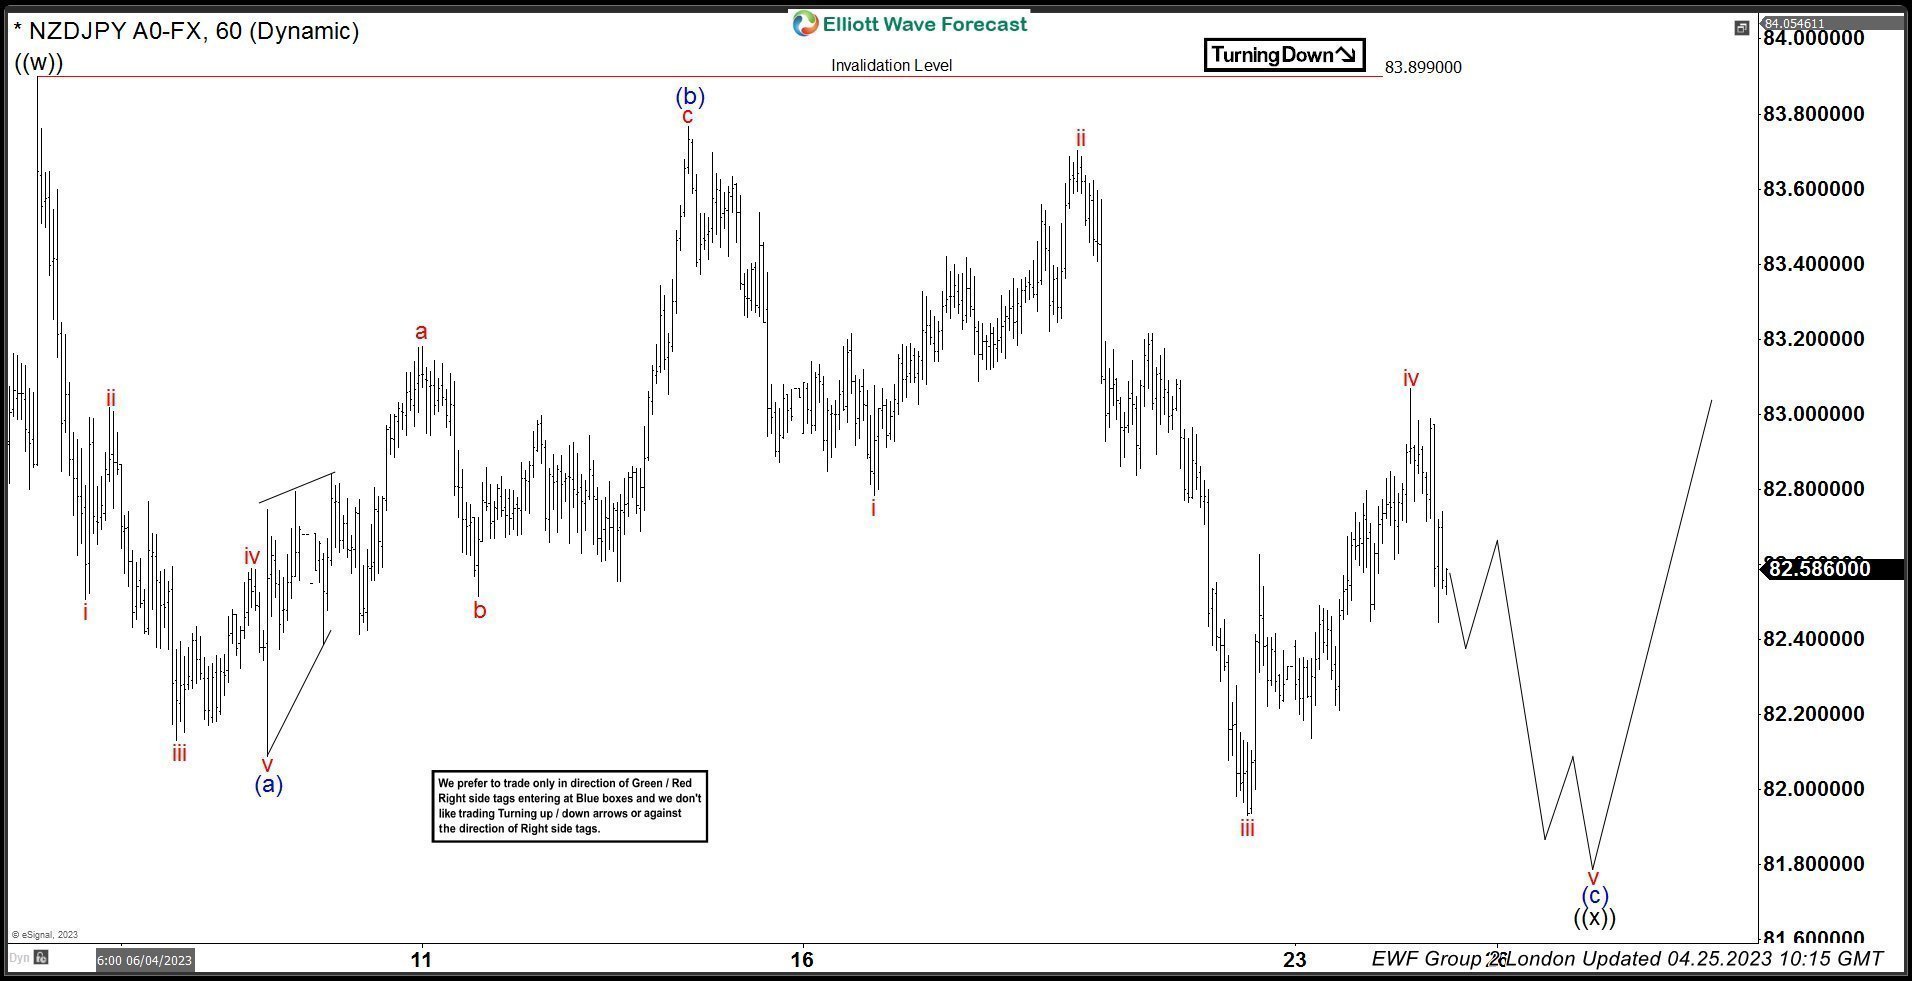
NZDJPY Elliott Wave 1 Hour Chart 04.25.2023
The pairs has given us decline toward proposed area. However at this moment (c) leg shows incomplete sequences. The pair is missing another wave down so we can count clear 5 waves in (c) blue wave. While below 83.05 high, we assume iv red is competed there and wave v is in progress. More precise target zone for wave v red would be inverse 1.236-1.618 fib ext of wave iv that comes at 81.69-81.27 area.
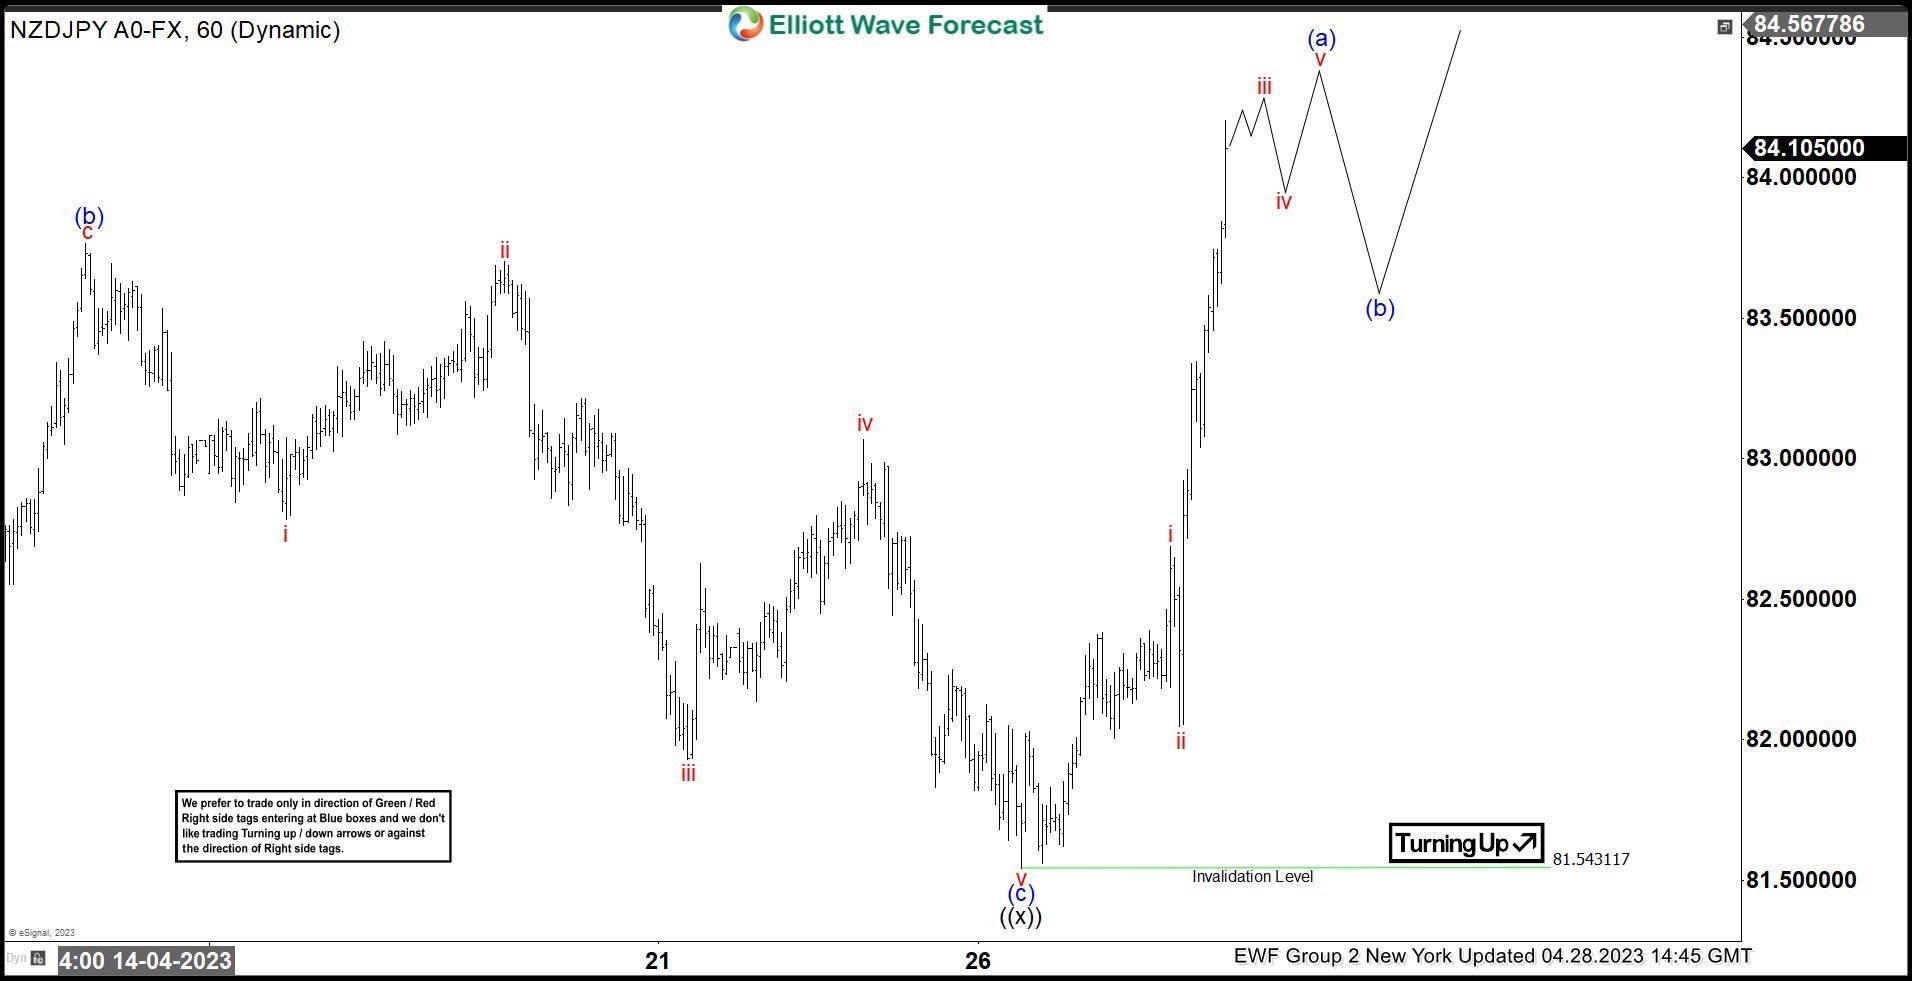
NZDJPY Elliott Wave 1 Hour Chart 04.28.2023
NZDJPY made another leg down as proposed toward 81.69-81.27 area . Wave ((x)) connector completed at 81.54 low. The pair has found buyers and made very good reaction higher as we expected. As far as 81.5 pivot holds, more upside can be seen in the pair.
XAU/USD: Bulls Taking a Breather Under Record Highs Zone Ahead of Fresh Push Higher
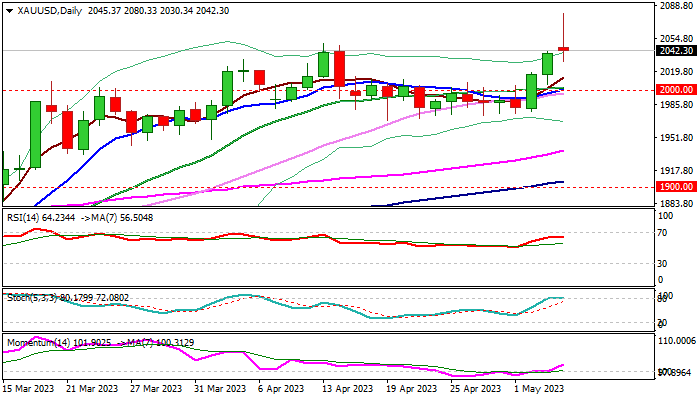
Gold price pulled back from the zone of record highs, which was tested for the third time in post-Fed acceleration, sparked by fresh safe haven demand following the central bank’s dovish steer in rate outlook and growing economic risks.
Gold price remains steady and well above $2000 level, with current easing so far seen as consolidation ahead of firm break of recent record high, which will signal an end of a multi-month range trading ($2074/$1614) and continuation of a larger uptrend.
A number of factors contribute to the bullish outlook for the metal, with primary drivers being Fed’s signals of pause in its policy tightening cycle, growing uncertainty about the US economic growth, hurt by high borrowing costs, increased stress in banking sector and concerns about US debt ceiling.
Markets await release of US labor report for April on Friday (180K f/c vs 236K in March) for further signals, with release at/below consensus to add to signals that growth in hiring remains in a downward trajectory (excluding spikes in July 2022 and Jan 2023) that would add to uncertainty and offer more support to the yellow metal.
Strong headwinds from the $2070/80 zone of record highs were expected, as the action has already pulled back twice after a failure in this area and daily studies are overbought, with limited consolidation to remain above strong support at $2000 zone (psychological, reinforced by converged 10/20DMA’s) to keep bulls intact.
Res: 2048; 2070; 2074; 2080.
Sup: 2030; 2015; 2000; 1978.
European Central Bank Slows The Pace Of Monetary Tightening
Summary
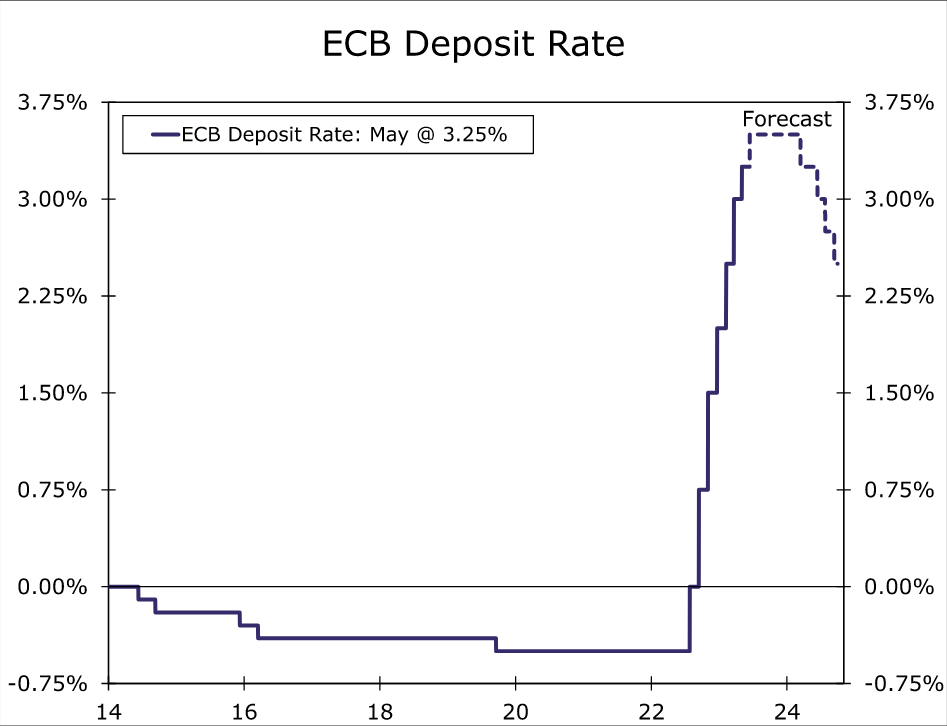
- The European Central Bank (ECB) offered its latest monetary policy assessment today, delivering a smaller rate increase than at previous meetings. In a widely expected move, the ECB raised its Deposit Rate by 25 bps to 3.25%. Meanwhile, the economic message was little changed, in that the ECB said the “inflation outlook continues to be too high for too long.”
- Today's ECB announcement does not meaningfully alter our outlook for Eurozone monetary policy. We think the ECB will deliver at least one more 25 bps rate hike in June, which would take the Deposit rate to 3.50%. If core inflation does not slow meaningfully in the months ahead, then further tightening beyond that remains a distinct possibility. The risks around our peak policy rate forecast of 3.50% remain tilted to the upside.
European Central Bank Slows The Pace Of Monetary Tightening
The European Central Bank (ECB) offered its latest monetary policy assessment today, delivering a smaller rate increase than at previous meetings. In a widely expected move, the ECB raised its Deposit Rate by 25 bps to 3.25%. Meanwhile, the economic message was little changed, in that the ECB said the “inflation outlook continues to be too high for too long.” The ECB said headline inflation has declined over recent months, but underlying price pressures remain strong.
With regard to balance sheet reduction, the ECB's action was also broadly as expected. The ECB said its Asset Purchase Programme portfolio is declining at €15 billion per month on average, and will continue to do so through until June 2023. The ECB said it expects to discontinue reinvestments under the APP as of July 2023. Given that APP redemptions are projected to average €23.3 billion in Q3-2023, €26.2 billion in Q4-2023, and €30.1 billion in Q1-2024, that represents a modest ramping up in the pace of balance sheet reduction. While the ECB's key interest rates and its balance sheet management are distinct elements of its monetary policy toolkit, the fact the ECB is quickening its balance sheet reduction doesn't sound to us like a central bank that has imminently reached the end of its rate hike cycle. Indeed, in the post meeting press conference ECB President Lagarde said it's "very clear that we are not pausing and that we know we have more ground to cover."
Finally, we also note a modest change in language that arguably gave today's announcement a modestly dovish tinge, perhaps in part explaining the decline in the euro and fall in Eurozone government bond yields immediately following the announcement. The ECB said “past rate increases are being transmitted forcefully to euro area financing and monetary conditions.” The use of the word “forceful” is new, and perhaps a reference to the bank lending survey earlier this week that showed tight lending standards and soft loan demand.
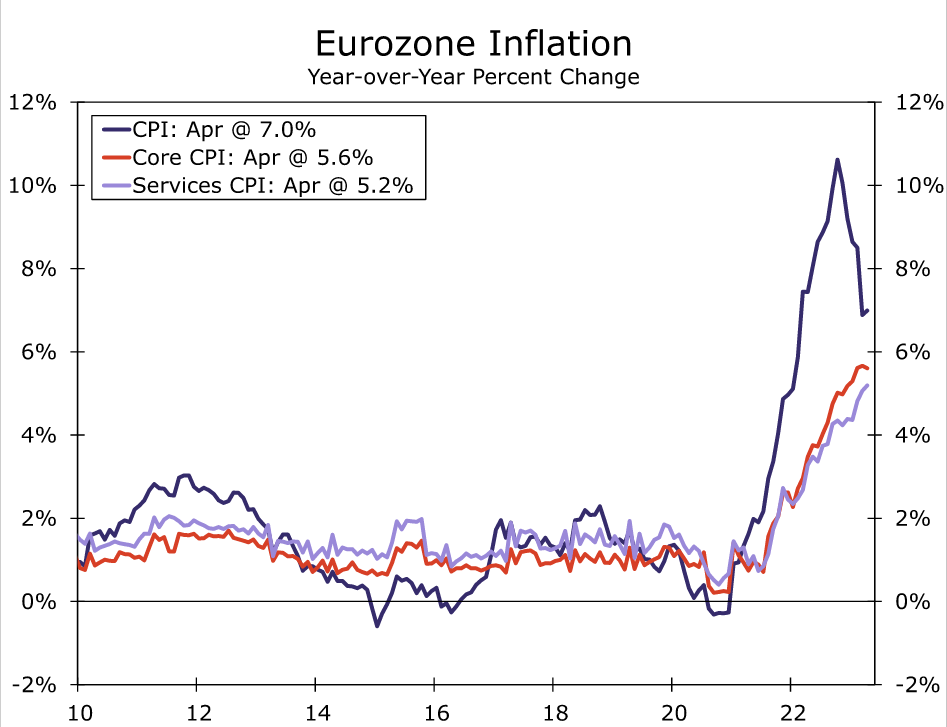
That said, today's ECB announcement does not meaningfully alter our outlook for Eurozone monetary policy. Even given some signs of tighter credit conditions and softer loan growth, we believe it will be inflation trends, and in particular underlying inflation trends, that will be most critical to the ECB's future policy actions. In that context, the Eurozone April CPI released earlier this week was something of a mixed bag. The headline CPI unexpectedly ticked higher to 7.0% year-over-year, and while the core CPI eased to 5.6%, services inflation actually quickened a touch to 5.2%. We think that this pace of inflation will be enough for the ECB to deliver at least one more 25 bps rate hike in June, which would take the Deposit rate to 3.50%. If core inflation does not slow meaningfully in the months ahead, then further tightening beyond that remains a distinct possibility. The risks around our peak policy rate forecast of 3.50% remain tilted to the upside.
Swiss Franc Hits 16-Week High on Dovish Fed
- Swiss inflation expected to rise to 0.5%
- Swiss franc’s appreciation raises concerns at SNB
- Fed raises rates by 25 bp
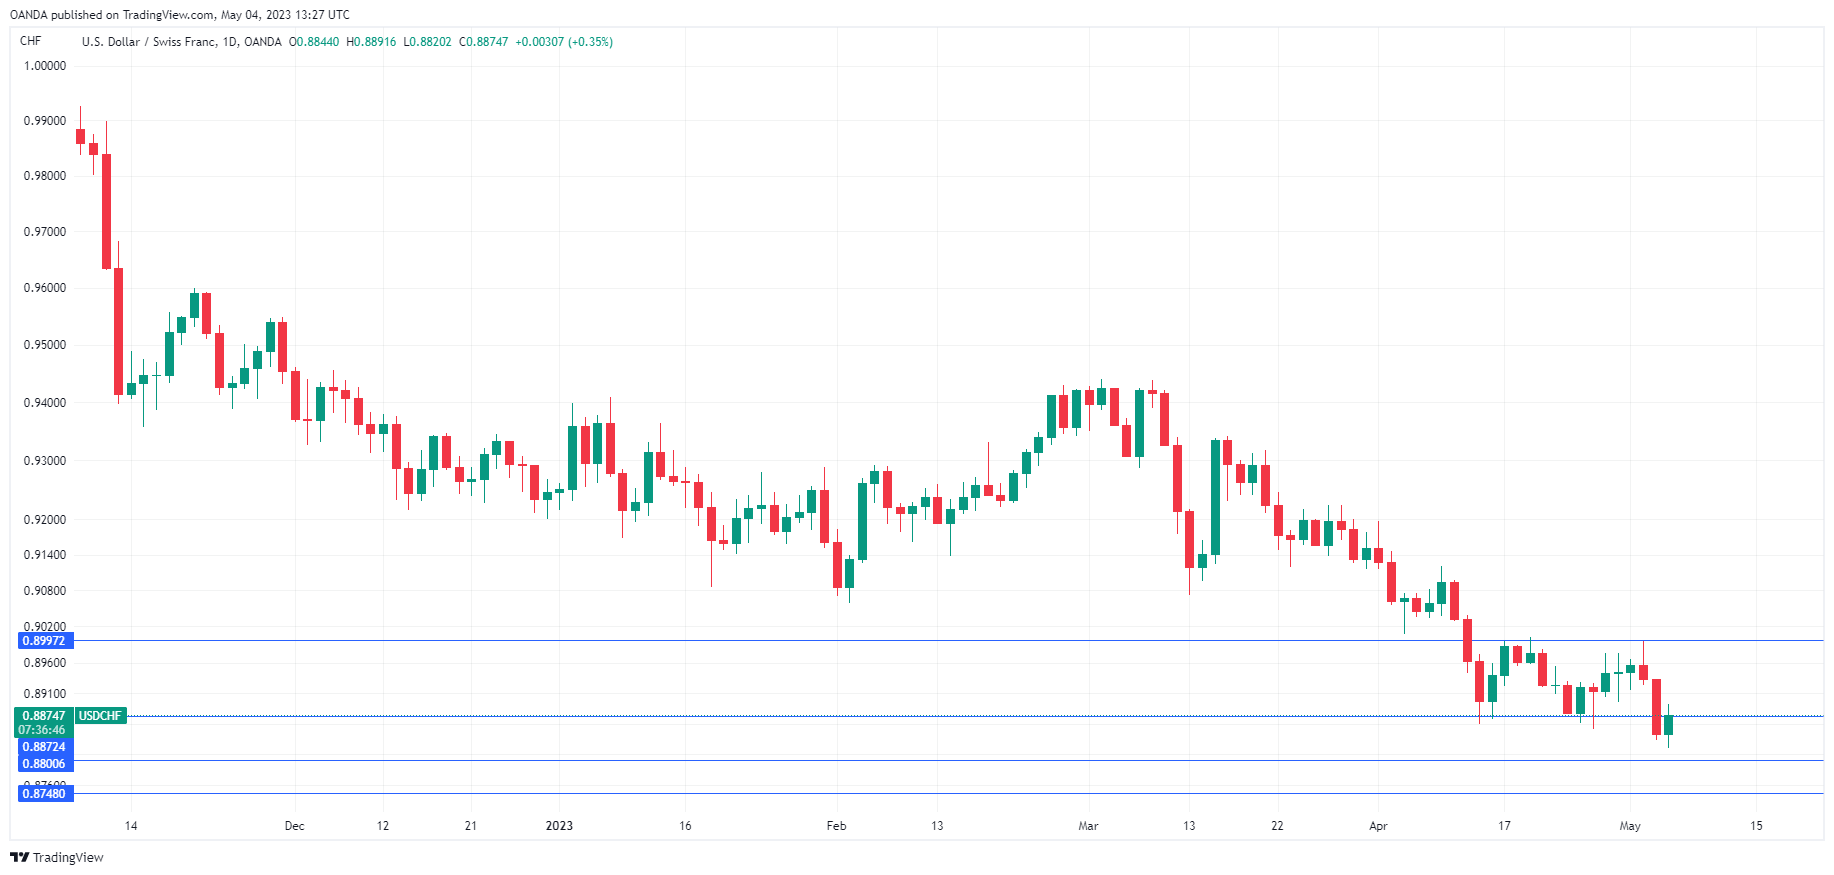
USD/CHF is trading at 0.8872 today, up 0.32%. The pair is recovering after the Swiss franc surged by 1% a day earlier.
USD/CHF falls close to 0.88 line
The Swiss franc pummelled the US dollar on Wednesday and USD/CHF fell as low as 0.8820 today, its lowest level since January 21st. The Swissie has gained around 200 points in just three weeks and 600 points since March 1st. This sharp upswing is likely raising eyebrows at the Swiss National Bank, which has little appetite for sharp exchange rate moves. The central bank keeps a careful eye on the value of the Swiss franc and has on occasion intervened in the currency markets, drawing sharp criticism from the US Treasury Department.
The SNB is concerned that if a rise in the value of the Swiss franc will dampen the economy, which is heavily reliant on exports. This week’s data reiterated that the Swiss economy is showing some signs of strain. Consumer confidence fell to -13 in the second quarter, down from -9 in Q1. Manufacturing PMI continued to decline, slowing from 47.0 to 45.3 in April. The week wraps up with CPI for April on Friday, CPI is expected to rise to 0.5% m/m, up from 0.2% in March. A rise in inflation could weigh on the Swiss franc, which would be good news for central bank policy makers.
Fed hikes by 25 bp
In the US, the Fed raised rates by 25-bp, as widely expected. Investors zoomed in the dovish rate statement, with the Fed removing the phrase “some additional” rate hikes might be needed. It changed the language to say that it would examine various factors in “determining the extent” that further hikes would be needed. The Swiss franc responded with sharp gains against the greenback.
Powell sounded more hawkish in the press conference, saying that higher interest rates had not sufficiently slowed down the economy, the labour market or inflation. Just to be crystal clear, Powell said that “inflation pressures continue to run high, and the process of getting inflation back down to 2% has a long way to go”. Powell said a rate cut was unlikely given high inflation, but the markets have priced in a rate cut in September at 80%.
USD/CHF Technical
- USD/CHF is testing resistance at 0.8872. The next resistance line is 0.8997
- 0.8800 and 0.8748 are providing support