

Sample Category Title
EUR/USD Edges Lower, ECB Expected to Raise Rates
- ECB expected to raise rates by 25 bp
- Federal Reserve hikes rates by 25 bp
- Powell signals a pause in June
EUR/USD is trading quietly on Thursday, ahead of the ECB decision later today.
ECB expected to hike, but by how much?
All eyes are the ECB, which is expected to raise rates at today’s meeting. The burning question remains will the central bank increase rates by 25 or 50 basis points? The eurozone April inflation report, published Tuesday, didn’t provide any insights as both the headline and core readings barely moved and were very close to the estimates. Headline CPI came in at 7.0% and the core rate at 5.6%, which is well above the 2% target and much too high for the ECB.
The Bank has been aggressive in its rate-tightening cycle and raised rates by 50 bp in March. Another 50-bp increase would help in the fight against inflation but also raise the likelihood of a recession due to the economy slowing down too abruptly. The markets are leaning closer to a 25-bp hike (80% probability) over a 50-bp increase (20% probability).
The Federal Reserve raised rates by 25 bp on Wednesday, to the surprise of no one. Investors were more interested in what is coming next, and Jerome Powell did hint that this hike would be the final one after 10 straight rate hikes. The rate statement was somewhat dovish, with the Fed removing the phrase “some additional” rate hikes might be needed. It changed the language that said that it would examine various factors in “determining the extent” that further hikes would be needed.
Powell sounded more hawkish in the press conference, saying that higher interest rates had not sufficiently slowed down the economy, the labour market or inflation. Just to be crystal clear, Powell said that “inflation pressures continue to run high, and the process of getting inflation back down to 2% has a long way to go”.
A rate cut, anyone? Powell said in his remarks that the inflation outlook does not support a rate cut. The markets disagree and have priced in an 81% rate cut in September (51% chance of 25-bp cut and 30% of 50-bp cut). Inflation is on its way down, but the pace of the deceleration could well determine if the Fed trims rates before the end of the year.
EUR/USD Technical
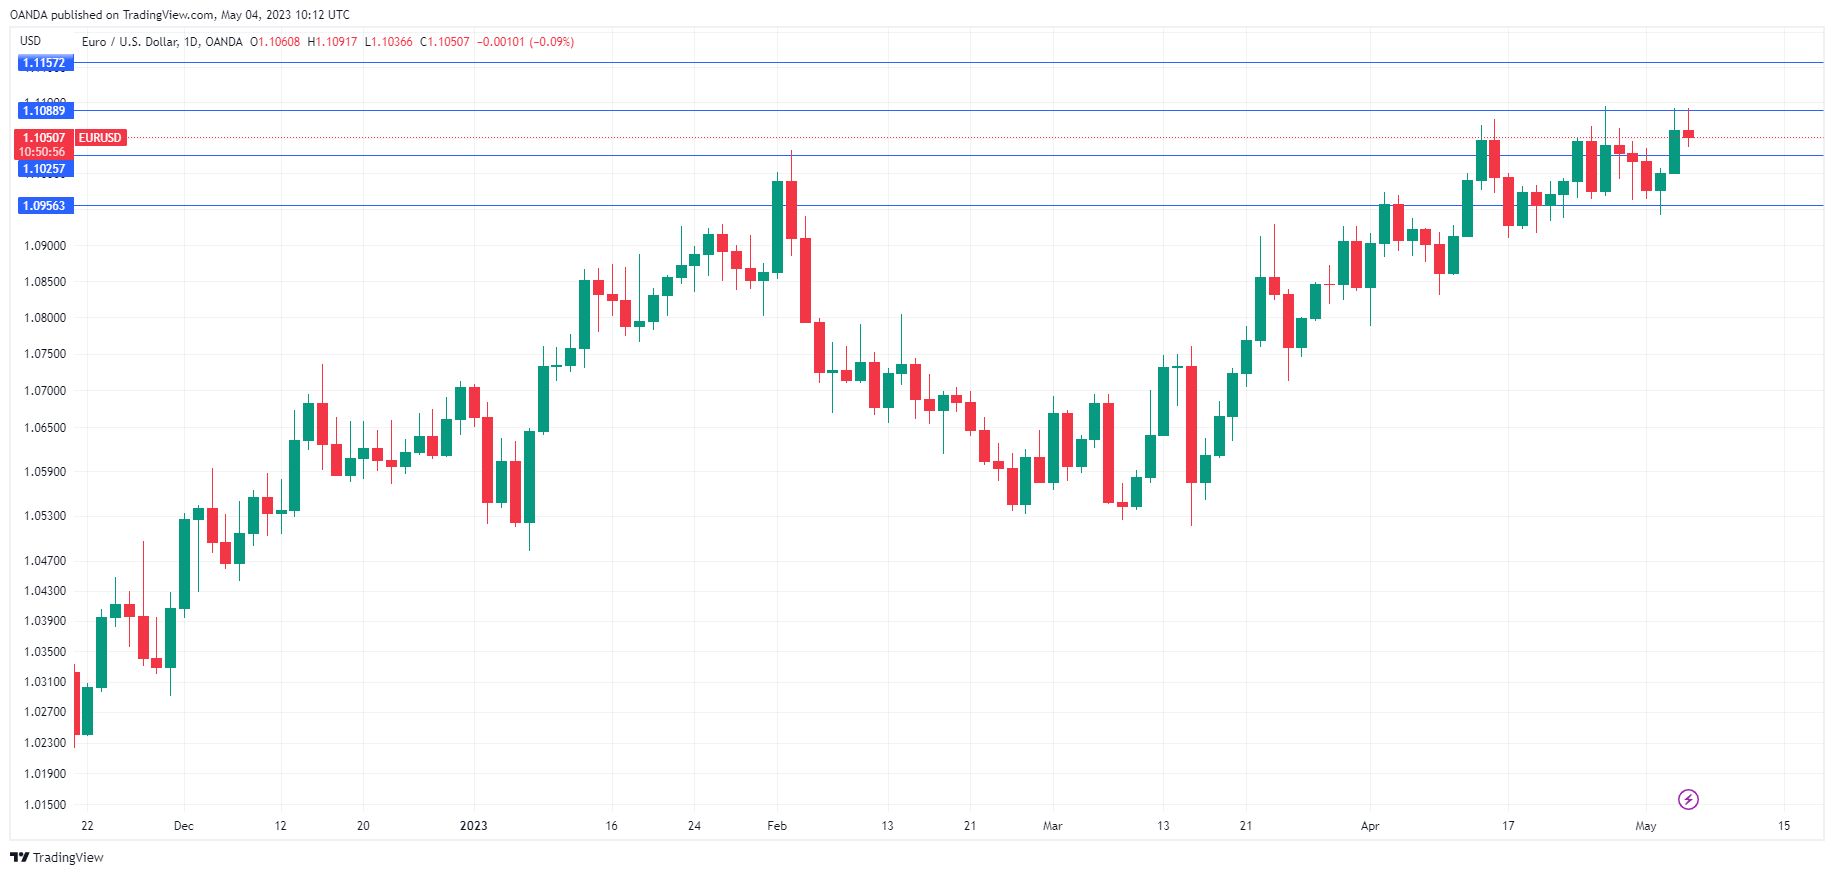
- EUR/USD tested resistance at 1.1088 earlier. The next resistance line is 1.1157
- 1.1025 and 1.0956 are providing support
EUR/CHF Daily Outlook
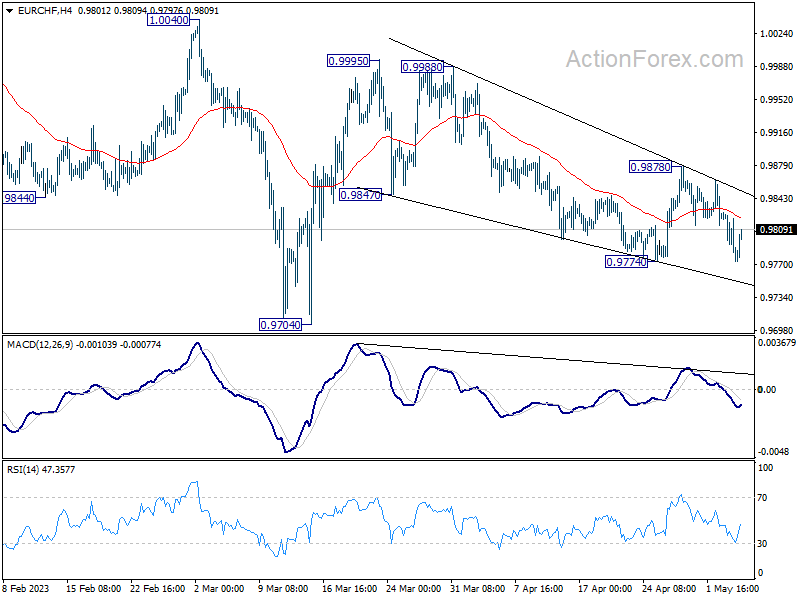
Daily Pivots: (S1) 0.9765; (P) 0.9797; (R1) 0.9813; More...
Despite a breach of 0.9774, EUR/CHF quickly recovered. While fall from 0.9995 could extend lower, downside should be contained well above 0.9704. Outlook is unchanged that whole correction from 1.0095 has completed at 0.9704. Break of 0.9878, and sustained trading above 55 D EMA (now at 0.9869) will affirm this bullish case, and target 0.9995 resistance next.
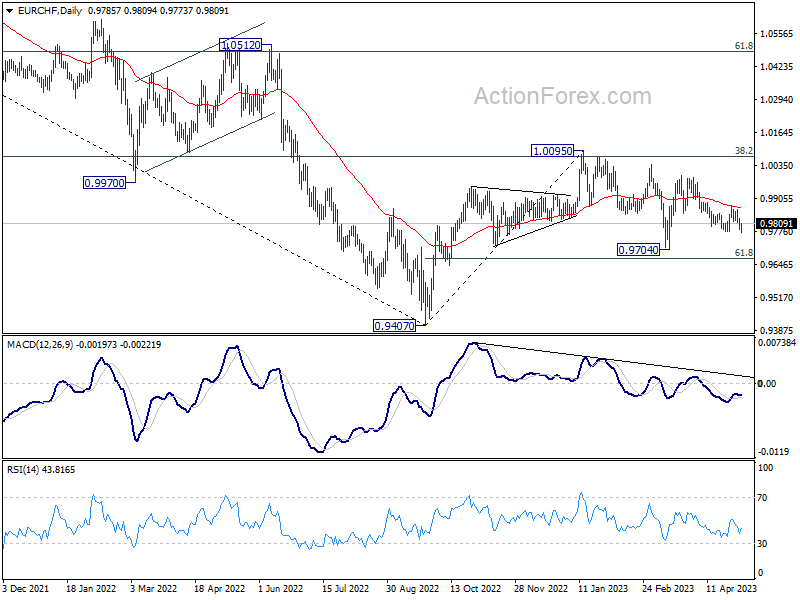
In the bigger picture, prior rejection by 55 W EMA (now at 0.9972) and 38.2% retracement of 1.1149 to 0.9407 at 1.0072 suggests that medium term outlook is staying bearish. That is, down trend from 1.2004 is not completed yet and is in favor to resume through 0.9407 at a later stage. However, decisive break of 1.0095 resistance will raise the chance of bullish trend reversal. Rise from 0.9407 should then target 1.0505 cluster resistance (2020 low at 1.0505, 61.8% retracement of 1.1149 to 0.9407 at 1.1484).
EUR/AUD Daily Outlook
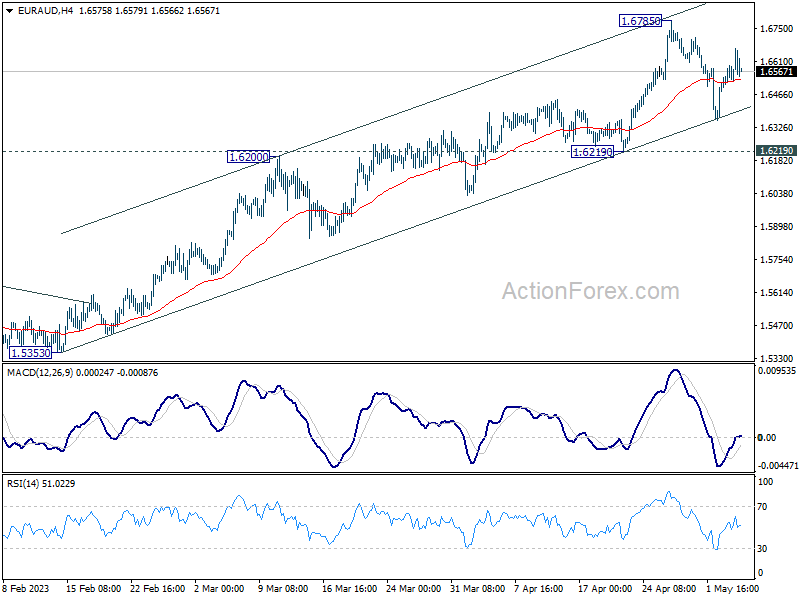
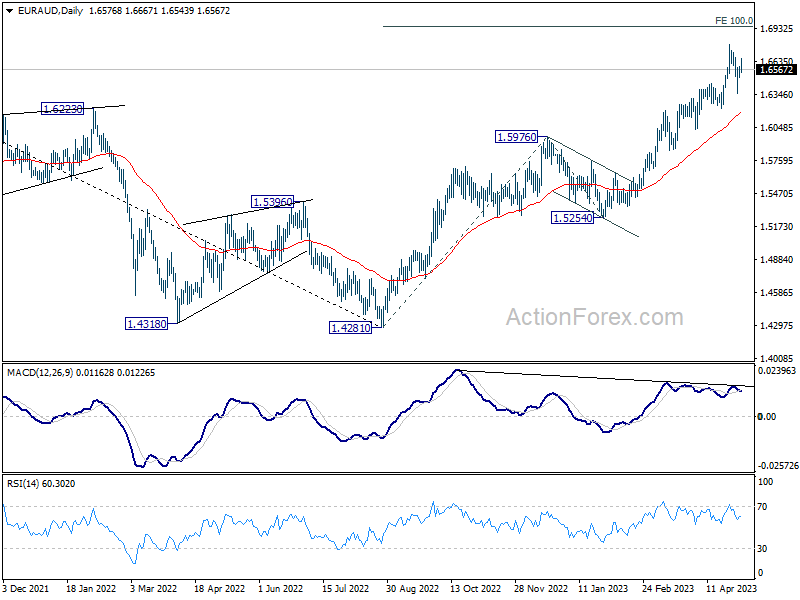
Daily Pivots: (S1) 1.6521; (P) 1.6557; (R1) 1.6614; More...
EUR/AUD is staying in consolidation from 1.6785 and intraday bias remains neutral. Further rally is expected as long as 1.6219 support holds. Break of 1.6785 will resume larger up trend to 100% projection of 1.4281 to 1.5976 from 1.5254 at 1.6949. However, firm break of 1.6219 will argue that larger correction is on the way.
In the bigger picture, the solid break of 1.6434 resistance argues that whole down trend from 1.9799 (2020 high) has completed at 1.4281 (2022 low). Further rise should be seen to 61.8% retracement of 1.9799 to 1.4281 at 1.7691 next. For now, outlook will stay bullish as long as 1.5976 resistance turned support holds, even in case of deep pull back.
EUR/JPY Daily Outlook
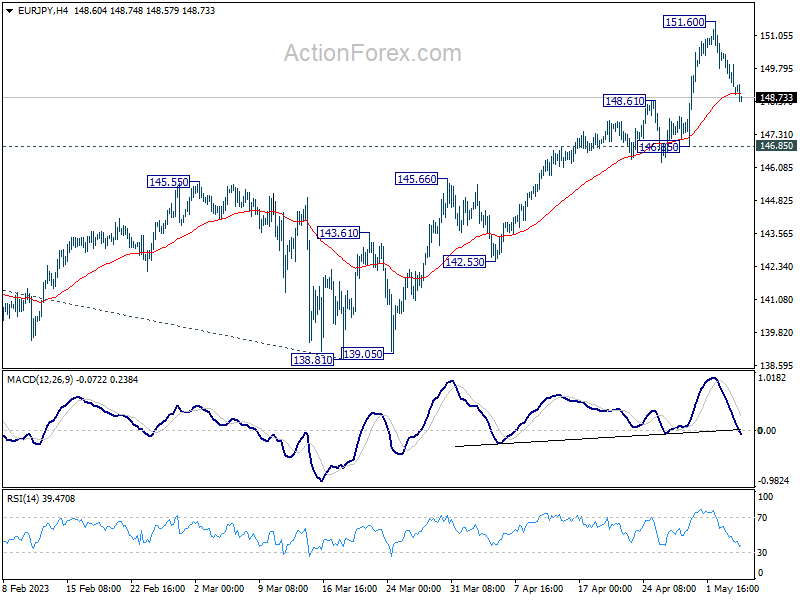
Daily Pivots: (S1) 148.68; (P) 149.53; (R1) 149.99; More....
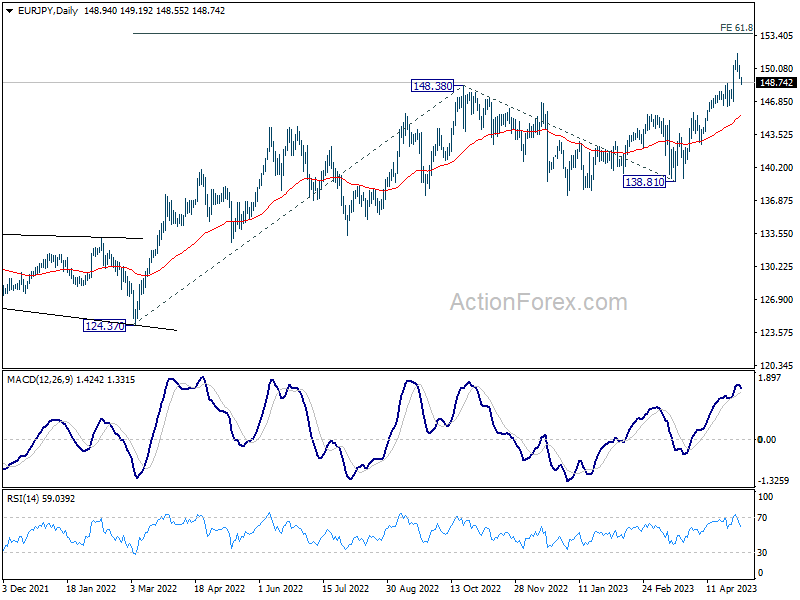
Intraday bias in EUR/JPY remains neutral as consolidation from 151.60 is extending. Downside should be contained by 146.85 support to bring another rally. Break of 151.60 will resume larger up trend to 153.64 projection level. Nevertheless, firm break of 146.85 will confirm short term topping and turn bias to the downside for deeper pull back.
In the bigger picture, current development indicates that rise from 114.42 (2020 low) is in progress. Next target is 61.8% projection of 124.37 to 148.38 from 138.81 at 153.64. Sustained break there will pave the way to 100% projection at 162.82. For now, medium term outlook will remain bullish as long as 138.81 support holds, even in case of deep pull back.
GBP/JPY Daily Outlook
Daily Pivots: (S1) 168.88; (P) 169.64; (R1) 170.14; More...
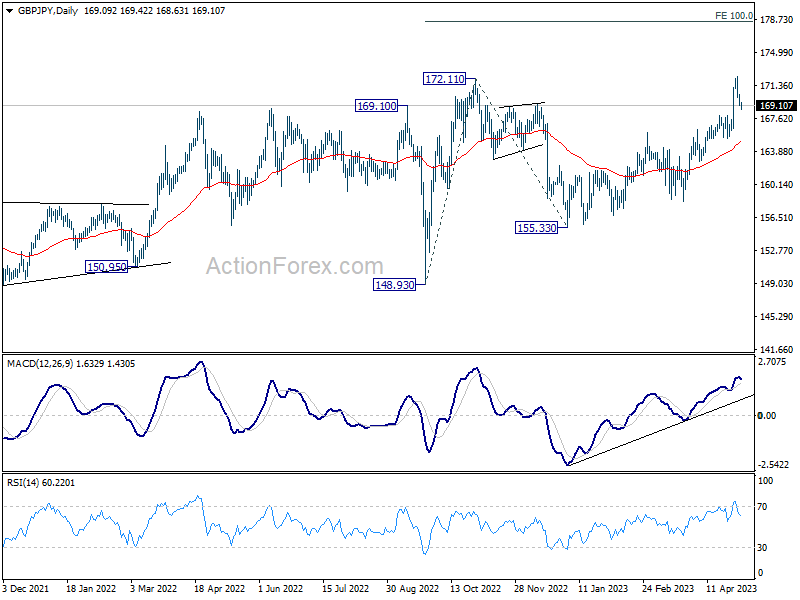
Intraday bias in GBP/JPY stays neutral for the moment as consolidation from 172.30 is extending. Downside should be contained by 167.95 resistance turned support to bring another rally. On the upside, break of 172.30 will resume larger up trend to 100% projection of 148.93 to 172.11 from 155.33 at 178.51. Nevertheless, firm break of 167.95 should confirm short term topping, and turn bias back to the downside for deeper pull back to 165.40 support instead.
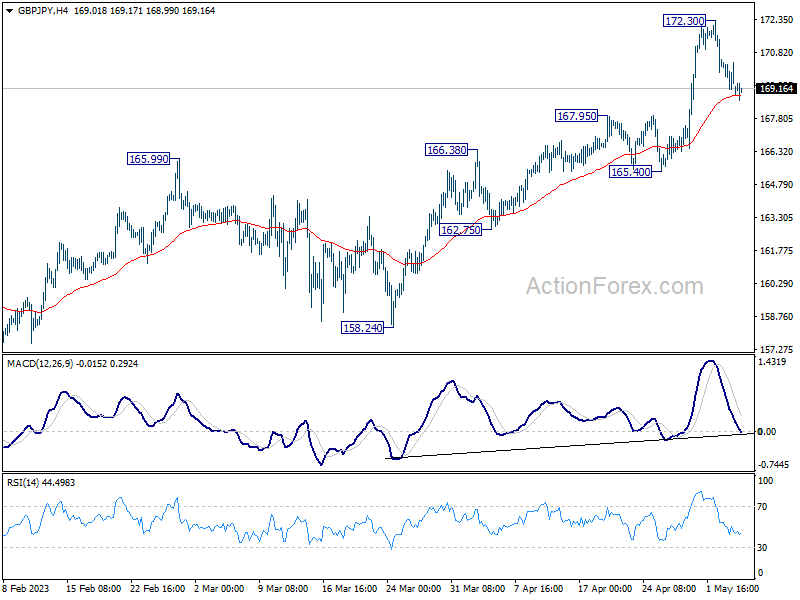
In the bigger picture, based on current momentum, up trend from 123.94 (2020 low) is likely ready to resume. Next target is 161.8% projection of 122.75 (2016 low) to 156.59 (2018 high) from 123.94 at 178.69. This will now remain the favored case as long as 165.40 support holds, in case of retreat.
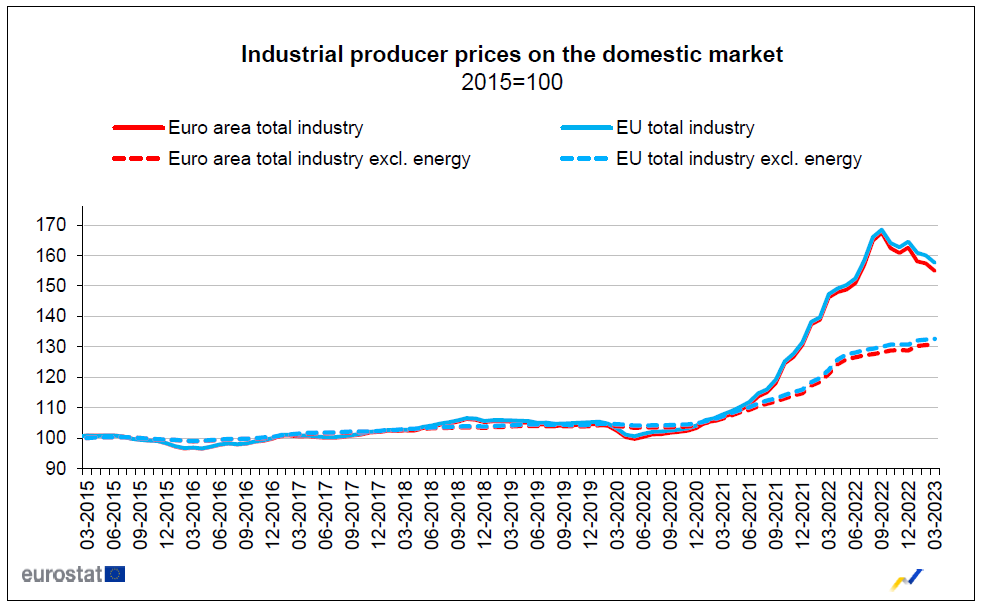
Eurozone PPI at -1.6%mom, 5.9% yoy in Mar
Eurozone PPI came in at -1.6% mom, 5.9% yoy in March, versus expectation of -1.4% mom, 5.9% yoy. For the month, industrial producer prices decreased by -4.8% in energy sector and by -0.4% for intermediate goods, while prices increased by 0.2% for capital goods, by 0.3% for durable consumer goods and by 0.9% for non-durable consumer goods. Prices in total industry excluding energy increased by 0.2%.
EU PPI came in at -1.5% mom, 7.0% yoy. The largest monthly decreases in industrial producer prices were recorded in Greece (-7.3%), Ireland (-4.6%) and Lithuania (-4.0%), while the highest increases were observed in Cyprus (+2.4%), France (+2.0%) and Croatia (+0.5%).
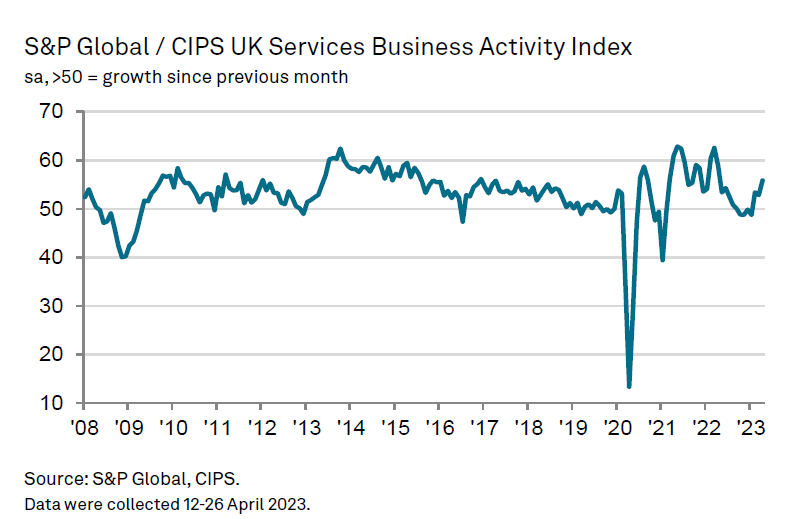
UK PMI services finalized at 55.9, reignited inflationary pressures
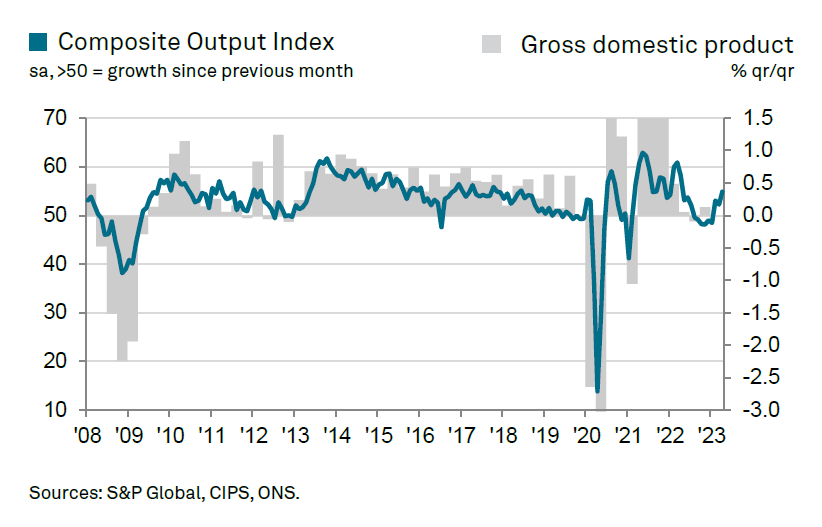
UK PMI Services were finalized at 55.9 in April, marking a significant increase from March's 52.9 and the highest reading since April 2022. S&P Global highlighted that demand conditions continued to improve, with higher salary payments contributing to steeper cost inflation. PMI Composite was finalized at 54.9, up from March's 52.2.
Tim Moore, Economics Director at S&P Global Market Intelligence, stated, "A strong rate of service sector growth meant that the UK economy started the second quarter of 2023 in positive fashion. Overall private sector output expanded at the fastest pace for one year, despite another fall in manufacturing production during April."
Moore added that service providers experienced the steepest upturn in new work for 13 months, as resilient consumer spending combined with a turnaround in demand for business services to boost overall order books. However, he also noted that the swift rebound in customer demand appears to have reignited inflationary pressures, with around 34% of the survey panel reporting a rise in their prices charged in April, roughly three times higher than the pre-pandemic average.
US 30 Cash Index Almost Ripe for a Decent Pullback
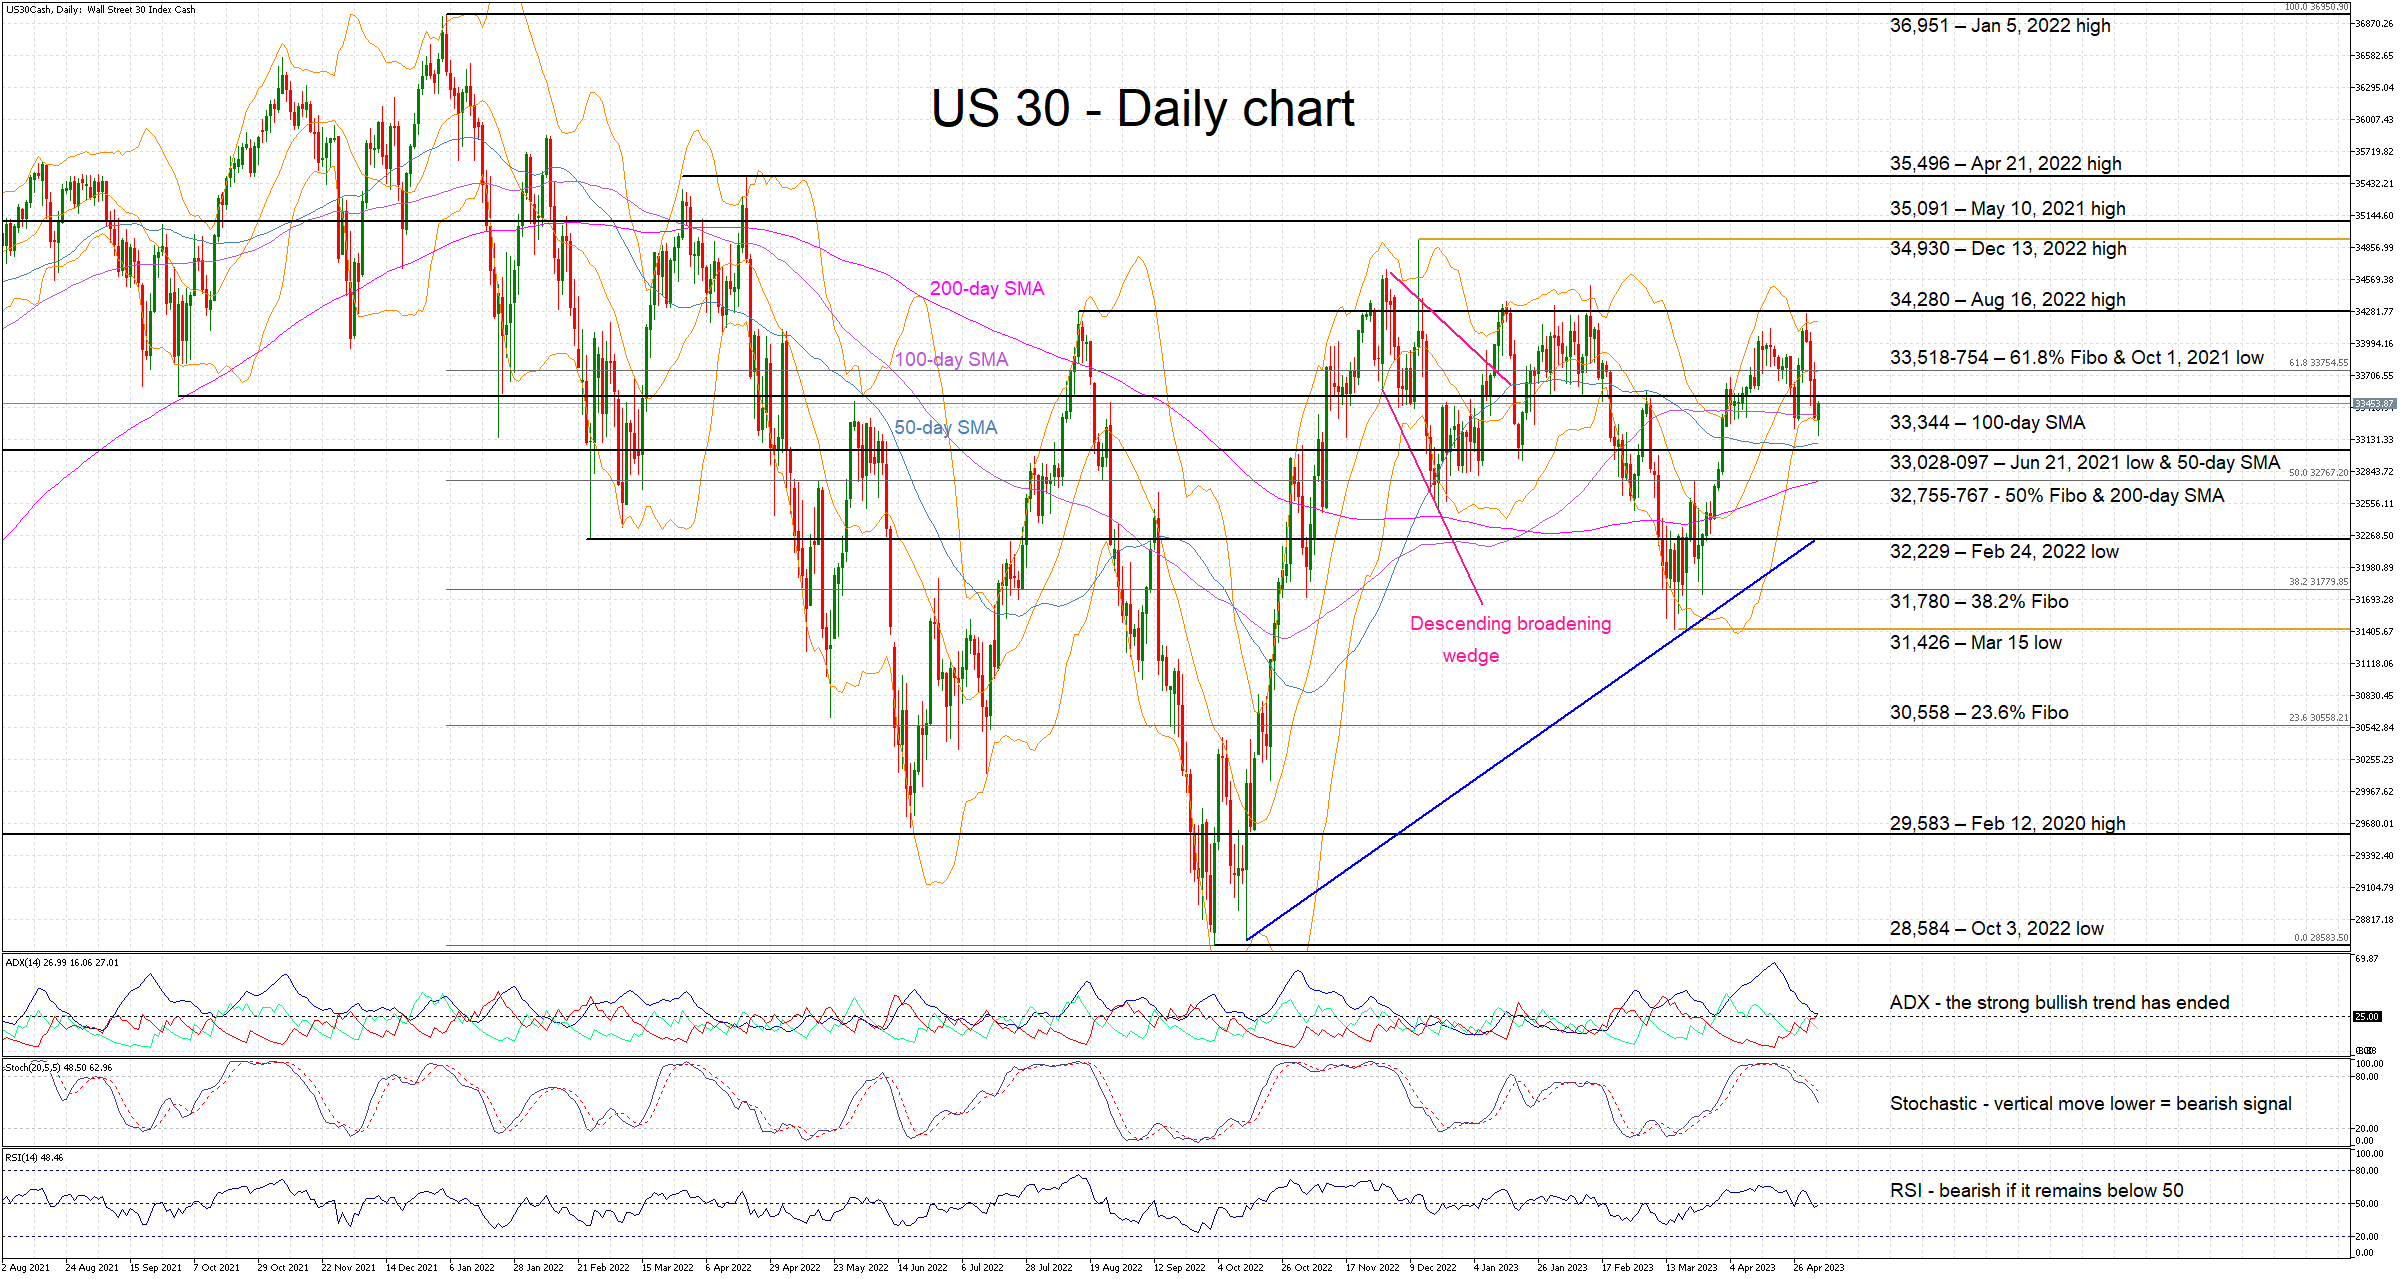
The US 30 cash index has once again failed to convincingly break above the 34,280 level prompting a small pullback. This is the sixth time that the bulls have not achieved an upwards breakout in the past 10 months, thus raising questions of their true ability to dictate market movements.
The index is edging higher today, but the momentum indicators seem to favour the bears at this juncture. The Average Directional Movement Index (ADX) confirms that the short-term bullish trend from the mid-March lows has ended, and the RSI has dipped again below its 50-threshold. More interestingly, the stochastic oscillator is moving lower in an almost vertical fashion revealing a decent bearish tendency.
Should the bears take advantage of the favourable environment and break the 100-day simple moving average (SMA), they would come up against the busy 33,028-33,097 area set by the June 21, 2021 low and the 50-day SMA. Even lower, the key 32,755-767 range, defined by the 50% Fibonacci retracement of the January 5, 2022 – October 3, 2022 downtrend and 200-day SMA respectively, is bound to prove tougher to crack.
On the other hand, the bulls crave for another retest of the August 16, 2022 high at 34,280, but they firstly have to break the 33,518-754 area populated by the 61.8% Fibonacci retracement and the October 1, 2021 low. Even higher, the twin December 13, 2022 and May 10, 2021 highs at 34,930 and 35,091 respectively would clearly test their resolve.
To sum up, the repeated failures at the 34,280 level have opened the door to US 30 bears for a sizeable pullback, especially as the overall technical picture appears to favour them.
WTI Oil Futures Plummet to Fresh 17-month Low
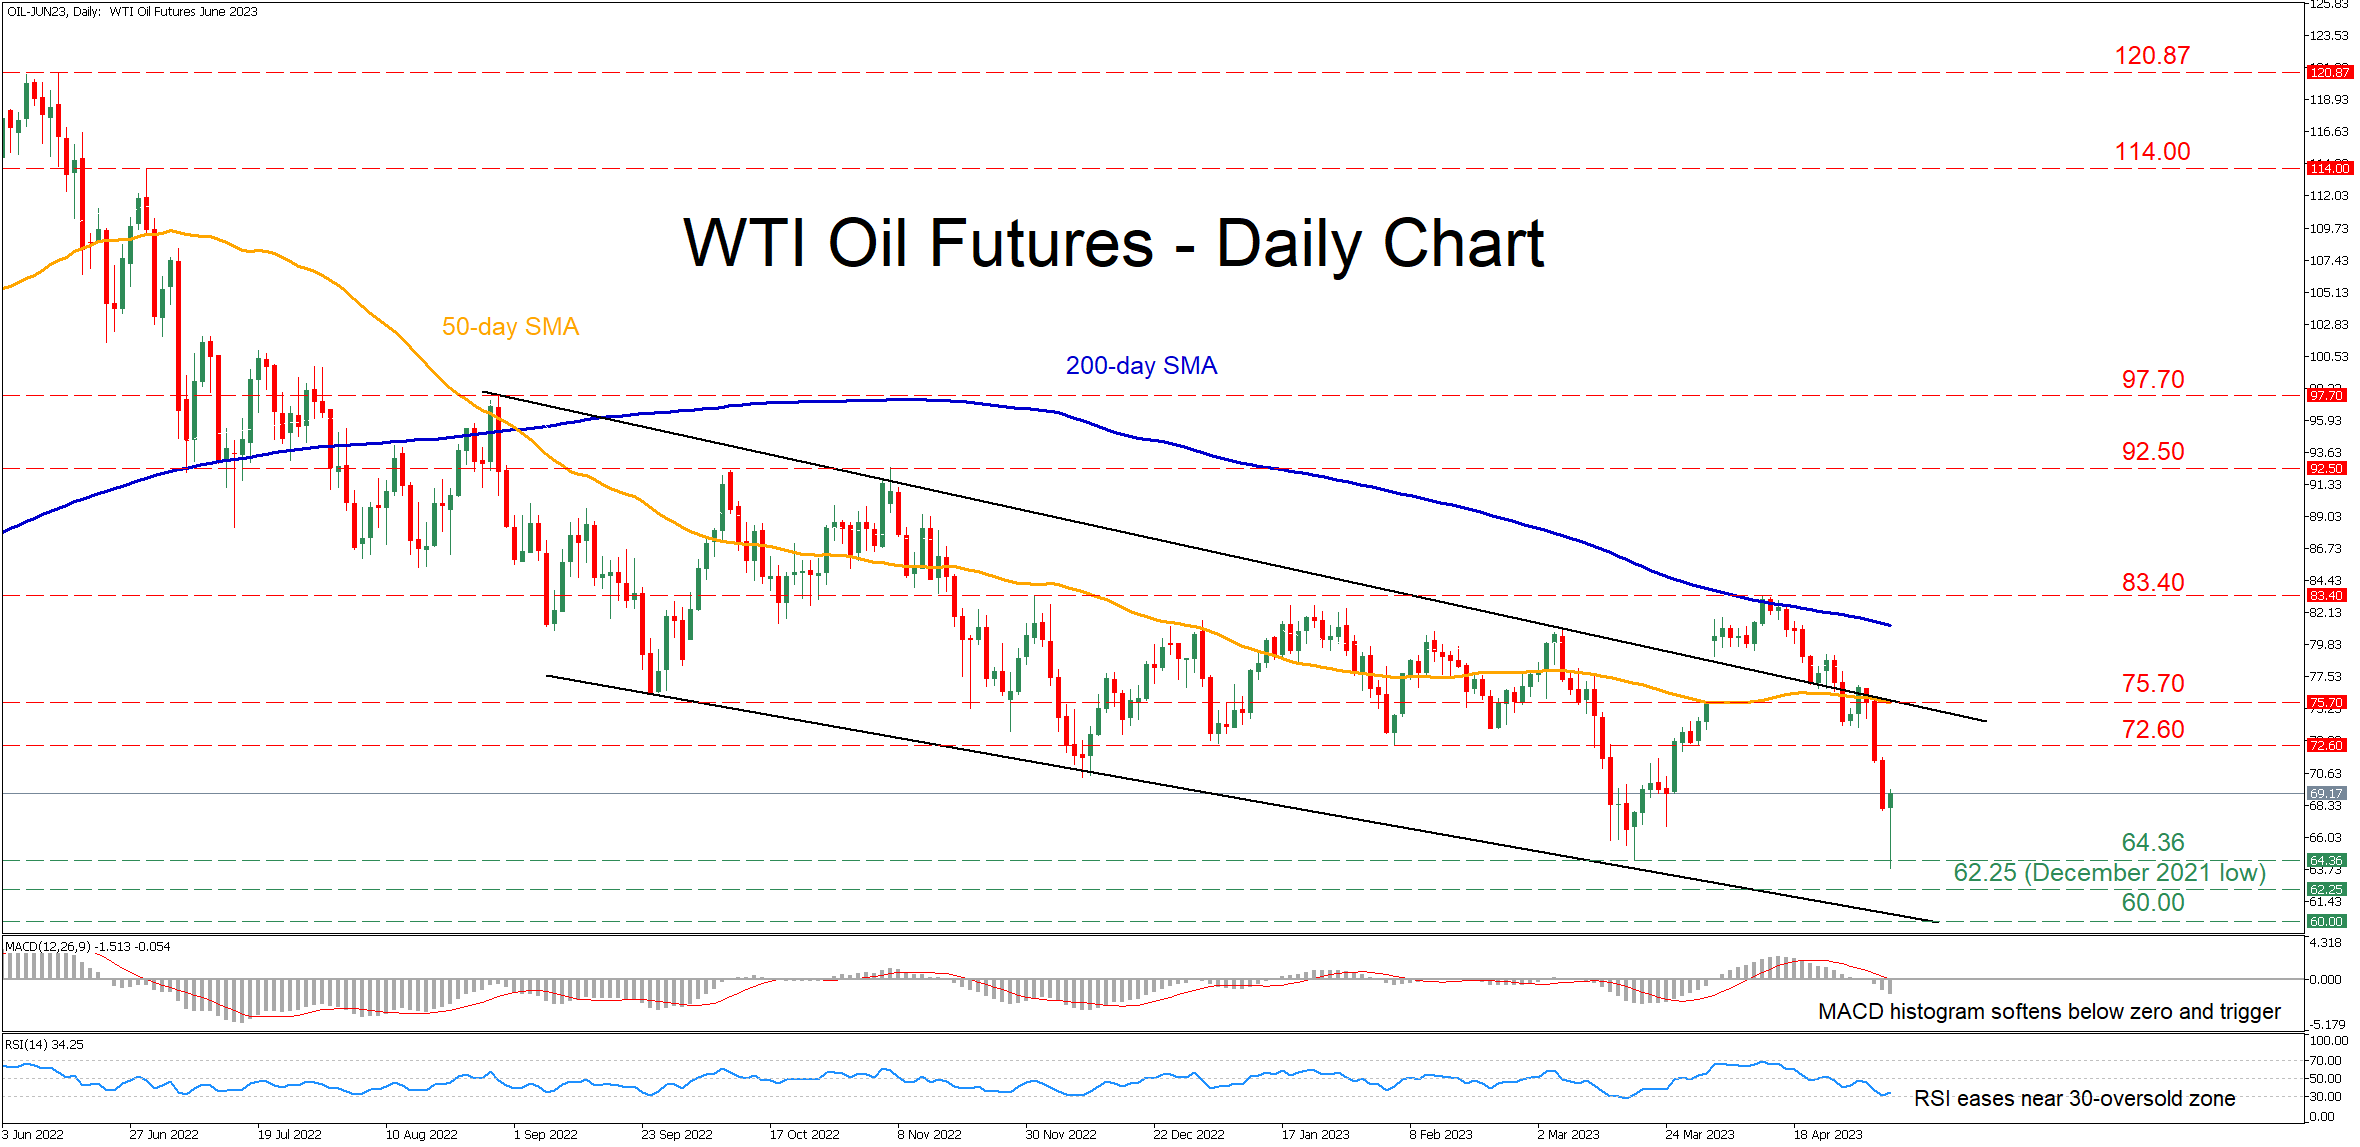
WTI oil futures (June delivery) had been in recovery mode since they encountered strong support in mid-March. However, the commodity retraced lower after the 200-day simple moving average (SMA) rejected further advances, re-entering its downward sloping channel and posting a fresh 17-month low of 63.80 in today’s session before recouping some losses.
The momentum indicators currently suggest that bearish forces are reigning supreme. Specifically, the MACD histogram is softening below both zero and its red signal line, while the RSI has flatlined slightly above the 30-oversold mark.
If sellers attempt to push the price lower, the March 2023 bottom of 64.36 could act as the first line of defense. A violation of that territory may open the door for the December 2021 low of 62.25. Failing to halt there, the price could then descend towards the 60.00 psychological mark.
On the flipside, bullish actions could propel the price towards the 72.60 support region, which could serve as resistance in the future. Should that barricade fail, the bulls might attack the 75.70 congested region that includes the 50-day SMA and the upper bound of the descending channel. Further advances could then cease at the 2023 peak of 83.40.
In brief, WTI oil futures experienced a sharp decline and posted a fresh multi-month low after their latest rebound got rejected. For the short-term bearish picture to alter, the price needs to jump above its descending channel.
EURUSD Analysis: Market Reaction To The Fed’s Decision
The Fed raised the rate yesterday by 0.25%, to 5.25%.
→ Now market participants expect a pause in the tightening policy. Moreover, the WSJ is hinting that the rate hike cycle may already be over.
→ According to Powell, it is important to raise the US debt ceiling, but not just raise it, but raise it on time (that is, not drag it out).
→ The Fed believes that the banking system is reliable and there is no cause for concern (by the way, PacWest bank shares fell 50% yesterday — bank management is considering selling it).
Although the decision was expected, it caused increased volatility:
→ US stock market indexes declined.
→ Gold jumped in price.
→ The US dollar index fell to dollar lows. Accordingly, the major currencies rose against the USD.
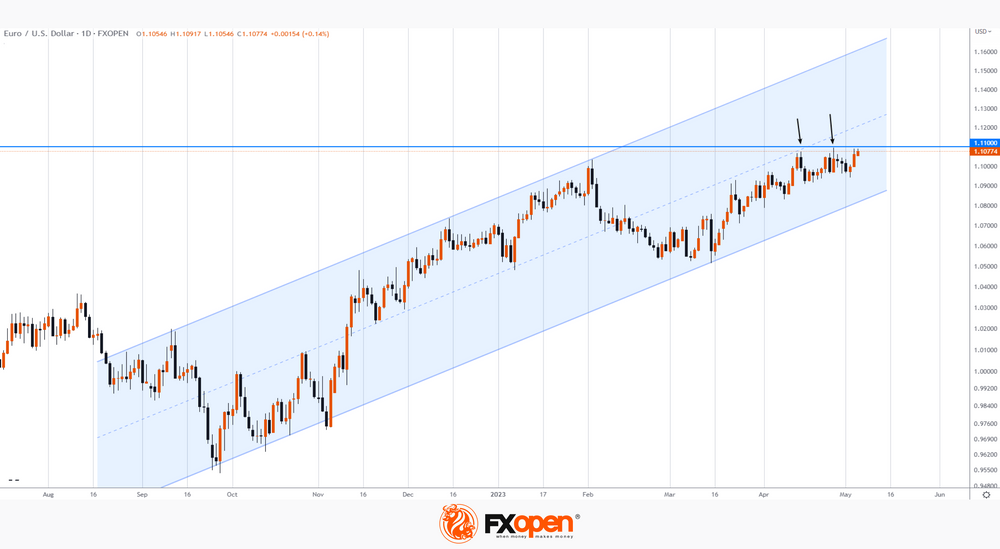
The daily chart shows that EURUSD is near the high of the year. Note, however, that each of the two renewals of the year's high in April (shown by the arrows) was minor, followed by a pullback. This indicates the strength of sellers around the level of 1.100. It looks like the level is working as a serious resistance preventing the continuation of the uptrend (shown by the blue channel).
By the way, today at 15:15 GMT+3 the decision on the ECB rate will be published (an increase of 0.25% is also expected).