

Sample Category Title
Technical Outlook and Review
DXY:
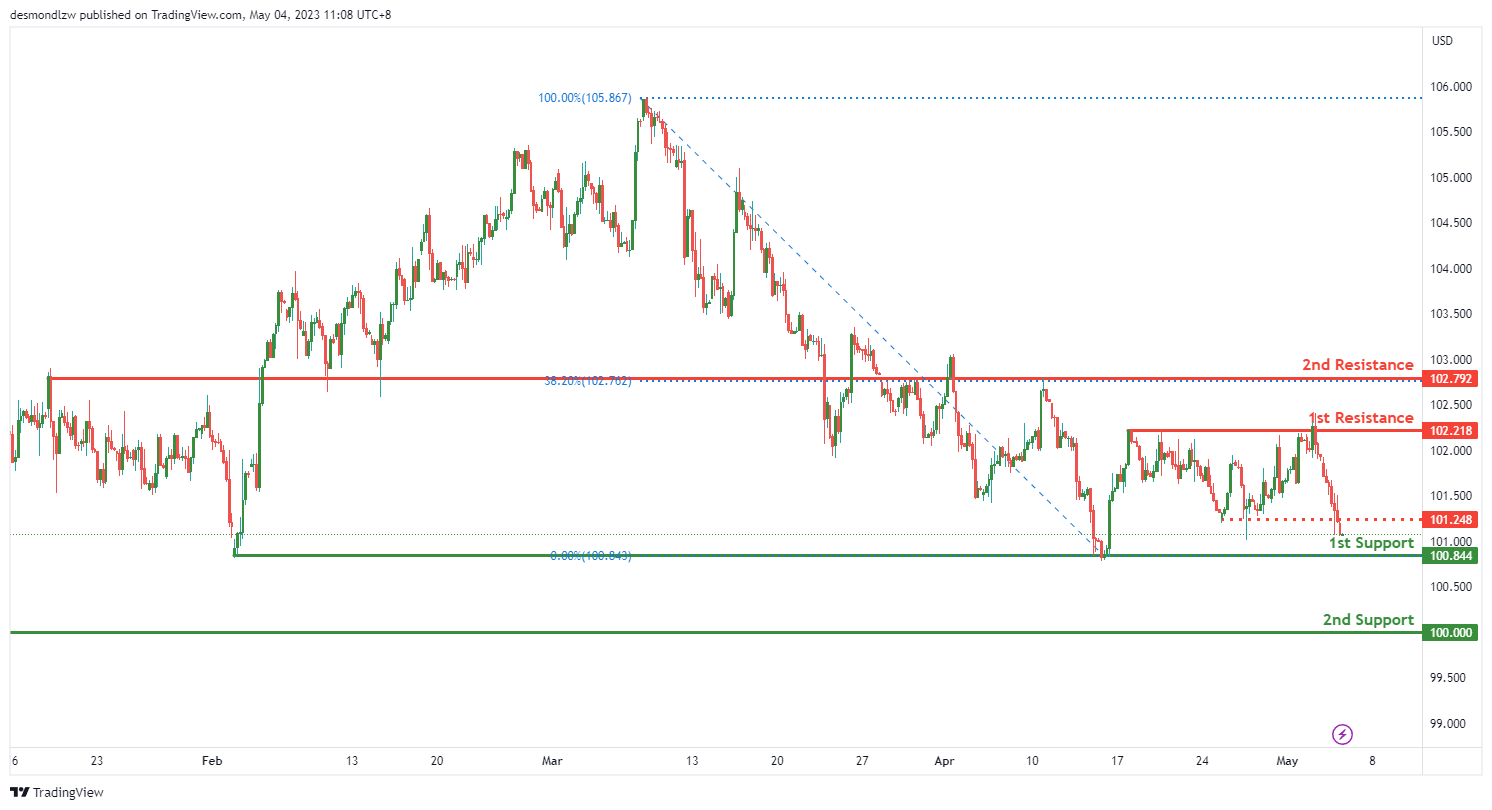
The DXY chart has a bearish momentum, with potential for a continuation towards the first support level. The first support is at 100.84, which is a multi-swing low support level. If the price breaks this level, the next support is at 100.00, which is a swing low support.
On the upside, the first resistance level is at 102.21, which is a pullback resistance. The second resistance level is at 102.79, which is an overlap resistance and coincides with the 38.20% Fibonacci retracement.
It is worth noting that there is an intermediate resistance level at 101.24, which is a pullback resistance. This level could potentially slow down the bearish momentum, but a break above this level may trigger a move towards the first resistance level
EUR/USD:
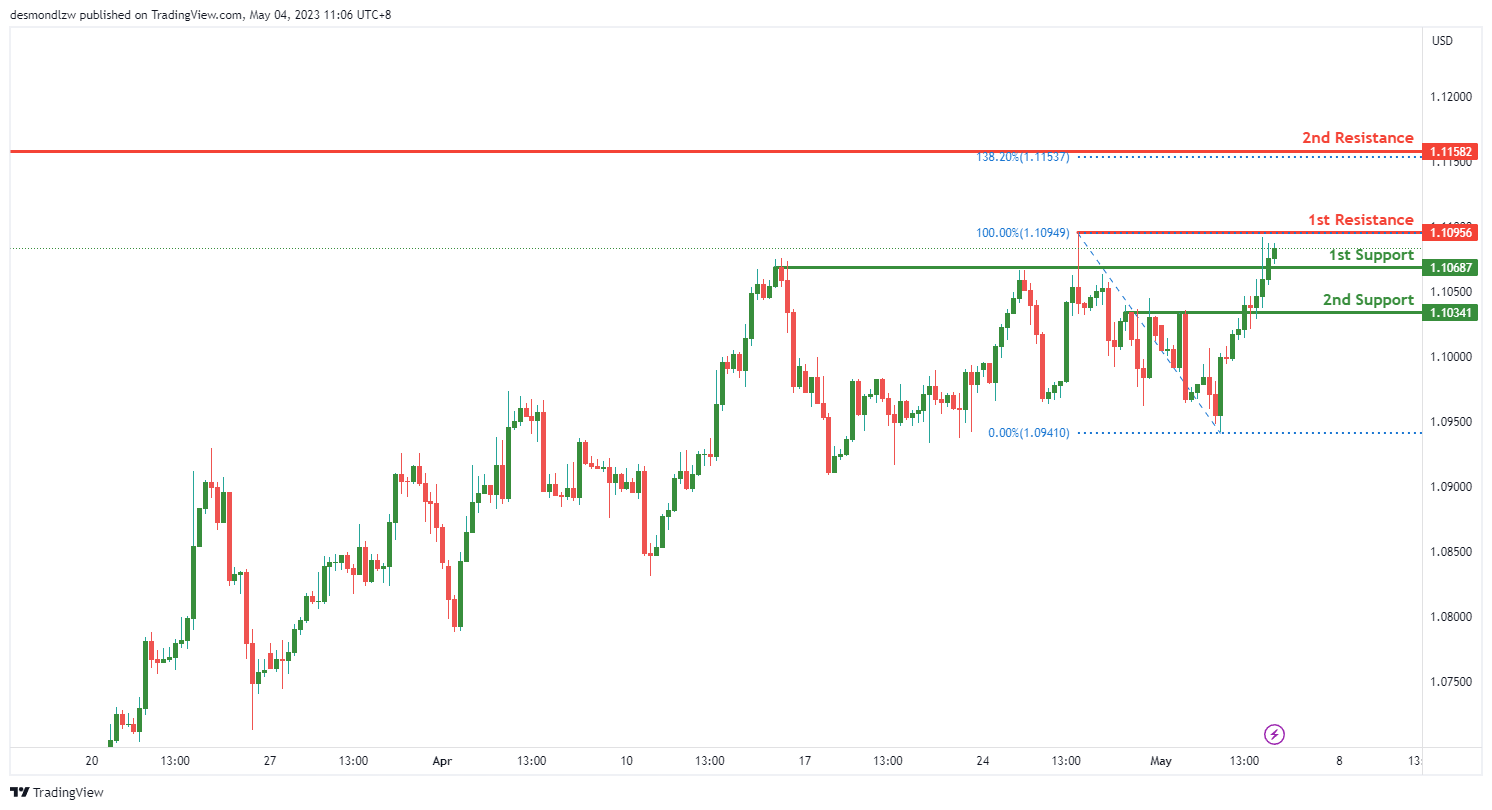
The EUR/USD chart shows a bullish bias with potential for a bullish break through of the first resistance level at 1.1095 and a rise towards the second resistance level at 1.1158. The first support level is at 1.1095, which is a pullback support and may provide a level of support for the price if it drops towards this level. The second support level is at 1.1034, which is another pullback support and may provide additional support for the price if it drops further.
On the resistance side, the first resistance level is at 1.1095, which is a swing high resistance. If the price manages to break through this level, it may rise towards the second resistance level at 1.1158. This level is a swing high resistance as well and coincides with a 138.20% Fibonacci extension.
GBP/USD:
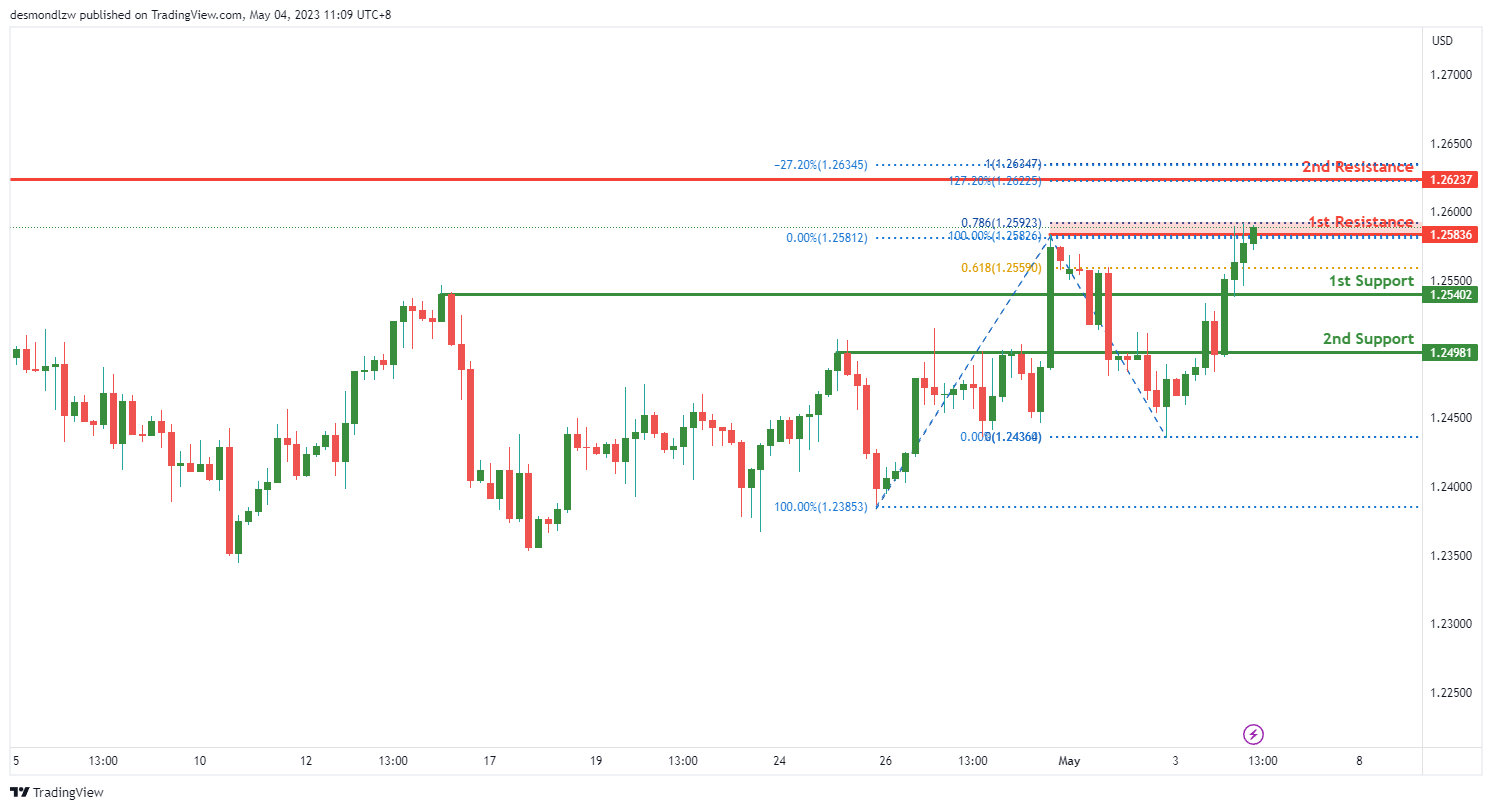
The GBP/USD chart is showing bearish momentum, with potential for a bearish reaction off the first resistance level at 1.2583 and a drop towards the first support level at 1.2540. The first support level is an overlap support, which suggests that price may bounce off this level if it reaches it. The second support level is at 1.2498, which is also an overlap support and may provide further support for the price.
On the resistance side, the first resistance level is at 1.2583, which is a swing high resistance and coincides with a 78.60% Fibonacci projection. If the price manages to break through this level, it may rise towards the second resistance level at 1.2623. This level is a swing high resistance as well and coincides with a -27% Fibonacci expansion and a 127.20% Fibonacci extension, which suggests a potential area of strong resistance for the price.
USD/CHF:
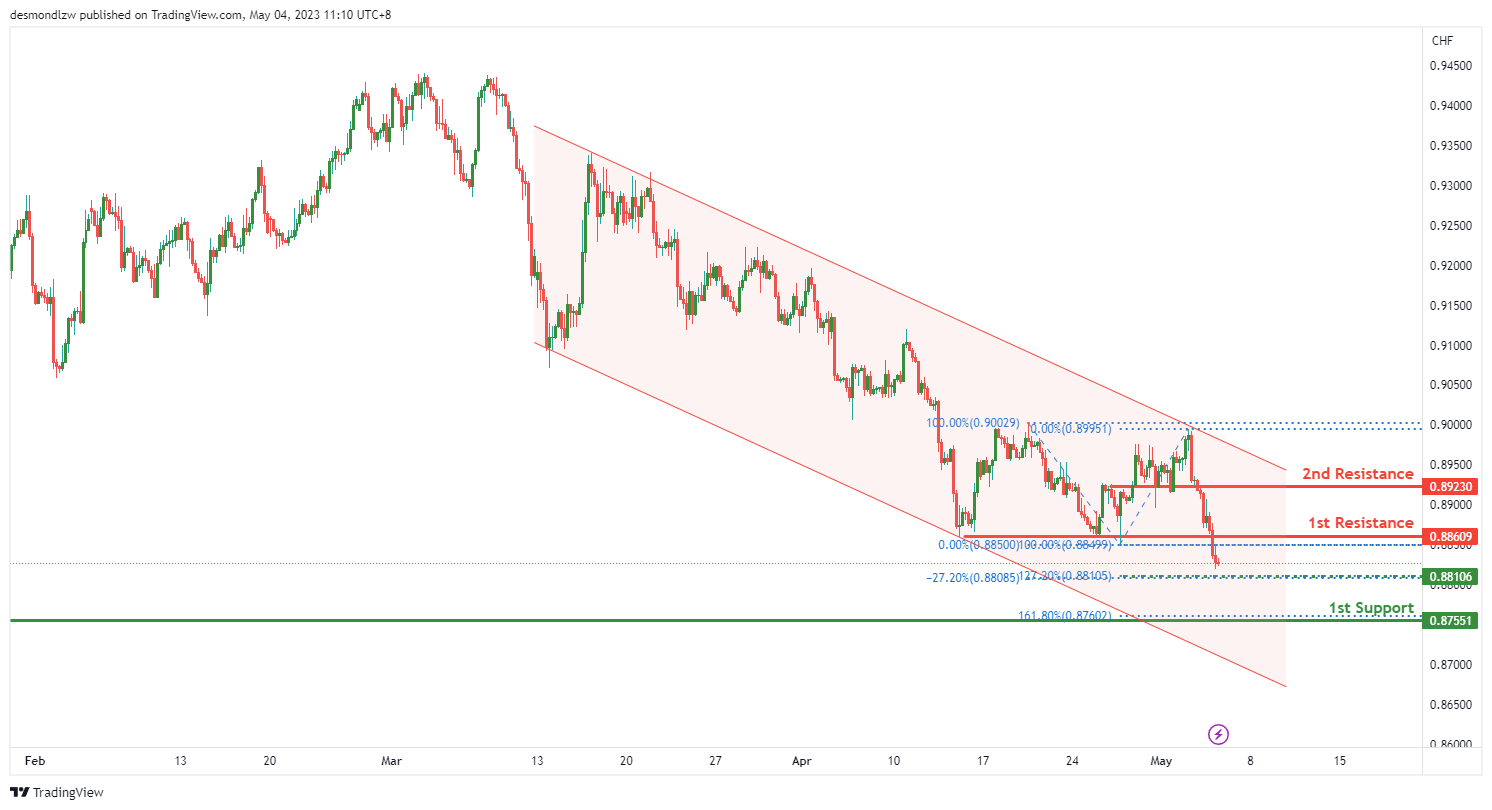
The USD/CHF chart shows bearish momentum, with price currently in a descending channel which suggests that price might continue to go lower due to its bearish momentum. There is potential for a bearish continuation towards the first support level at 0.8755, which is an overlap support and may provide a bounce if the price reaches this level. There is also an intermediate support level at 0.8810, which is another overlap support and coincides with a -27% Fibonacci expansion.
On the resistance side, the first resistance level is at 0.8860, which is a pullback resistance. If the price manages to break through this level, it may rise towards the second resistance level at 0.8923, which is an overlap resistance and may provide further resistance for the price.
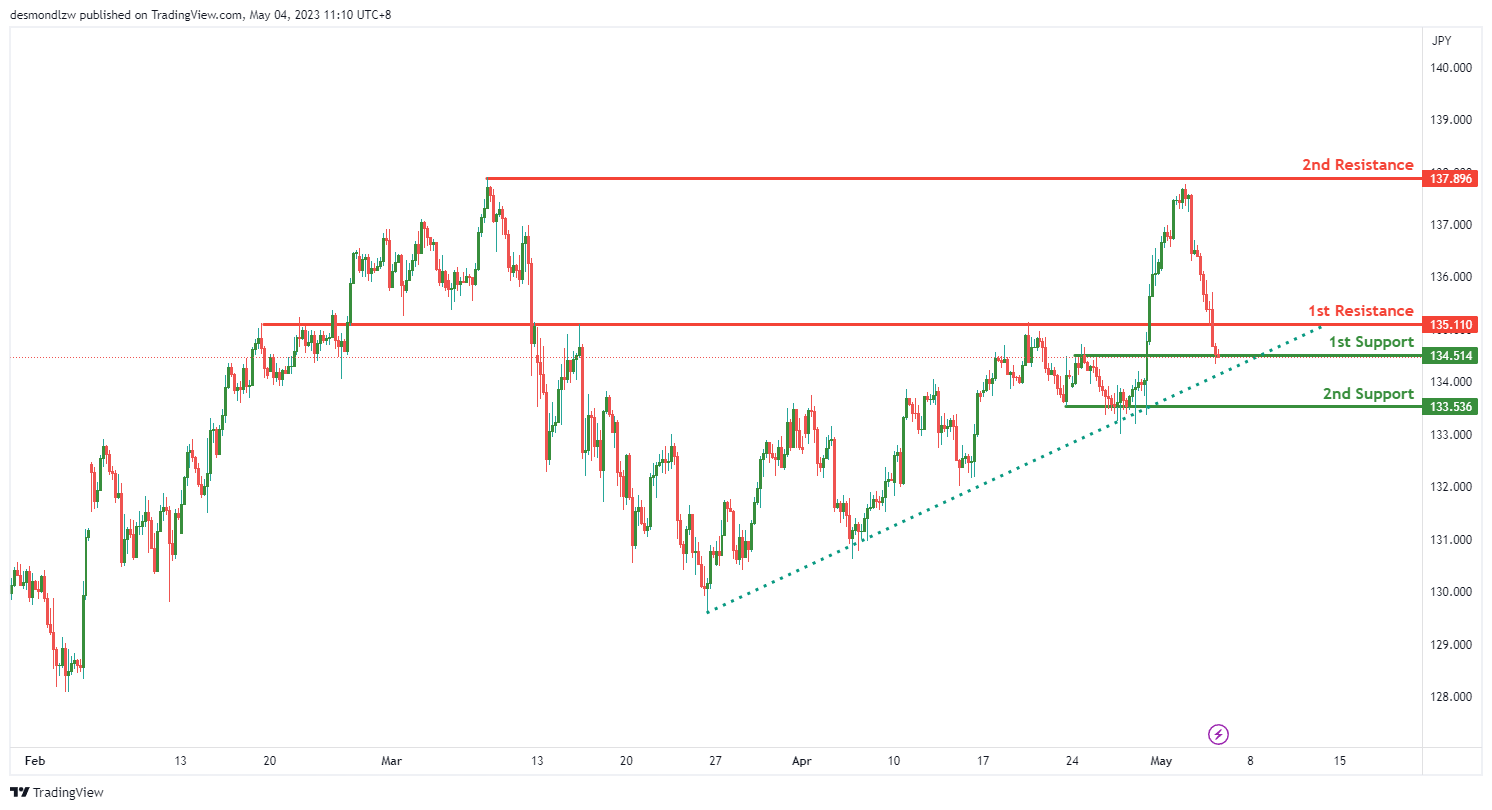
USD/JPY:
The USD/JPY chart shows bearish momentum, but the overall picture is still somewhat mixed as the price is currently above a major ascending trend line. For the bearish momentum to take over, the price would need to break below the trend line. Currently, there is potential for a bearish break off the first support level at 134.51 and a drop towards 2nd support level at 133.53. The first support level is a pullback support, which suggests that the price may find support if it reaches this level. The intermediate support level at 133.53 is a multi-swing low support and may provide further support for the price if it drops below the first support level.
On the resistance side, the first resistance level is at 135.11, which is a pullback resistance. If the price manages to break through this level, it may rise towards the second resistance level at 137.89. This level is a swing high resistance and may provide strong resistance for the price.
AUD/USD:
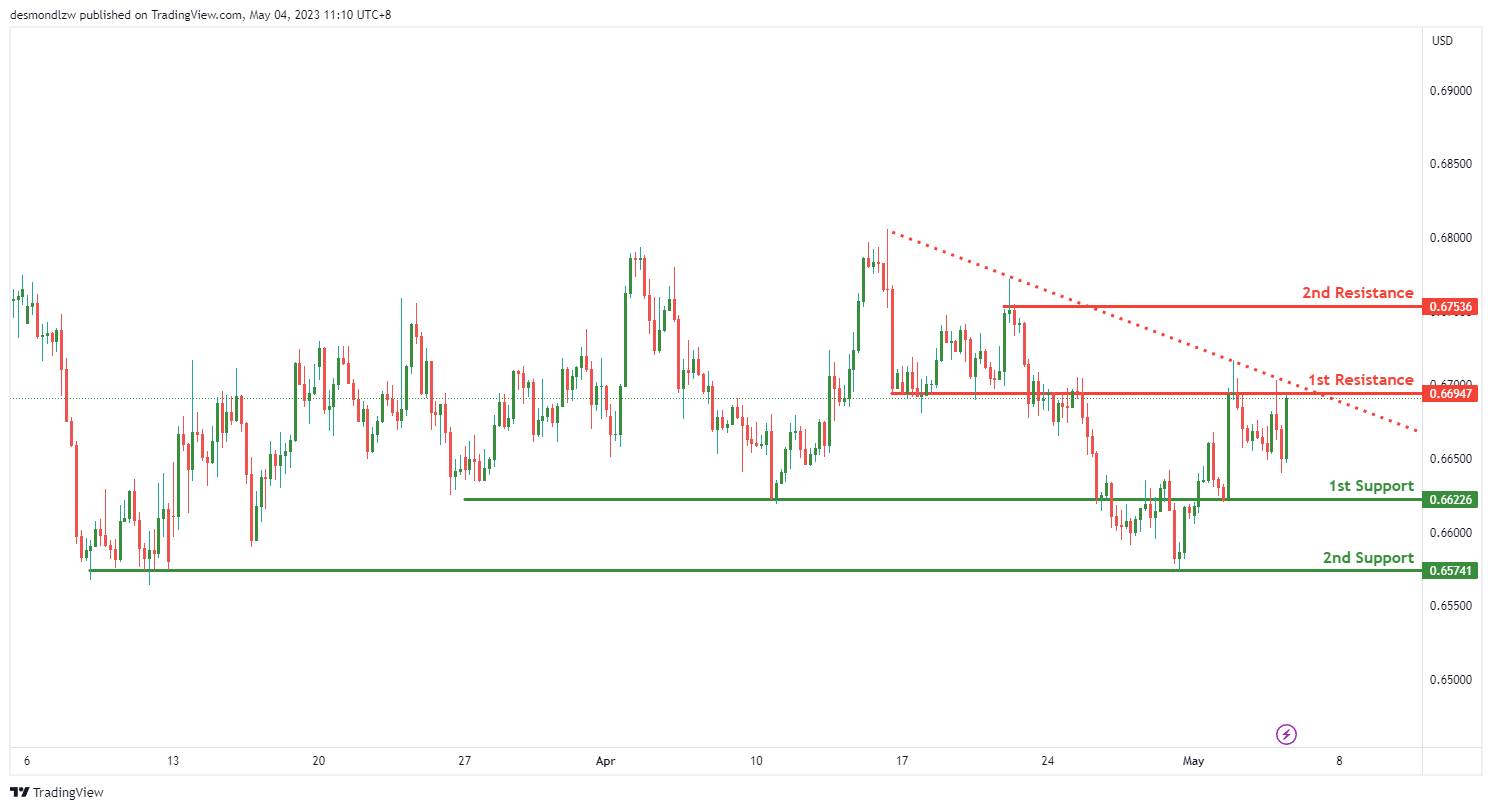
The AUD/USD chart shows a bearish momentum, with price currently below a major descending trend line. There is potential for a bearish reaction off the first resistance level at 0.6694 and a drop towards the first support level at 0.6622.
The first support level is an overlap support, which suggests that the price may find support if it reaches this level. The 2nd support level at 0.6574 is a multi-swing low support and may provide further support for the price if it drops below the first support level.
On the resistance side, the first resistance level is at 0.6694, which is an overlap resistance. If the price manages to break through this level, it may rise towards the second resistance level at 0.6753. This level is a swing high resistance and may provide strong resistance for the price.
NZD/USD:
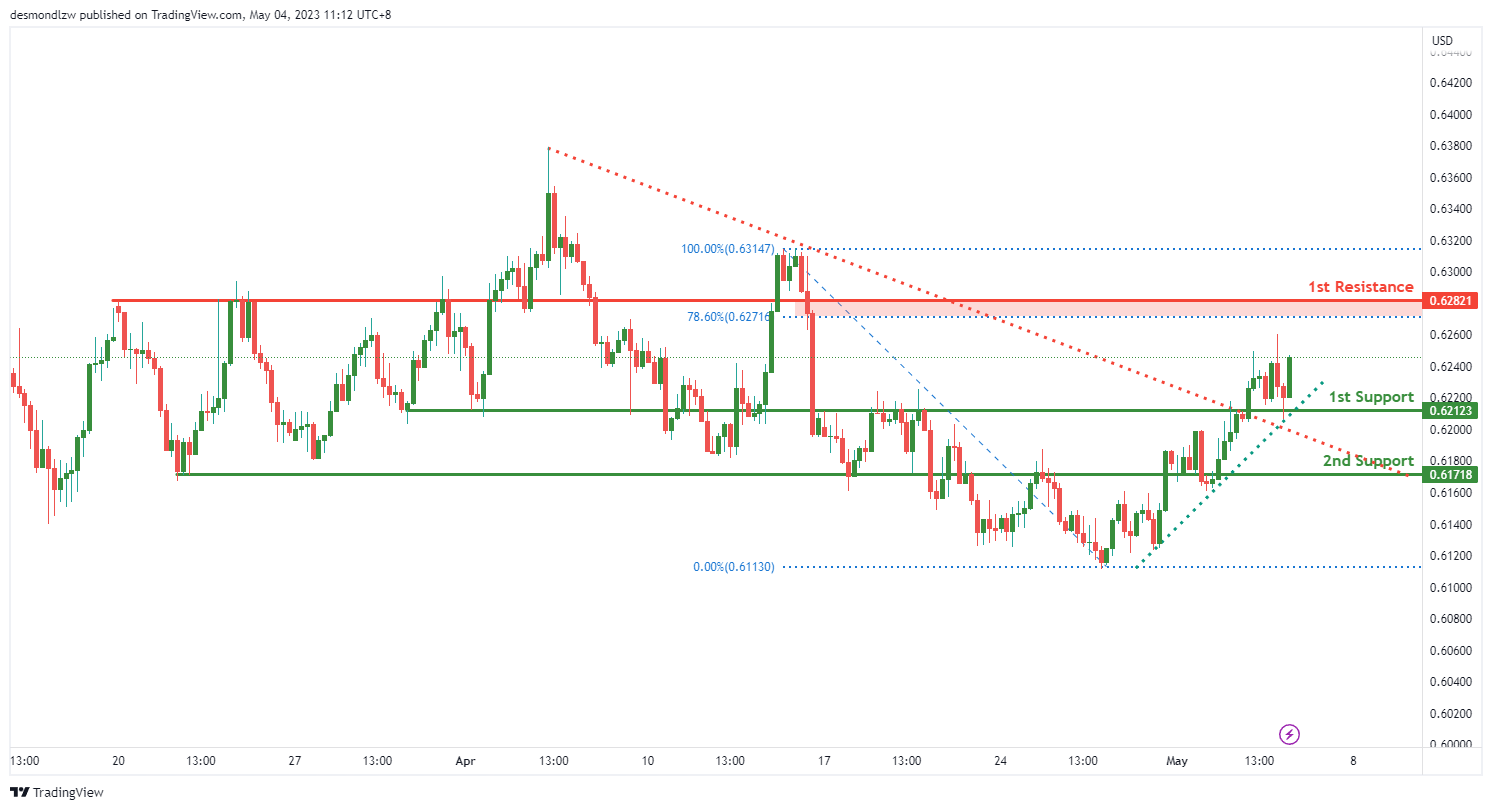
The NZD/USD chart shows bullish momentum, as price is above a major ascending trend line suggesting further bullish momentum may be on the cards. Additionally, price broke above a descending resistance line, which triggered a potential bullish move.
There is potential for a bullish continuation towards the first resistance level at 0.6282. The first support level at 0.6212 is an overlap support, which may provide support for the price if it drops. The second support level at 0.6171 is also an overlap support, which may provide further support for the price if it drops below the first support level.
On the resistance side, the first resistance level at 0.6282 is a pullback resistance. If the price manages to break through this level, it may rise further towards higher levels.
USD/CAD:
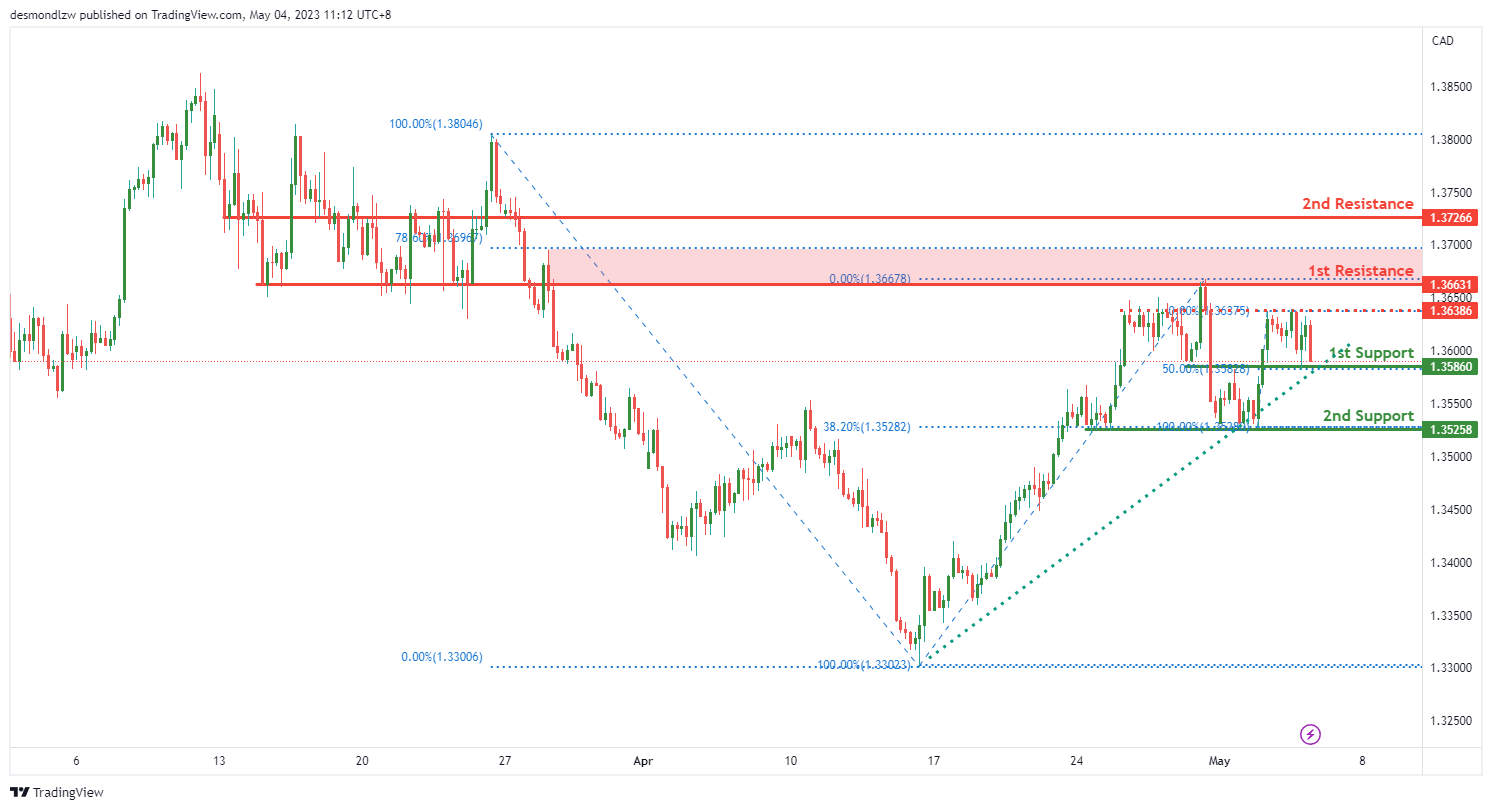
The USD/CAD chart is showing bullish momentum as price is currently above a major ascending trend line, indicating that further bullish momentum is on the cards. Based on this analysis, price could potentially make a bullish bounce off the 1st support level at 1.3586 and head towards the 1st resistance level at 1.3663.
The 1st support level at 1.3586 is an overlap support level and also coincides with the 50% Fibonacci retracement level. The 2nd support level at 1.3525 is a multi-swing low support level and also coincides with the 38.20% Fibonacci retracement level. These support levels may provide strong support for the price if it drops.
On the resistance side, the 1st resistance level at 1.3663 is an overlap resistance level and also coincides with the 78.60% Fibonacci projection level. If the price manages to break through this level, it may rise towards the 2nd resistance level at 1.3726. This level is a pullback resistance level and may provide strong resistance for the price.
It’s worth noting that as the overall momentum of the chart is bullish, we are looking for prices to rise from support to resistance. However, a break of the 1st support level may trigger a drop towards the 2nd support level. It’s important to keep an eye on the trend lines to confirm the direction of the momentum.
DJ30:
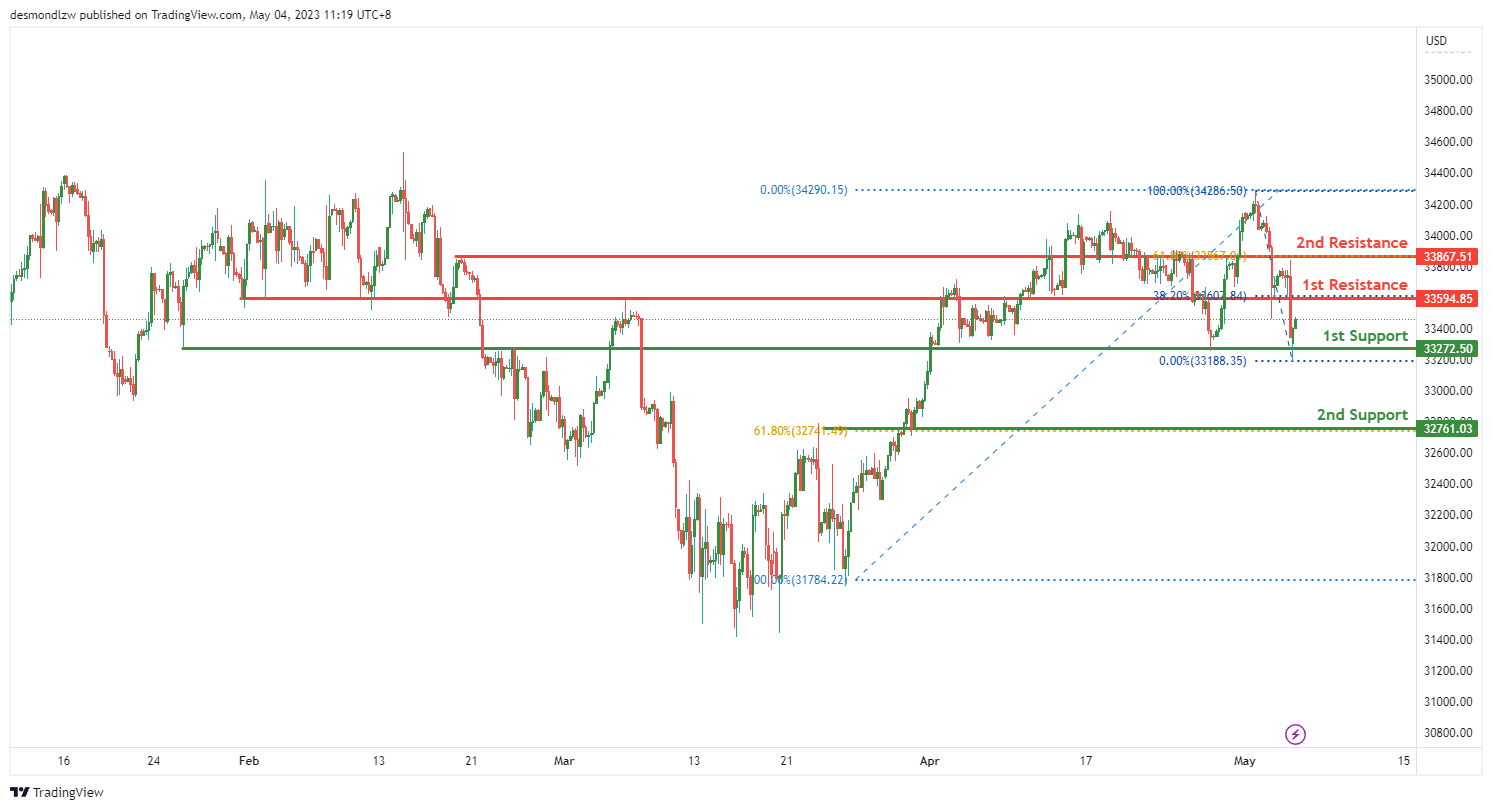
The DJ30 chart is currently showing bullish momentum, with potential for a continuation towards the first resistance level at 33594.85. The first support level at 33272.50 is an overlap support and may provide a level of support if the price were to drop to this level.
The second support level at 32761.03 is another overlap support, but also coincides with a 61.80% Fibonacci retracement level, which could provide stronger support for the price.
On the resistance side, the first resistance level at 33594.85 is a pullback resistance, which means that it may provide strong resistance for the price. This resistance level coincides with a 38.20% Fibonacci retracement level, which further strengthens its potential as a resistance level.
The second resistance level at 33867.51 is an overlap resistance and coincides with a 61.80% Fibonacci retracement level. This level may provide even stronger resistance for the price, potentially causing a reversal.
GER30:
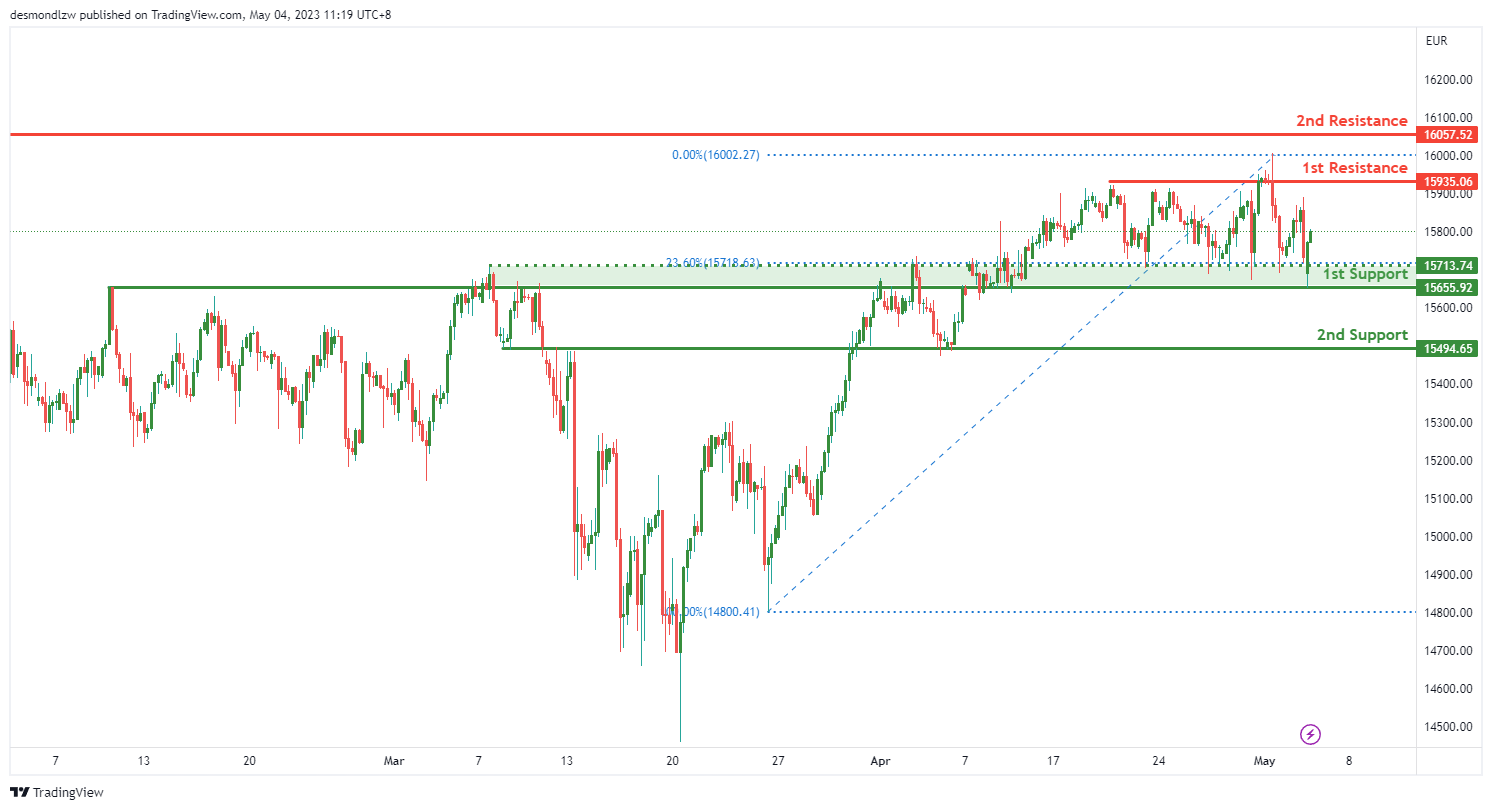
The GER30 chart is currently showing bullish momentum, and it’s above a major ascending trend line which suggests further bullish momentum is on the cards. There is potential for a bullish continuation towards the first resistance level at 15935.06.
The first support level is at 15655.92, which is an overlap support, and may provide support for the price if it drops towards this level. The second support level is at 15494.65, which is also an overlap support, and may provide further support for the price if it drops below the first support level.
On the resistance side, the first resistance level is at 15935.06, which is a multi-swing high resistance, and may provide strong resistance for the price. If the price manages to break through this level, it may rise towards the second resistance level at 16057.52. This level is a swing high resistance and may also provide strong resistance for the price.
In addition to the support and resistance levels, there is an intermediate support level at 15713.74, which is an overlap support and also has a 23.60% Fibonacci retracement lining up with it. This level may provide additional support for the price if it drops towards this level.
BTC/USD:
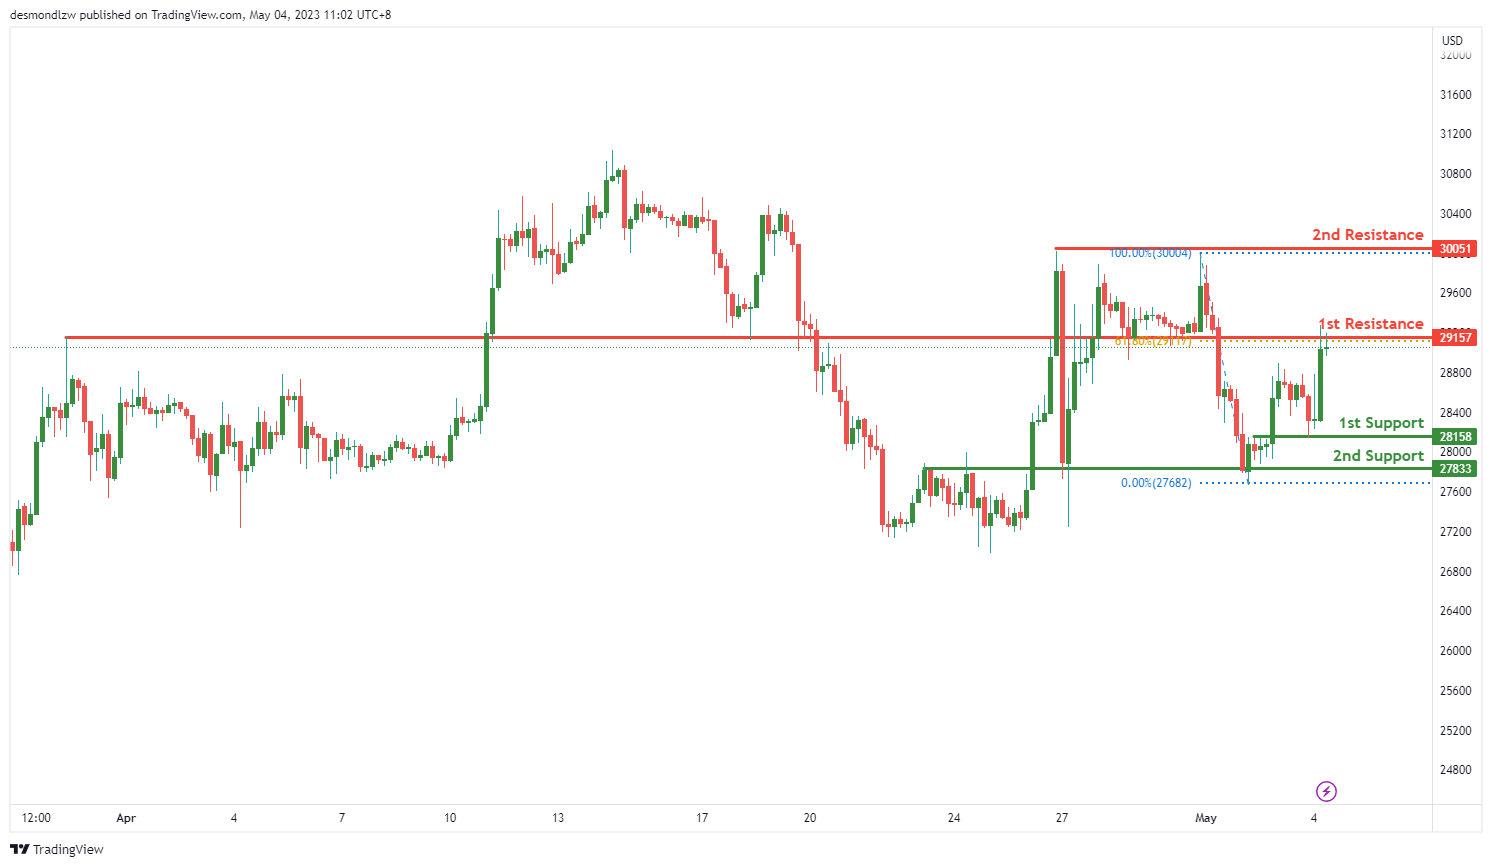
The BTC/USD chart shows bearish momentum, as the price is below a major descending trend line, suggesting that the trend may continue downwards. There is potential for a bearish reaction off the first resistance level at 29157 and a drop towards the first support level at 28158.
The first support level is an overlap support and may provide some support for the price if it reaches this level. The second support level at 27833 is also an overlap support and may provide further support for the price if it drops below the first support level.
On the resistance side, the first resistance level is at 29157, which is also an overlap resistance and coincides with a 61.80% Fibonacci retracement. If the price manages to break through this level, it may rise towards the second resistance level at 30051, which is a multi-swing high resistance and may provide strong resistance for the price.
US500
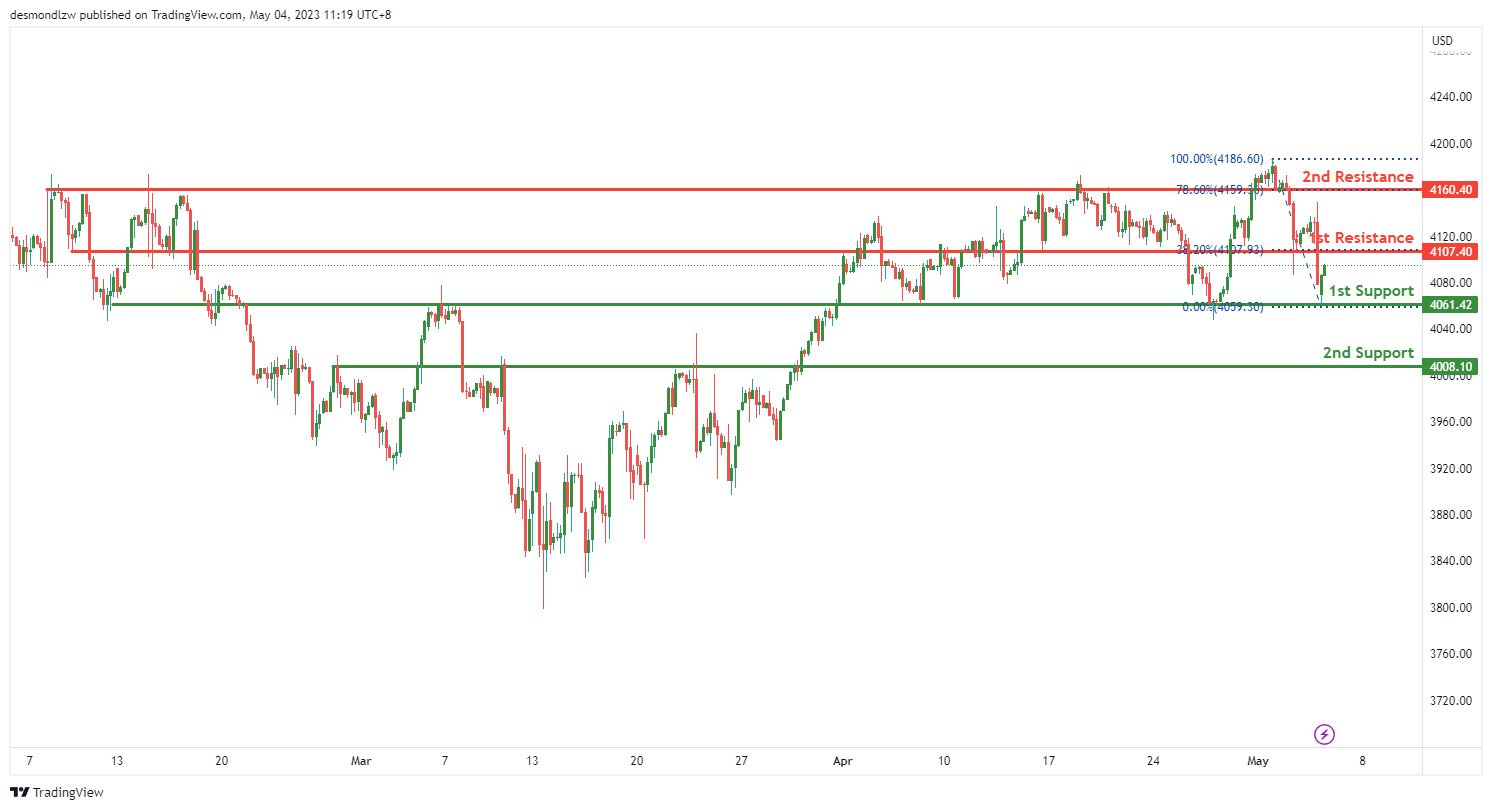
The US500 chart shows bullish momentum as price is currently above a major ascending trend line. There is potential for a bullish continuation towards the first resistance level at 4107.40.
The first support level at 4061.42 is a multi-swing low support, which suggests that price may find support if it reaches this level. The second support level at 4008.10 is a pullback support and may provide further support for the price if it drops below the first support level.
On the resistance side, the first resistance level at 4107.40 is an overlap resistance and is also lined up with a 38.20% Fibonacci retracement level. If the price manages to break through this level, it may rise towards the second resistance level at 4160.40. This level is an overlap resistance and is also lined up with a 78.60% Fibonacci retracement level, which may provide strong resistance for the price.
ETH/USD:
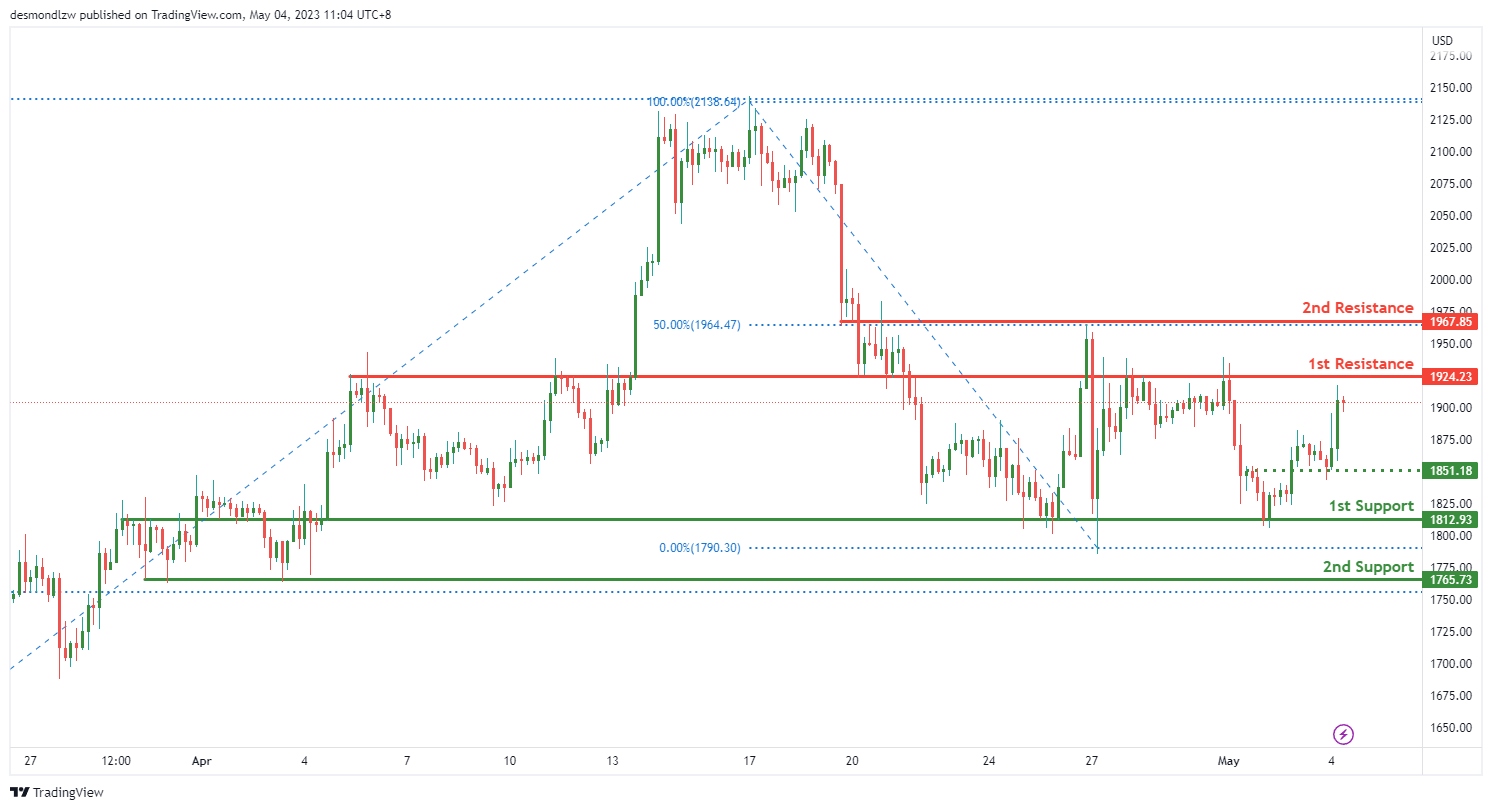
Based on the analysis, the overall momentum of the ETH/USD chart is bearish. There is potential for a bearish reaction off the first resistance level at 1924.23, with a drop towards the first support level at 1812.93.
The first support level is a good level because it is an overlap support. The second support level at 1765.73 is a multi-swing low support which may provide further support for the price if it drops below the first support level.
On the resistance side, the first resistance level at 1924.23 is an overlap resistance which suggests that the price may find resistance if it reaches this level. The second resistance level at 1967.85 is also an overlap resistance and coincides with the 50% Fibonacci retracement level.
Additionally, there is an intermediate support level at 1851.18, which is an overlap support level that may provide some temporary support for the price.
WTI/USD:
WTI: Bearish Momentum Continues as Price Remains Below Major Descending Trend Line
The overall momentum of the WTI chart remains bearish, with price below a major descending trend line indicating further potential downside. Price could potentially make a bearish reaction off the 1st resistance and drop to the 1st support level.
The 1st support level is at 64.90 and is a multi-swing low support, making it a good level to watch for potential bounce. The 2nd support level is at 61.66 and is a swing low support, further supporting the idea of potential downside.
On the resistance side, the 1st resistance is at 71.58 and is an overlap resistance, coinciding with a 38.20% Fibonacci retracement. This makes it a good level to watch for potential pullbacks. Additionally, there is an intermediate resistance at 68.80, which is an overlap resistance and lines up with a 23.60% Fibonacci retracement.
XAU/USD (GOLD):
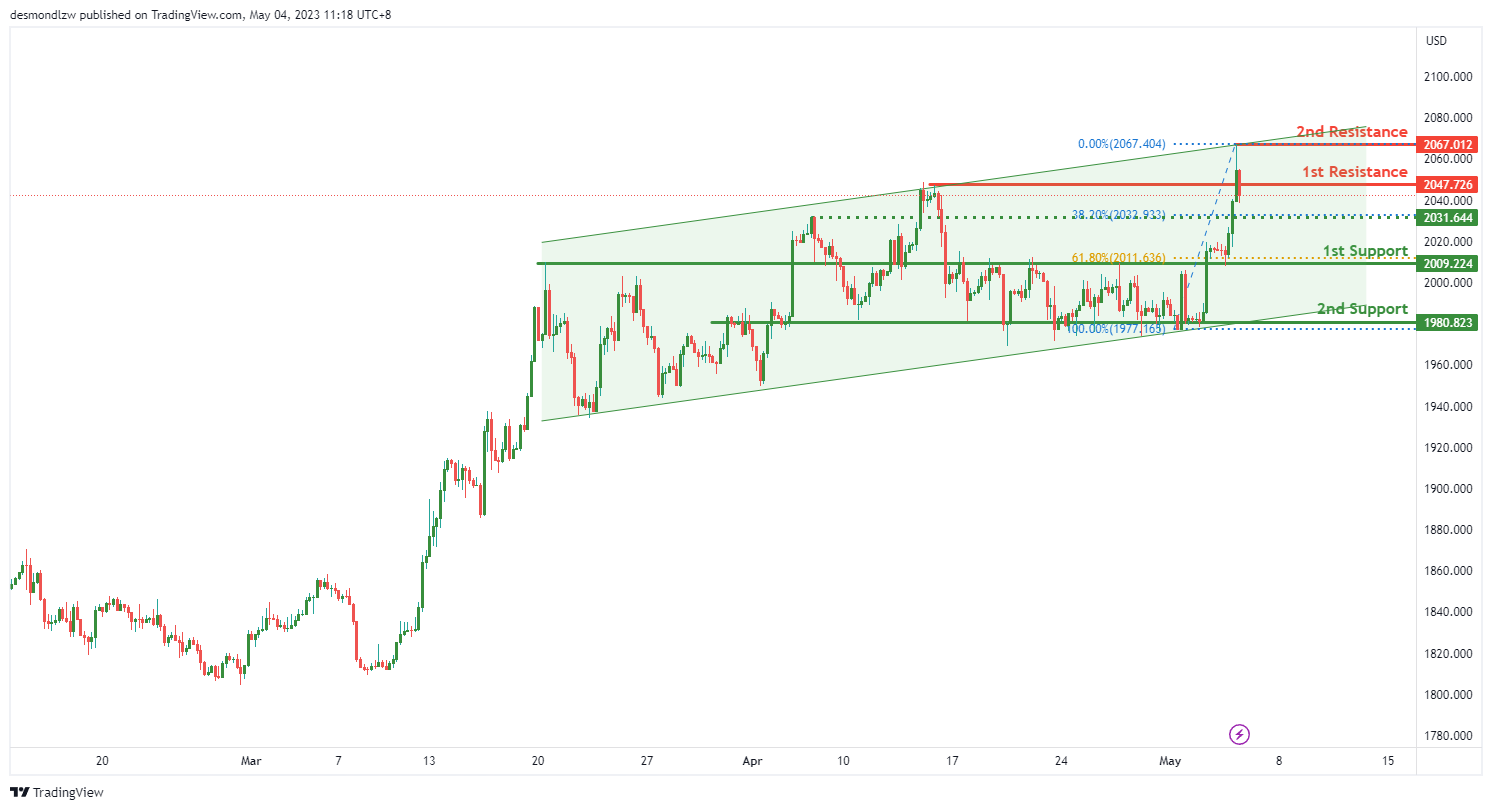
Gold (XAU/USD) is currently showing bullish momentum as the price is in an ascending channel. However, in the short term, the price may drop further to the 1st support level before bouncing back and heading towards the 1st resistance.
The 1st support level is at 2009.22 and is a strong overlap support, coinciding with a 61.80% Fibonacci retracement level. The 2nd support level is at 1980.82 and is also an overlap support level.
On the resistance side, the 1st resistance level is at 2047.72, which is a swing high resistance. The 2nd resistance level is at 2067.01 and is also a swing high resistance.
There is also an intermediate support level at 2031.64 which coincides with a 38.20% Fibonacci retracement level.
In conclusion, Gold is showing bullish momentum in the long term but may experience some short-term bearish pressure before continuing its bullish trend. The 1st support level at 2009.22 is a critical level to watch, as a bounce from this level could trigger a move towards the 1st resistance at 2047.72. If the price breaks below the 1st support level, the 2nd support level at 1980.82 could provide some support. On the upside, a break of the 1st resistance level could lead to a move towards the 2nd resistance at 2067.01.
Eurozone PMI services finalized at 12-month High, growth to continue in months ahead
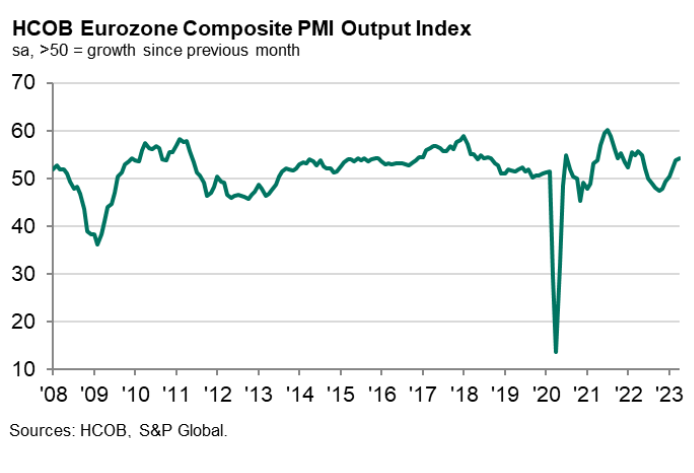
Eurozone PMI Services were finalized at 56.2 in April, up from March's 55.0, marking a 12-month high. PMI Composite was finalized at 54.1, up from March's 53.7, an 11-month high.
Among member states, Italy's PMI composite rose to 55.3, a 17-month high, while Germany's increased to 54.2, a 12-month high. Ireland rose to 53.5, a 2-month high. However, Spain dropped to a 2-month low of 56.2, and France fell to a 2-month low of 52.4.
HCOB noted that the service sector is robust across Eurozone, with companies able to pass on at least some inflation in intermediate inputs to customers. Service firms' confidence was reflected in the solid index reading for business expectations and increased staffing levels compared to the previous month.
However, HCOB also highlighted that Eurozone order backlog grew at a weaker pace, nearly stagnating in Germany and falling slightly in Italy. Despite this, all PMI indicators suggest that growth in the Eurozone services sector will continue in the months ahead.
USD/CAD Daily Outlook
Daily Pivots: (S1) 1.3584; (P) 1.3612; (R1) 1.3642; More....
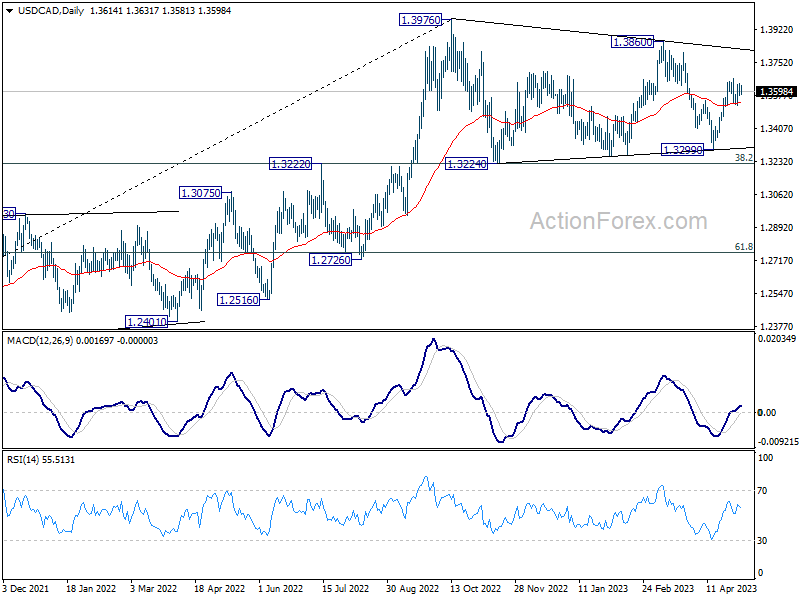
USD/CAD is staying in range below 1.3668 and intraday bias remains neutral. Further rise is expected with 1.3521 support intact. Corrective pattern from 1.3976 could have completed with three waves to 1.3299. On the upside, above 1.3668 will target 1.3860/3976 resistance zone. However, firm break of 1.3521 will dampen this bullish view and bring deeper fall back towards 1.3299 support instead.
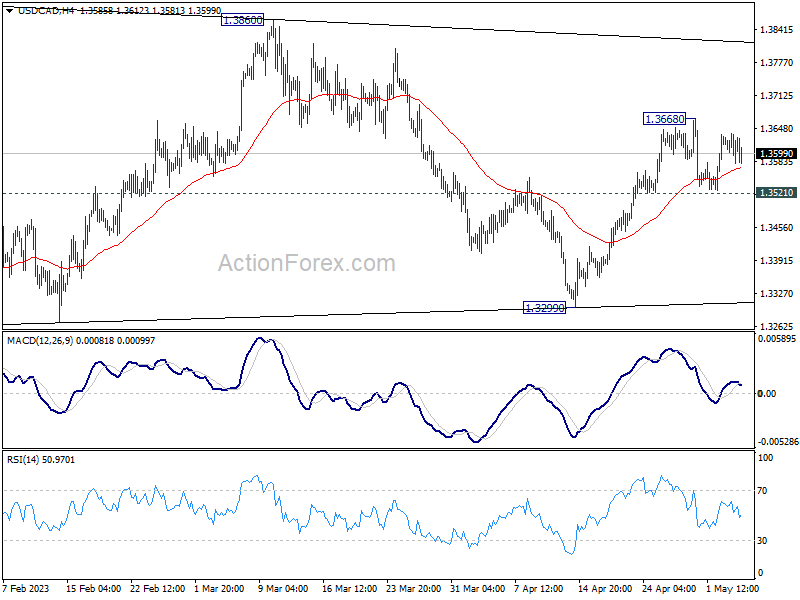
In the bigger picture, the up trend from 1.2005 (2021 low) is still in progress. Break of 1.3976 will confirm resumption and target 61.8% projection of 1.2401 to 1.3976 from 1.3261 at 1.4234. Firm break there will pave the way to long term resistance zone at 1.4667/89 (2016, 2020 highs). On the downside, sustained break of 55 W EMA (now at 1.3302) is needed to confirm medium term topping. Otherwise, outlook will remain bullish even in case of deep pull back.
AUD/USD Daily Report
Daily Pivots: (S1) 0.6647; (P) 0.6675; (R1) 0.6701; More...
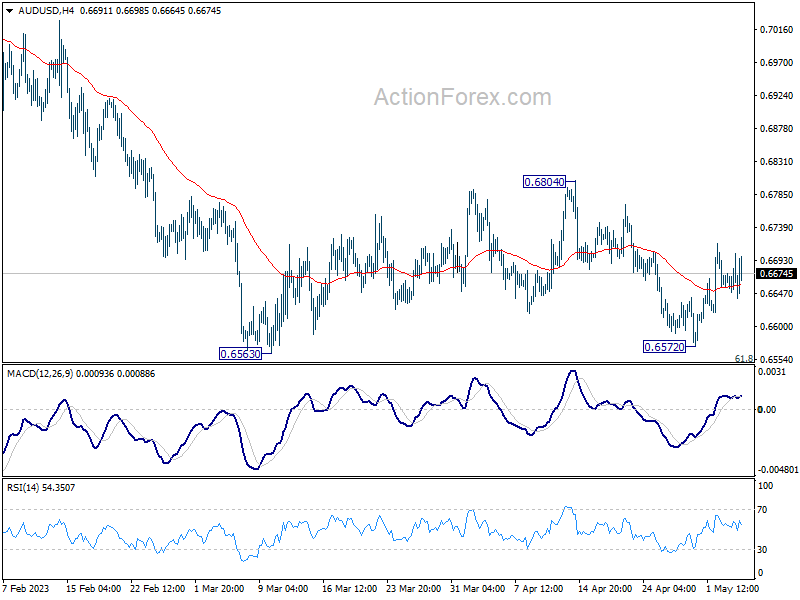
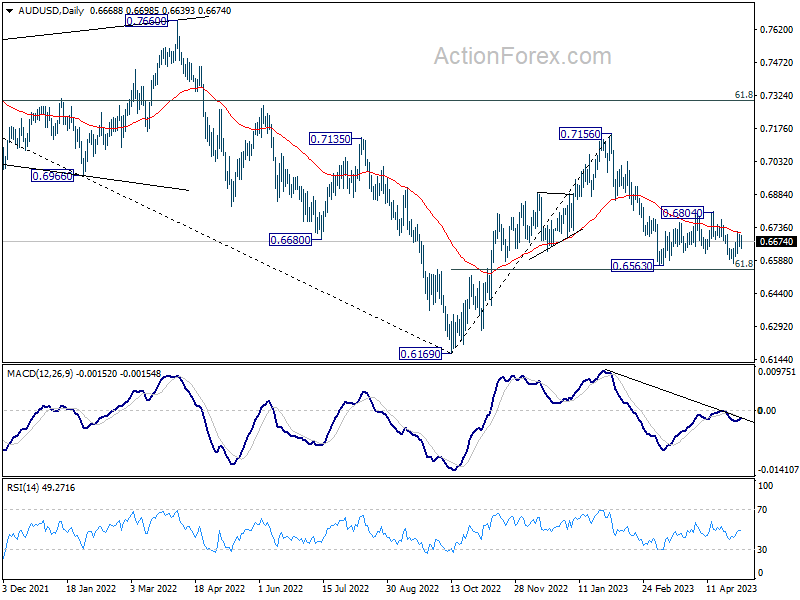
AUD/USD is staying in consolidation from 0.6563, and rise from 0.6572 could still extend higher. But near term outlook stays bearish as long as 0.6804 resistance holds, and down trend resumption through 0.6563 low is in favor at a later stage. Nevertheless, sustained break of 0.6804 should indicate completion of whole fall from 0.7156, and turn near term outlook bullish for retesting this high instead.
In the bigger picture, as long as 61.8% retracement of 0.6169 to 0.7156 at 0.6546 holds, the decline from 0.7156 is seen as a correction to rally from 0.6169 (2022 low) only. Another rise should still be seen through 0.7156 at a later stage. However, sustained break of 0.6546 will raise the chance of long term down trend resumption through 0.6169 low.
USD/JPY Daily Outlook
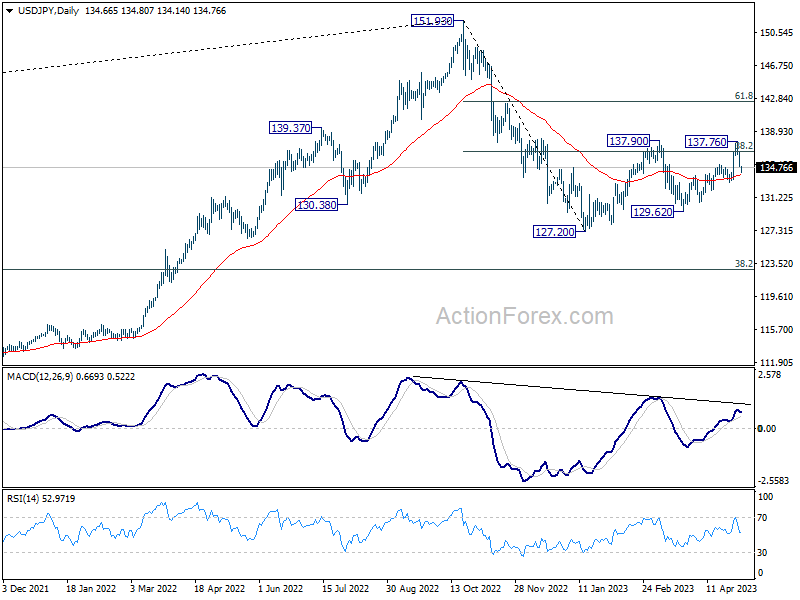
Daily Pivots: (S1) 134.13; (P) 135.39; (R1) 136.04; More...
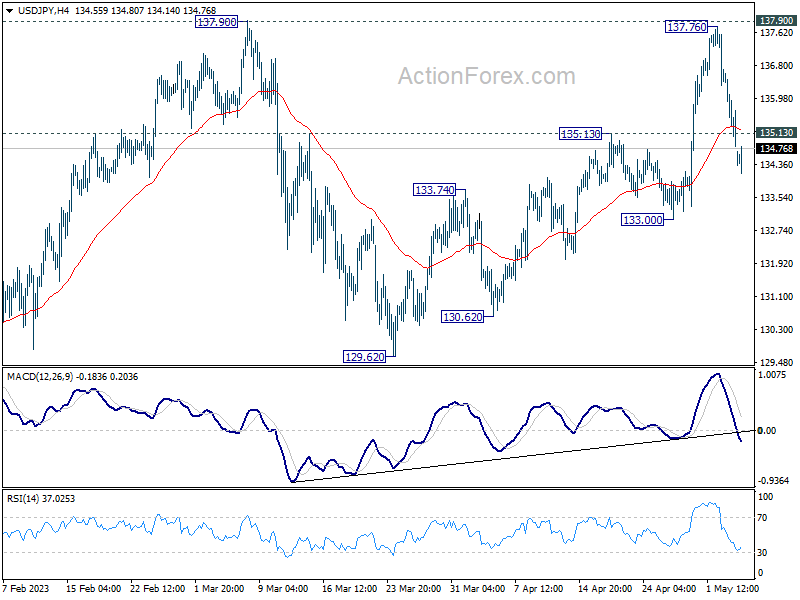
USD/JPY's break of 135.13 support indicates short term topping at 137.76, after rejection by 137.90. Intraday bias is back on the downside for 133.00 support. Firm break there will target 129.62 support. But overall, as long as 129.62 holds, larger rebound from 127.20 is still in favor to resume at a later stage.
In the bigger picture, price actions from 151.93 high are currently seen as a corrective pattern to the long term up trend. The first leg should have completed at 127.20. Rebound from there is seen as the second leg. Sustained break of 31.8% retracement of 151.93 to 127.20 at 136.34 will bring stronger rebound to 61.8% retracement at 142.48. Meanwhile, break of 129.62 will argue that the third leg is starting through 127.20 low.
USD/CHF Daily Outlook
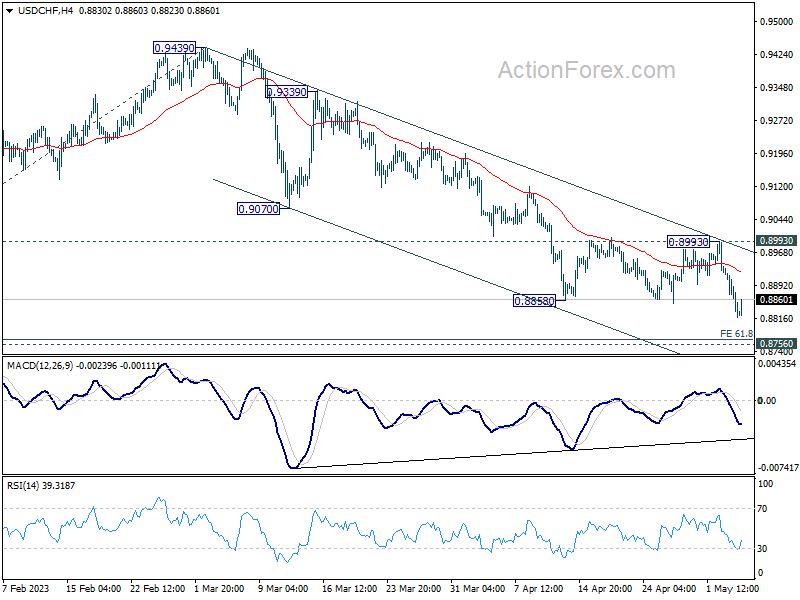
Daily Pivots: (S1) 0.8805; (P) 0.8870; (R1) 0.8906; More...
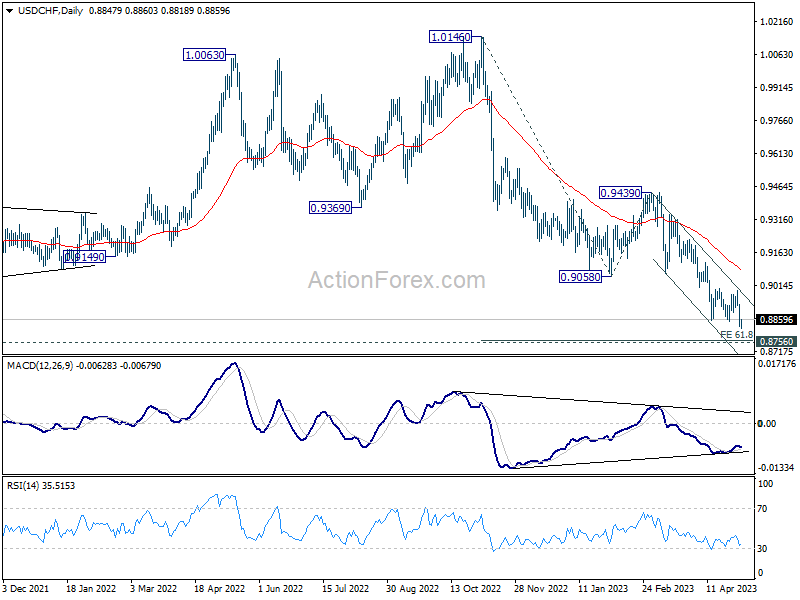
Intraday bias in USD/CHF is back on the downside on break of 0.8850 support. The down trend from 1.0146 would target 61.8% projection of 1.0146 to 0.9058 from 0.9439 at 0.8767, which is close to 0.8756 long term support. Strong support is expected there to bring rebound, at least on first attempt. On the upside, break of 0.8993 resistance will indicate short term bottoming, on bullish convergence condition in 4H MACD, and turn bias back to the upside for stronger rebound.
In the bigger picture, fall from 1.1046 (2022 high) is in progress for 0.8756 support (2021 low). But overall, this fall is still seen as a leg in the long term range pattern from 1.0342 (2016 high). So, downside should be contained by 0.8756 to bring reversal. Sustained break of 0.9058 support turned resistance will be the first sign of medium term bottoming. However, decisive break of 0.8756 will carry larger bearish implications.
GBP/USD Daily Outlook
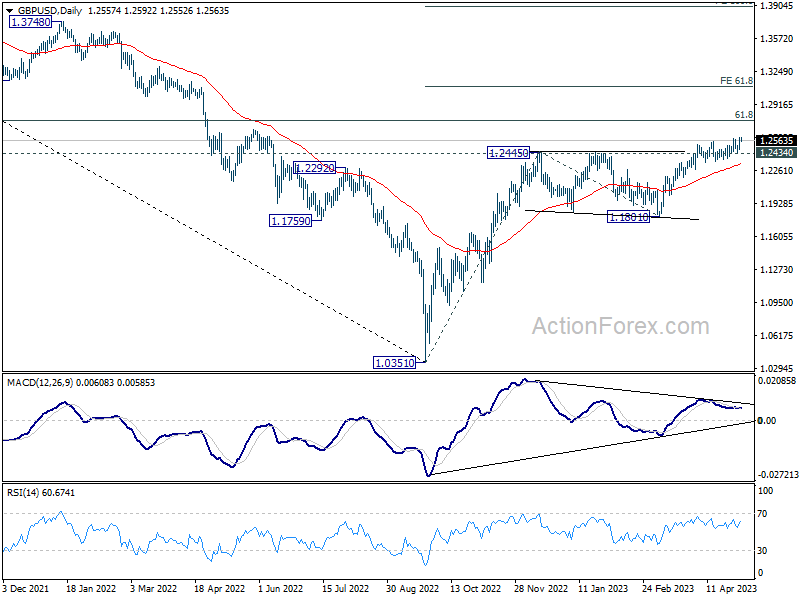
Daily Pivots: (S1) 1.2489; (P) 1.2539; (R1) 1.2616; More...
Intraday bias in GBP/USD is back on the upside as recent up trend resumes by breaking 1.2582. Further rally should target 1.2759 fibonacci level first. Firm break there will target 61.8% projection of 1.0351 to 1.2445 from 1.1801 at 1.3095. However, considering bearish divergence condition in 4H MACD, break of 1.2434 support will indicate short term topping, and turn bias back to the downside for deeper pull back.
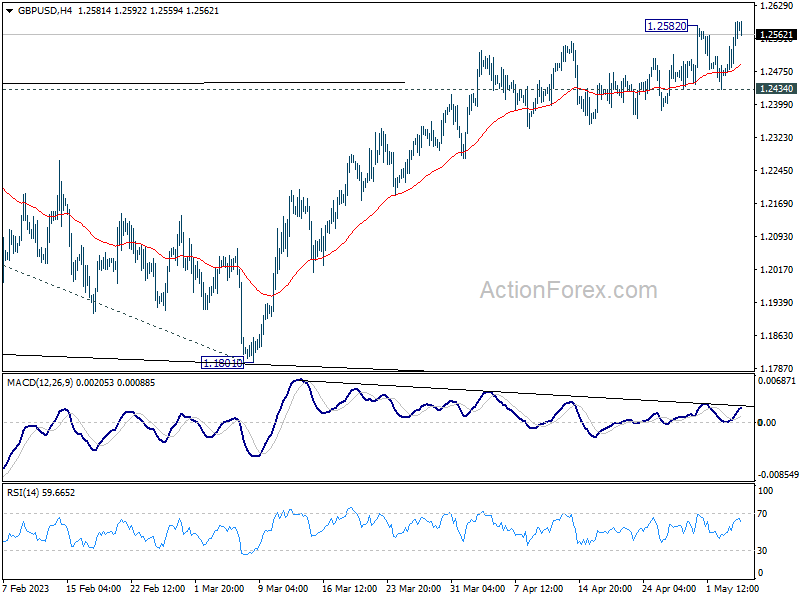
In the bigger picture, the rise from 1.0351 medium term term bottom (2022 low) is in progress for 61.8% retracement of 1.4248 (2021 high) to 1.0351 at 1.2759. Sustained break there will add to the case of long term bullish trend reversal. Further break of 61.8% projection of 1.0351 to 1.2445 from 1.1801 at 1.3095 could prompt upside acceleration to 100% projection at 1.3895. For now, this will remain the favored case as long as 1.1801 support holds, even in case of deep pull back.
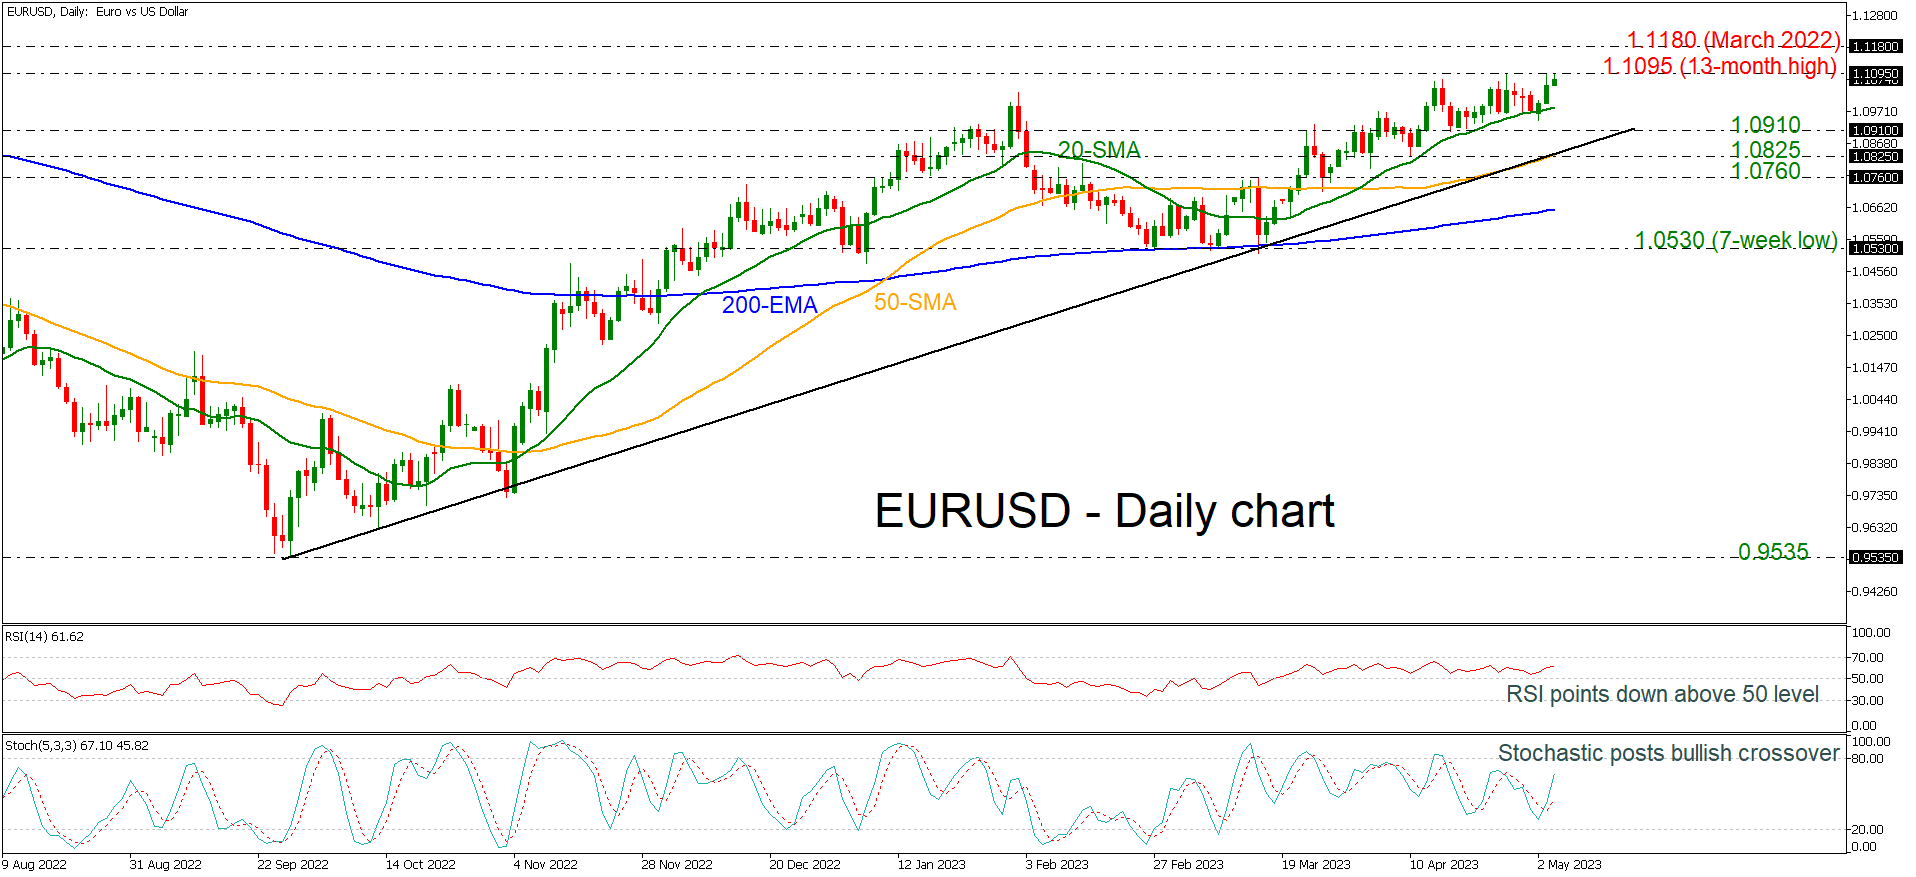
EURUSD Retests 13-month High Ahead of ECB Meeting
EURUSD is attempting once more to climb above the 13-month high of 1.1095, endorsing the long-term upside structure. This outlook is reinforced by the RSI, which is rising and remaining above its neutral threshold of 50. In addition, the stochastic oscillator displayed a bullish crossover between its %K and %D lines and is approaching the overbought area.
In the event of an upward price movement, the immediate 13-month high of 1.1095 that coincides with the 200-weekly simple moving average (SMA) may act as a barrier before the March 2022 high of 1.1180 can be challenged. Above these levels, the 1.1500 psychological mark, registered in February 2022 may halt bullish actions.
On the other hand, any declines should reach the 20-day SMA at 1.0980 prior to encountering the subsequent obstacles at 1.0910 and 1.0825, which are located close to the 50-day SMA. A drop below the long-term uptrend line could pave the way for the 1.0760 support and, more significantly, the 200-day EMA at 1.0650, thereby neutralizing the outlook.
To conclude, given that the pair is trading above the short-term SMAs and the uptrend line, the market appears to be in a bullish phase.
Asian Stock Markets Rejoiced Post-FOMC
- US stock indices spooked by Fed Chair Powell’s “hawkish” comments.
- USD sold off while safe haven currencies, JPY & CHF in demand.
- Asian stock market outperformed while Hong Kong indices rebounded from the key 200-day moving average.
No surprise from the US central bank, Federal Reserve’s policy meeting outcome yesterday where the Fed hiked its policy Fed funds rate by 25 basis points as expected, its 10th hike in this current tightening cycle to a target range of 5% to 5.25%.
Most importantly, it has signalled a potential pause on its current interest hiking cycle via a change of tonality in its monetary policy statement; it no longer says it “anticipates” further rates will be needed, only that it will watch incoming data to determine if more hikes “may be appropriate.”
The surprising bit came during Fed Chairman Powell’s press conference where he made several “hawkish” comments that implied the current stance of the Fed’s operating modus to be skewed towards inflation targeting rather than to address the potential credit crunch from the US regional banking turmoil that can lead to slower economic growth and a weak labour market;
“Conditions in the banking sector have improved.”
“We’re committed to our inflation target of 2%.”
“The labour market remains very tight.”
“The case of avoiding a recession is more likely than having one.”
Overall, the US stock market did not respond positively to such comments and sold off with all three major indices ending the US session with losses; S&P 500 (-0.70%), Nasdaq 100 (-0.64%) and Dow Jones Industrial Average (-0.80%).
The underperformers were the financials and banks with the SPDR S&P Regional Banking ETF plummeting by -1.80% as fears of further stress on the balance sheets of the US regional banks persist. Not helping much to alleviate such fears was the latest negative news flow from PacWest Bancorp, a California-based mid-sized US bank that saw its share price plunged by -50% in after-hours trading when it announced that it was exploring a strategic sale.
A rate cut is priced in for the September FOMC
Despite the hawkish tonality from Fed Chair Powell, markets are still expecting a Fed pivot to kickstart a fresh interest rate cut cycle before 2023 ends. Based on the CME Watch FedWatch tool derived from pricing data implied by the 30-day Fed Funds futures has indicated an 89% chance of a 25 basis points rate cut during the 20 September 2023 FOMC meeting.
This heightened expectation of a first Fed funds rate cut in September has led the front end of the US Treasury yield curve which is more sensitive to changes in monetary policy to drop more than the longer end; the 2-year US Treasury yield dropped by 16 basis points to close yesterday US session at 3.81%, a five-week low.
USD sold off & safe haven currencies, JPY and CHF in demand
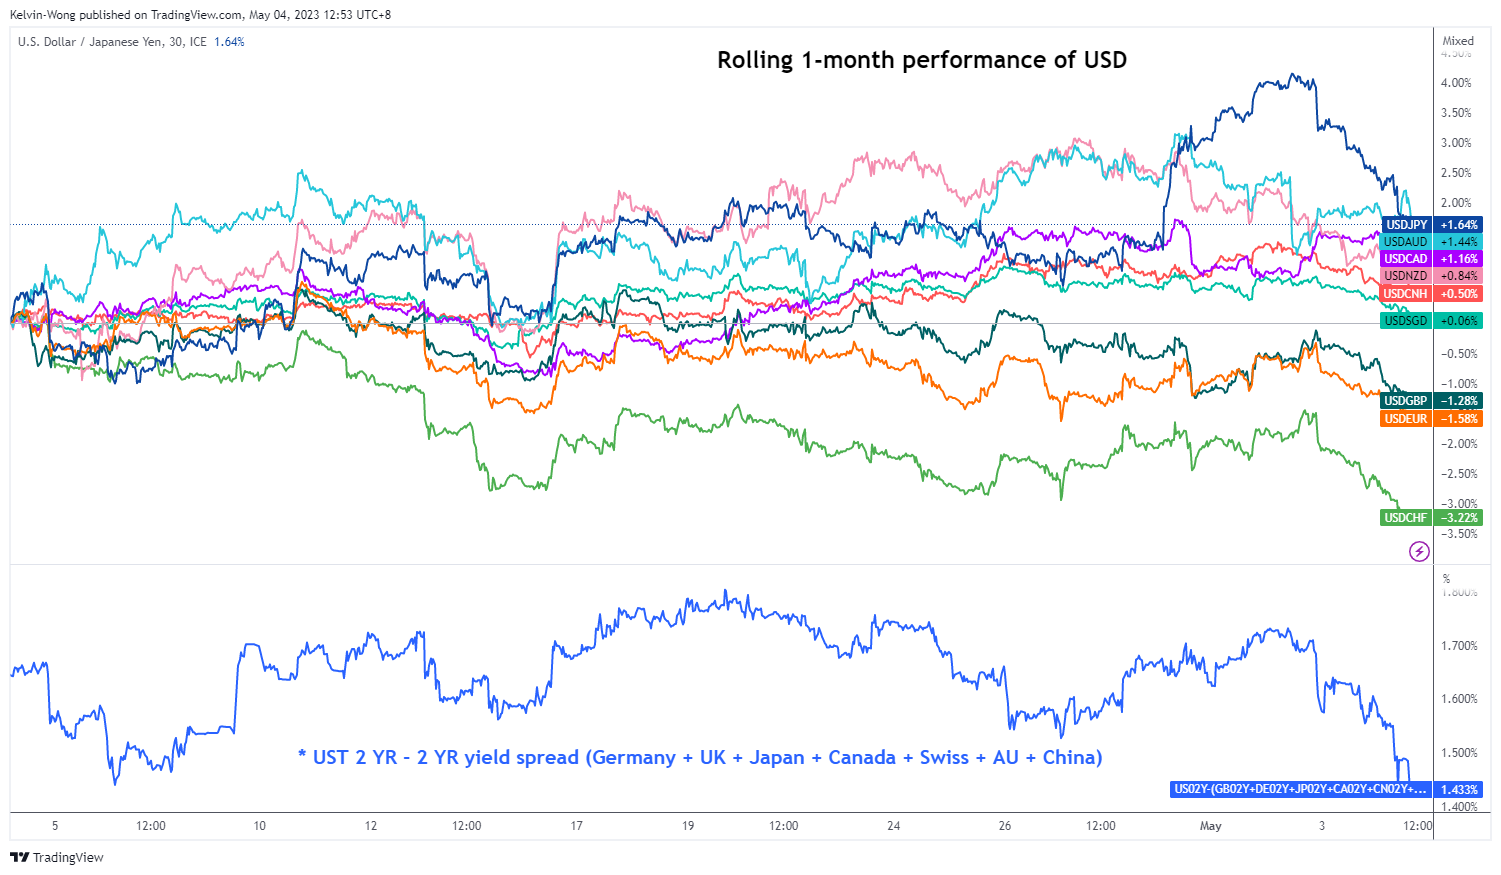
Fig 1: Rolling 1-month performance of USD against major currencies with CNH & SGD as of 4 May 2023
(Source: TradingView, click to enlarge chart)
The recent drop in the 2-year US Treasury yield has led to a further compression of the 2-year US Treasuries yield premium against the rest of the world; US yield over a basket of equally weighted sovereign yields of Germany, United Kingdom, Japan, Canada, Switzerland, Australia, and China has shrunk to 1.43% from 1.73% seen at the start of this week.
The shrinkage of the US yield premium factor explains the current weakness seen in the US dollar as for the heightened overnight demand for the JPY and CHF, it can be attributed to the typical “flight to safe haven” sentiment due to persistent share price weakness of the US regional banks that triggered a resurgence of systemic risk and heightened geopolitical tensions in the on-going Russia-Ukraine conflict where the Kremlin was hit by a drone attack.
Interestingly, last Friday’s gains of the USD/JPY induced by the Bank of Japan’s dovish monetary policy stance have been wiped out as it dropped by 330 pips from its recent 2 May high of 137.77 to 134.50 and traded below the key 200-day moving average at this time of the writing.
Asian stock indices outperformance against the US
Fed Chair Powell spooked US stock traders post-FOMC press conference while the Asian stock market rejoiced today. Most of the Asian benchmarks have recorded intraday gains with Hong Kong being the top performer; Hang Seng Index (+1%), Hang Seng China Enterprise Index (+1.6%) and Hang Seng TECH Index (+0.6%). Even the mainland China CSI 300 recorded just a minor loss of -0.1% after it reopened today from its Labour Day Golden Week holiday despite a consensus forecast miss on the China Caixin Manufacturing PMI that contracted to 49.5 in April from 50.0 printed in March.
Two primary reasons that account for today’s Asian stock indices’ robust performances. Firstly, it is the broad-based USD dollar weakness that also led to a drop in the USD/CNH (offshore yuan) to print a 5-day low of 6.8965 which implied a lower cost of funding on US dollar-dominated corporation debts in Asia.
Secondly, it is momentum driven; both Hang Send Index and Hang Seng China Enterprise Index have managed to retest and staged a rebound right at their respective 200-day moving averages yesterday where it has triggered by positive follow-through today supported by a weaker US dollar. Short-term traders chased such bullish technical signals which in turn created a positive feedback loop.
Hong Kong 33 Technical Analysis – Positive elements sighted at key 200-day moving average
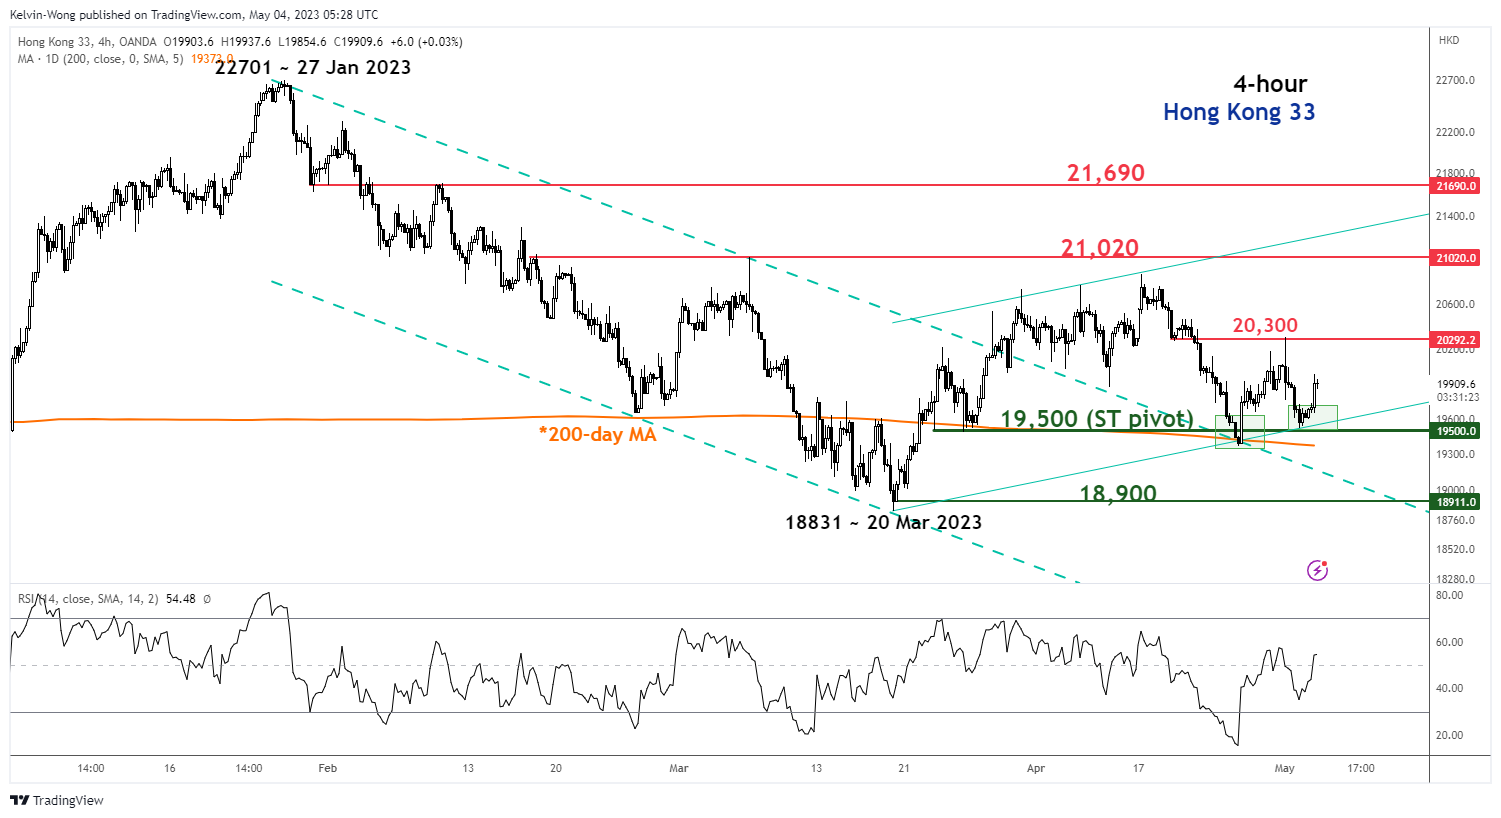
Fig 2: Hong Kong 33 trend as of 4 May 2023 (Source: TradingView, click to enlarge chart)
The recent multi-week decline of -7% seen on the Hong Kong 33 Index (a proxy for the Hang Seng Index futures) from its 17 April 2023 high of 20,873 has managed to retest, staged a rebound and formed a “higher low” right at its key 200-day moving average where it has traded above it since 22 March 2023.
Current price actions suggest the Index may now have started to evolve into a short-term ascending channel in place since the 20 March 2023 low of 18,831 which implies a potential short-term uptrend may be in progress above the 19,500 key short-term pivotal support.
A clearance above the 20,300 intermediate resistance may see the next resistance coming in at 21,020 in the first step. However, a break with a four-hour close below 19,500 invalidates the short-term uptrend to expose the next support at 18,900.
Fairly Calm Build-up to ECB Policy Meeting
Markets
The Fed yesterday raised policy rates by the expected 25 bps to 5-5.25%. The job market is robust, unemployment low and inflation elevated. At the same time, the recent banking stress did result in tighter credit conditions of which the impact remains uncertain. This brought about a more neutral policy guidance. The Committee no longer formally anticipates “some additional policy firming” but it does not rule it out outright either: “In determining the extent to which additional policy firming may be appropriate to return inflation to 2 percent over time, the Committee will take into account the cumulative tightening of monetary policy, the lags with which monetary policy affects economic activity and inflation, and economic and financial developments.” In practice this means the Fed, at least temporary, hit the pause button in the tightening cycle. Markets went further and called the end. Chair Powell during the press conference pushed back against the idea of rate cuts by the end of the year, referring to expectations of inflation to decline only slowly. But markets doubled down nonetheless, pricing in about 75 bps by the end of the year. US yields were pressured lower across the curve with changes between 3 bps (30-y) to 15.6 bps (2-y). The move down was reinforced by a Bloomberg report that PacWest, another regional bank under market scrutiny, is weighing “strategic options”, including a sale. Similar headlines preceded First Republic Bank’s eventual takeover. PacWest’s share tumbled 60% in after-market trading, putting markets on edge. The dollar slid. EUR/USD came close to the YtD high of 1.1095 but eventually closed at 1.106 with most of the appreciation having occurred in the run-up to the Fed meeting. The trade-weighted index eased to 101.34. The yen was yesterday’s star performer. USD/JPY fell below 135 with the intraday move covering almost two big figures. US indices ended between 0.46% and 0.80% in the red.
Yesterday’s fall-out on Asian markets this morning is relatively limited, meaning a fairly calm build-up to this afternoon’s ECB policy meeting. Admittedly, Japan is closed for business. Money markets expect Frankfurt to ease the tightening pace and raise rates by 25 bps to 3.25%. Analyst estimates shifted from 50 bps last week to 25 bps as well, following this week’s inflation numbers and BLS. We do not think that an acceleration to 7% headline inflation and near-record core inflation of 5.6% justifies a downshift of the pace just yet. And while the BLS did reveal a significant further tightening of credit conditions, it didn’t come as a huge negative surprise. It is indeed what the ECB and its policy is aiming for. In contrast to the Fed, the ECB won’t hint at a pause anytime soon. That clearer tightening bias should both support German/European yields and the euro. EUR/USD is currently testing the YtD high. It won’t take much euro strength for a break higher. That brings 1.1274 (61.8% retracement of the 2021-2022 decline) on the radar.
News Headlines
The Czech National Bank kept its policy rate unchanged at 7%. Unlike previous meetings, three (vs one) out of seven governors voted in favour of hiking rates by 25 bps. The Bank Board will wait for further data and will assess them. It will decide at its next meeting whether rates will remain unchanged or increase. The threat of inflation expectations becoming unanchored, the related risk of a wage-price spiral and expansionary fiscal policy are the key upside inflation risks. In its updated baseline scenario, the CNB expects inflation to average 11.2% in 2023 (from 10.8% in February) before falling to 2.1% in 2024 (unchanged). This suggests that real interest rates are to become distinctly positive for the first time in many years as the CNB pushes back against premature market expectations regarding the timing of a first rate cut. A stronger than expected Czech koruna in the meantime did part of the lifting, creating tighter monetary conditions. The CNB now pencils in an average EUR/CZK rate of 23.7 for this year compared to 24.5 in February. Next year, the average expected FX rate stands at 24.30. The central bank raised its GDP forecasts for this year and next from respectively -0.3% and 2.2% to +0.5% and 3%, but remains cautious on consumption and notes slowdown in growth of bank loans to households and firms. Czech swap rates added up to 25 bps at the front end of the curve yesterday with the 10-yr segment around 10 bps higher. The Czech koruna profited only modestly in a volatile risk environment and ahead of today’s ECB decision with at EUR/CZK 23.50 holds near strongest CZK-levels since 2008.