Sample Category Title
EUR/AUD Daily Outlook
Daily Pivots: (S1) 1.5298; (P) 1.5371; (R1) 1.5481; More...
EUR/AUD's rally resumed and break of 1.5396 resistance carries some larger bullish implication. Intraday bias is back on the upside for 161.8% projection of 1.4281 to 1.4965 from 1.4716 at 1.5823. For now, outlook will remain bullish as long as 1.5165 support holds, in case of retreat.
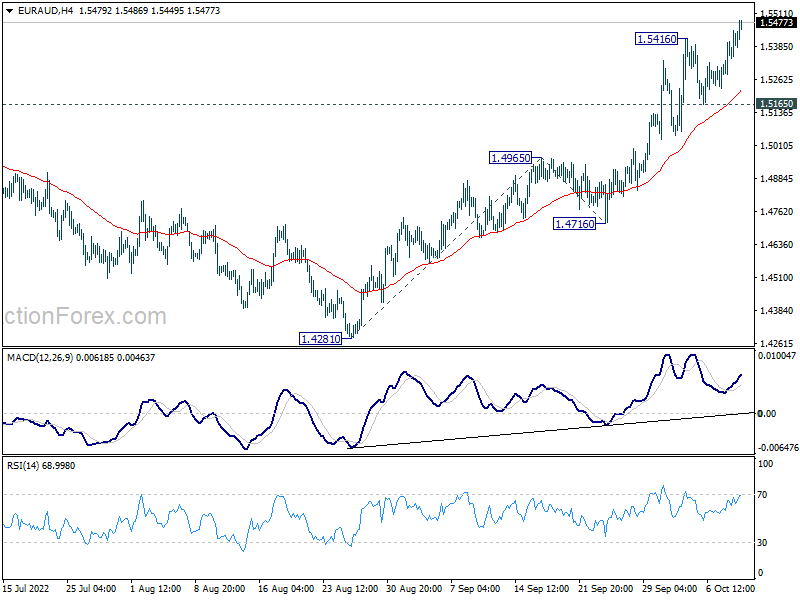
In the bigger picture, a medium term bottom should be in place at 1.4281, on bullish convergence condition in daily MACD. Further rise would be seen back to 1.6434 key resistance next. Break of 1.4965 resistance turned support is needed to indicate reversal. Otherwise, further rally will remain in favor.
EUR/CHF Daily Outlook
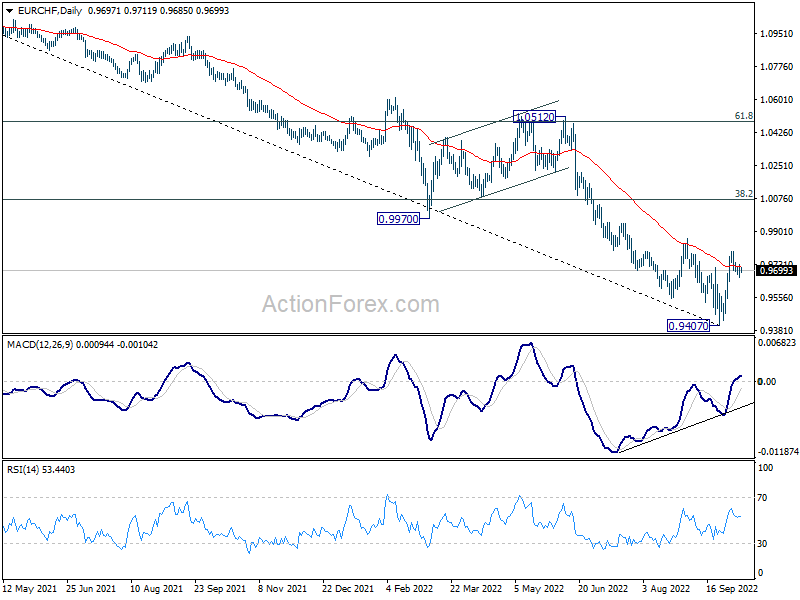
Daily Pivots: (S1) 0.9667; (P) 0.9697; (R1) 0.9734; More....
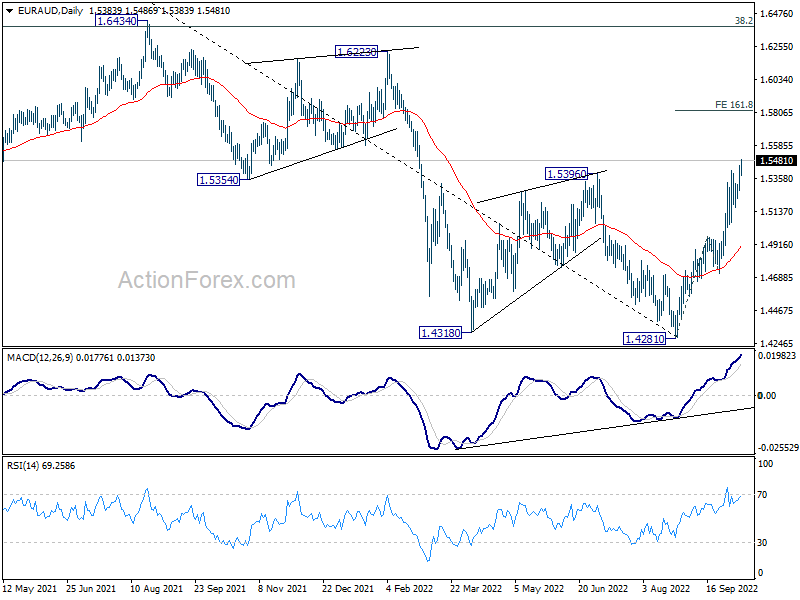
Range trading continues in EUR/CHF and intraday bias remains neutral for the moment. On the upside, above 0.9798 will resume the rebound to 0.9864 resistance. Firm break there will solidify the case of medium term bottoming at 0.9407, and target 38.2% retracement of 1.1149 to 0.9407 at 1.0072. On the downside, below 0.9641 minor support will turn bias back to the downside for retesting 0.9407 low instead.
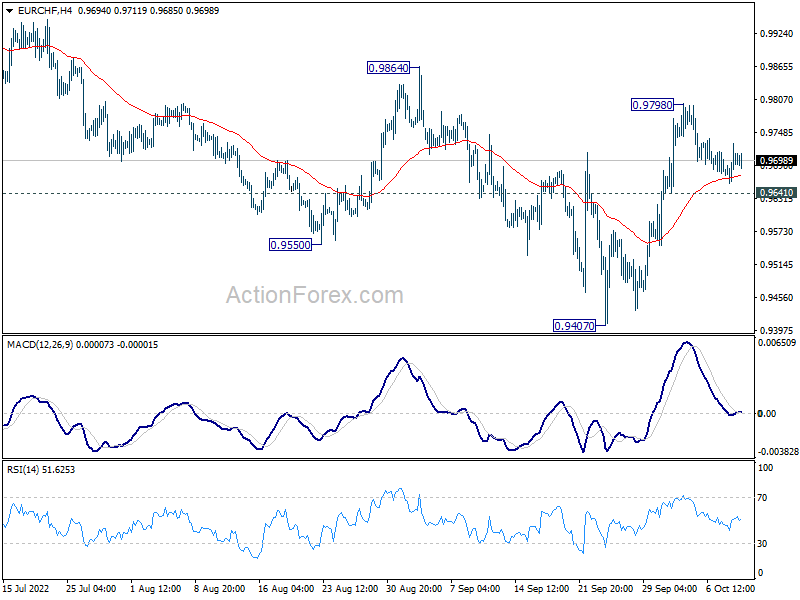
In the bigger picture, as long as 0.9864 resistance holds, long term down trend from 1.2004 (2008 high) is expected to continue. Next target is 138.2% projection of 1.2004 to 1.0505 to 1.1149 at 0.9033. However, firm break of 0.9864 will confirm medium term bottoming, on bullish convergence condition in daily MACD. Stronger rally would then be seen back to 55 week EMA (now at 1.0152), even as a corrective rebound.
EUR/USD Daily Outlook
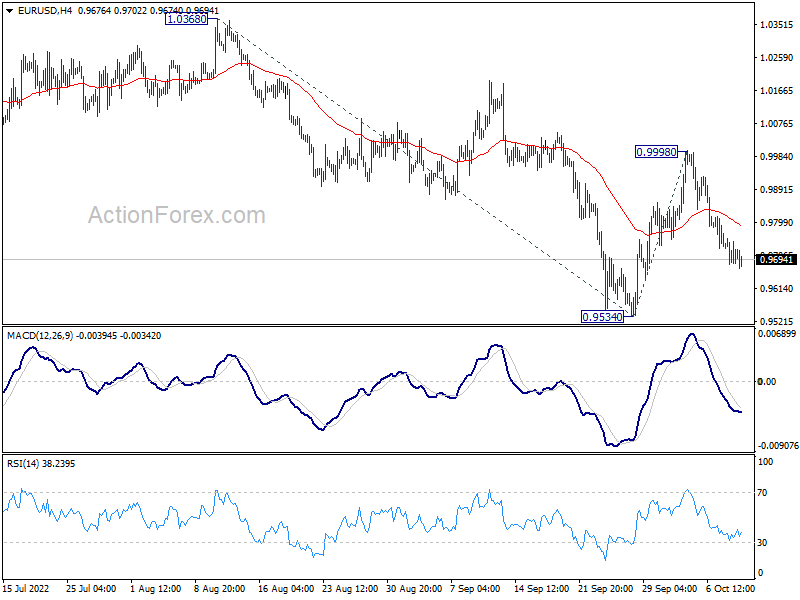
Daily Pivots: (S1) 0.9670; (P) 0.9715; (R1) 0.9748; More...
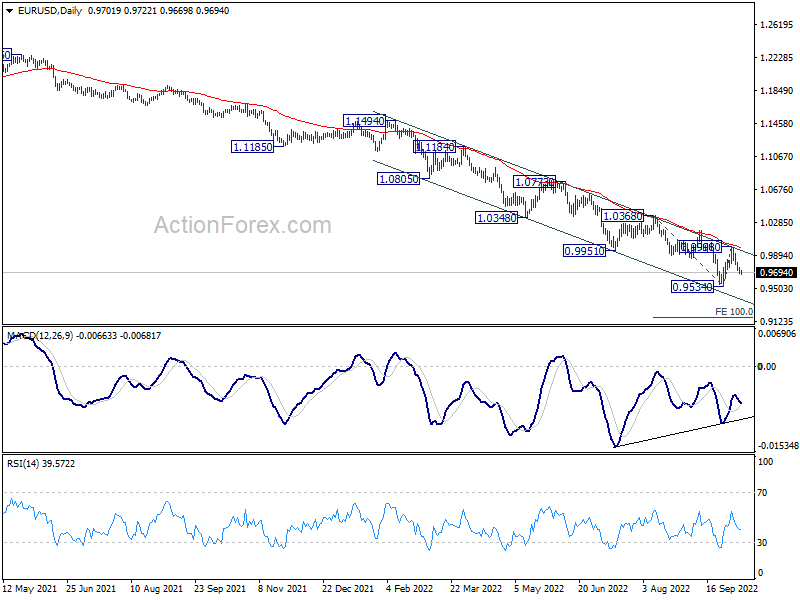
Intraday bias in EUR/USD remains on the downside for retesting 0.9534 low. Firm break there will resume larger down trend for 100% projection of 1.0368 to 0.9534 from 0.9998 at 0.9163. For now, risk will stay on the downside as long as 0.9998 resistance holds, in case of recovery.
In the bigger picture, down trend from 1.6039 (2008 high) is still in progress. Next target is 100% projection of 1.3993 to 1.0339 from 1.2348 at 0.8694. In any case, break of 0.9998 resistance is needed to be the first sign of medium term bottoming. Otherwise, outlook will stay bearish even with strong rebound.
GBP/USD Daily Outlook
Daily Pivots: (S1) 1.1003; (P) 1.1073; (R1) 1.1127; More...
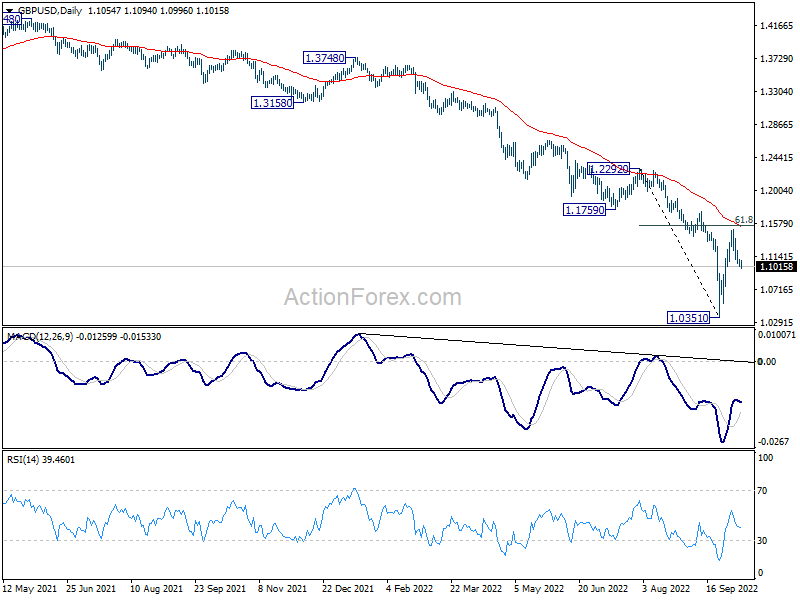
Break of 1.1023 minor support argues that GBP/USD's rebound from 1.0351 has completed at 1.1494. Intraday bias is back on the downside for retesting 1.0351 low. For now, risk will stay on the downside as long as 1.1494 resistance holds, in case of recovery.
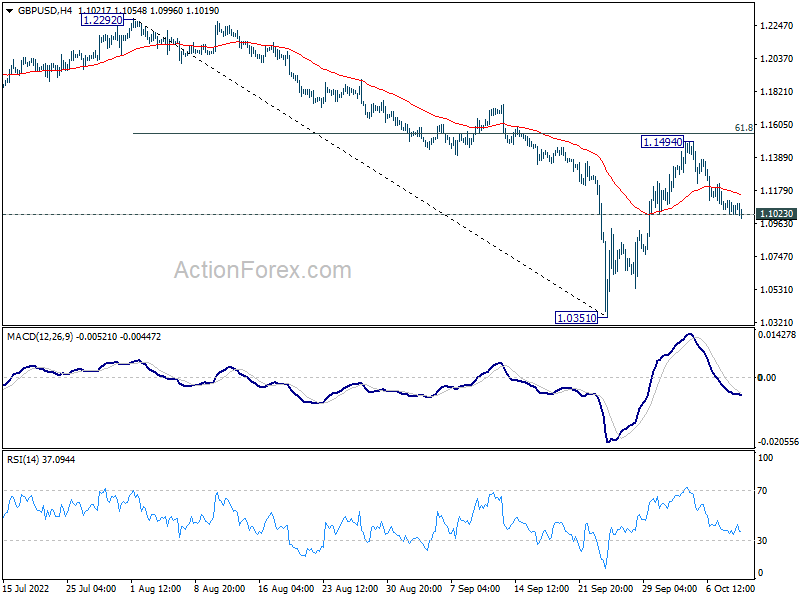
In the bigger picture, fall from 1.4248 (2018 high) is resuming long term down trend from 2.1161 (2007 high). Next target is 100% projection of 2.1161 to 1.3503 from 1.7190 at 0.9532. There is no scope of a medium term rebound as long as 1.1759 support turned resistance holds.
USD/CHF Daily Outlook
Daily Pivots: (S1) 0.9951; (P) 0.9981; (R1) 0.0030; More...
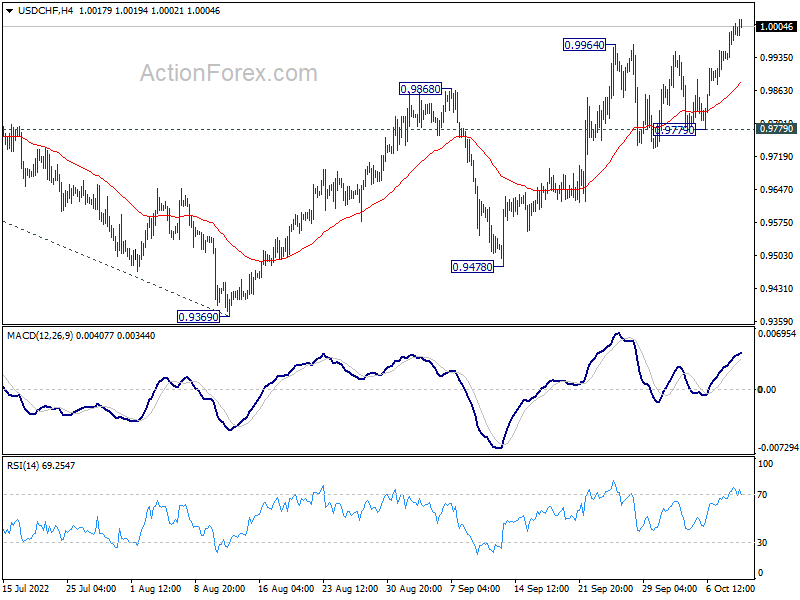
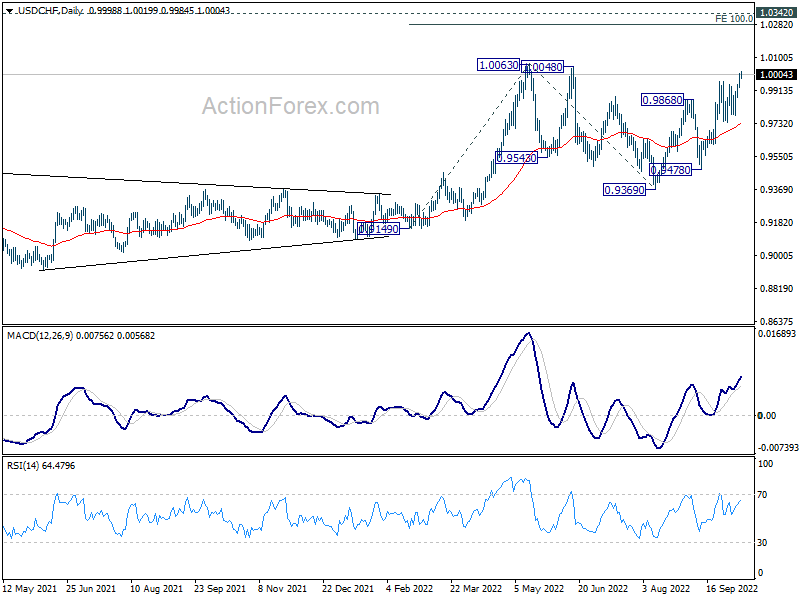
USD/JPY's rally resumed with break of 0.9964 resistance. Intraday bias is back on the upside for 1.0063 high first. Decisive break there will resume larger up trend. On the downside, break of 0.9779 support is needed to indicate short term topping. Otherwise, outlook will stay cautiously bullish in case of retreat.
In the bigger picture, current development suggests that up trend from 0.8756 (2021 low) is still in progress. Sustained break of 1.0063 will target 100% projection of 0.9149 to 1.0063 from 0.9369 at 1.0283, and then 1.0342 (2016 high). For now, this will remain the favored case as long as 0.9369 support holds, even in case of deep pull back.
USD/JPY Daily Outlook
Daily Pivots: (S1) 145.30; (P) 145.55; (R1) 145.97; More...
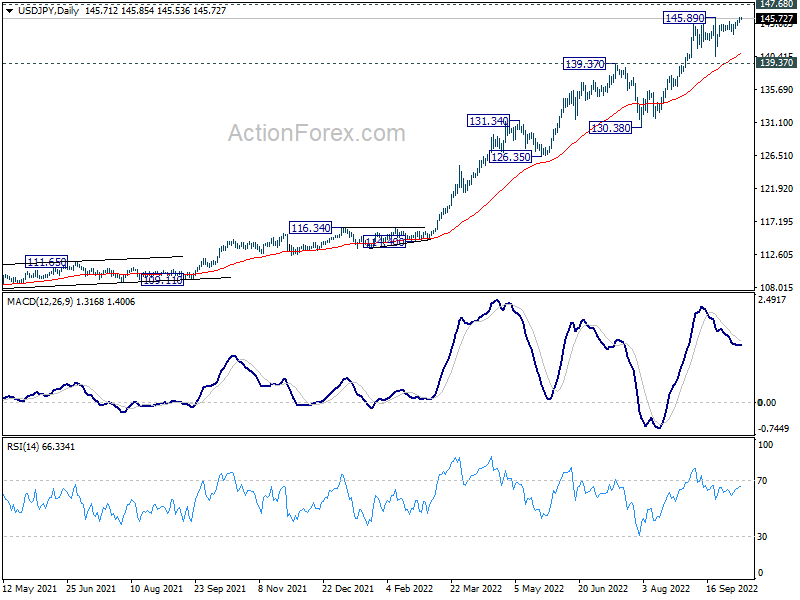
USD/JPY is still limited by 145.89 resistance and intraday bias stays neutral. Overall, further rally is expected as long as 139.37 resistance turned support holds. Break of 145.89 will target 147.68 long term resistance. On the downside, however, decisive break of 139.37 will bring deeper decline towards 130.38 support.
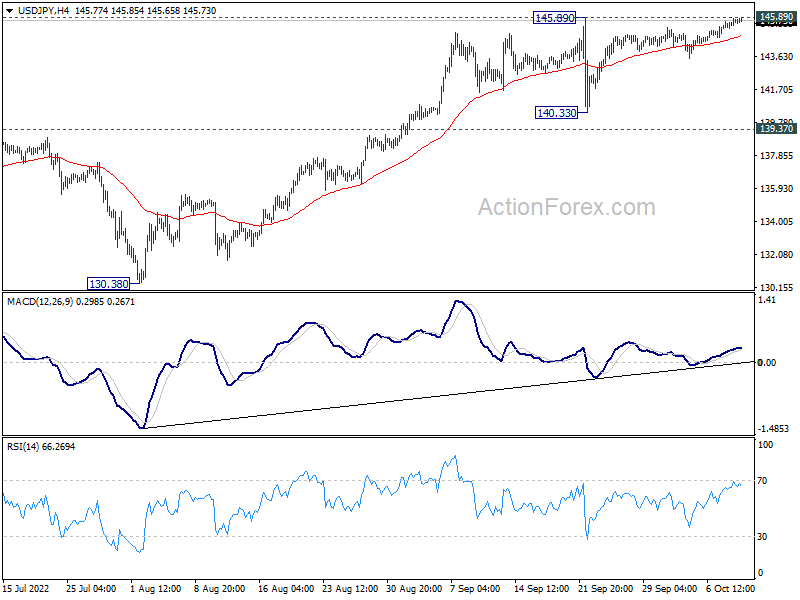
In the bigger picture, up trend from 101.18 is still in progress, as part of the whole up trend from 75.56 (2011 low). Further rise should be seen to 147.68 (1998 high). For now, break of 130.38 support is needed to be the first indication of medium term topping. Otherwise, outlook will stay bullish even in case of deep pull back.
AUD/USD Daily Report
Daily Pivots: (S1) 0.5928; (P) 0.6648; (R1) 0.7020; More...
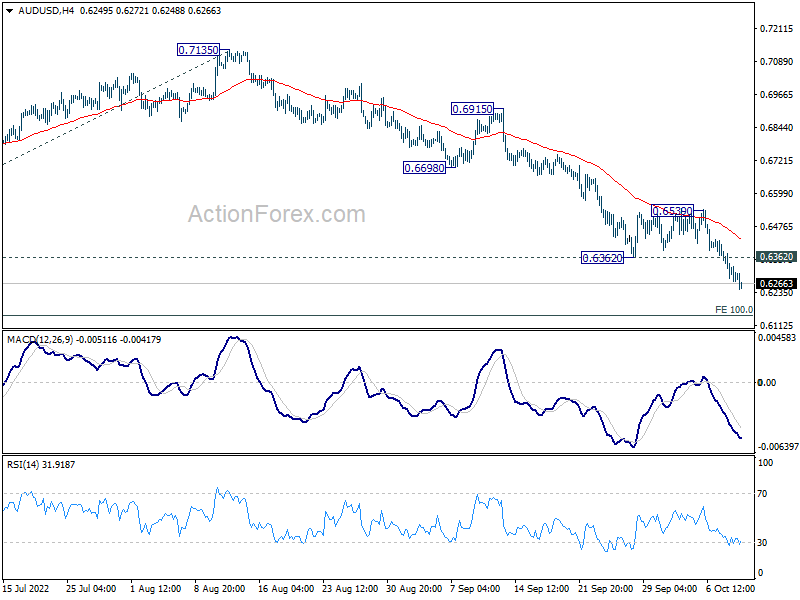
Intraday bias in AUD/USD remains on the downside for the moment. Current down trend should target 100% projection of 0.7660 to 0.6680 from 0.7135 at 0.6155 next. On the upside, above 0.6362 minor resistance will turn intraday bias neutral and bring consolidations. But outlook will remain bearish as long as 0.6539 resistance holds.
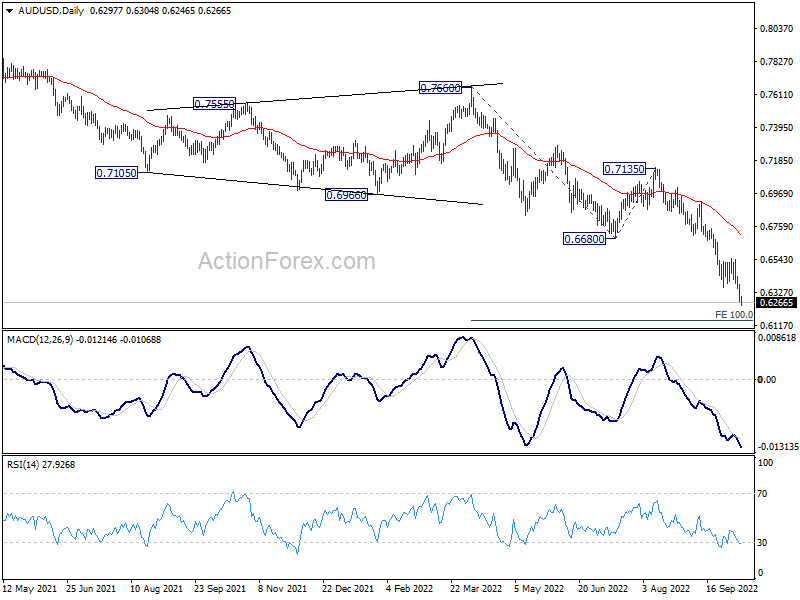
In the bigger picture, down trend form 0.8006 (2021 high) is expected to continue as long as 0.6680 support turned resistance holds. Next target is 0.5506 low. Medium term momentum will now be closely monitored to gauge the chance of break of 0.5506.
Pandemic, War, US-China Tensions, Falling Treasuries and Rising Dollar
Risk sentiment is morose this week with the escalating tensions in Ukraine, rising Covid cases in China, mounting tensions between US and China, the selloff in US and other treasuries, the relentless appreciation in the US dollar and the drop in safe haven currencies.
Rare mixture of bad news
It’s rare that we have such a sour mixture of bad news on the wire.
First, the week started with images of Russian bombs falling on Ukrainian cities following the blast on the bridge that linked Russia to Crimea. That means further escalation of the war before winter. And it’s extremely bad news.
Second, Covid cases in China rose to the highest levels in two months, fueling fears that big cities like Shanghai or Shenzhen face lockdown risks, again, at a time the government steps up efforts to contain contagion before the twice-in-a-decade Communist Party gathering where Xi Jinping will certainly be given another term.
Third, tensions between US and China escalate, as well. Joe Biden’s latest decision to further restrict chip exports to China didn’t please Chinese, nor chip investors. Nvidia took another 3% hit in the teeth yesterday and slipped below the $120 per share for the first time since March 2021. AMD fell another 1%. And the US semiconductors lost a combined $240 billion in market value globally. The slump in chip stocks also spilled over the currency markets. And the currencies of countries that export chips like Korea and Taiwan fell.
But in reality, everything slipped against the US dollar
…including currencies and assets that would normally have acted as safe havens, especially in a context of rising geopolitical tensions, and war.
The Swiss franc lost ground against the greenback and the USDCHF rose above parity. The Japanese yen continued its historic fall as well, the dollar yen advanced to 145.80.
Gold fell for the fifth day to $1660 per ounce, and is set to dive deeper toward the $1600 level on the back of a relentless rise in the US yields and the dollar.
And the US yields press higher on the back of hawkish Federal Reserve (Fed) pricing, despite a couple of less hawkish comments from some Fed members at the start of the week. Chicago Fed President Charles Evans said that he wants to quickly get to a point where policy makers can feel comfortable pausing in order to reduce the risk of overshooting. The Fed Vide Chair Brainard also sounded cautious saying that the previous rate hikes are still working through the economy.
But investors ignored the latest comments. The US 2-year yield advanced to 4.35%, and activity on Fed funds futures price 77.5% chance for a 75bp hike at next FOMC meeting. That’s higher compared to yesterday.
And the positive pressure in the US yields is nowhere close to an end as big US bond buyers are deserting the marketplace. Foreign central banks are getting out of their positions to limit the impact of the US tightening on their reserves, and the Japanese pension funds and life insurers are also reportedly selling US treasuries as they no longer provide safety and stability to their holders. The Fed’s balance sheet has started shrinking, but we are still at historically high levels – by far, and it's hard to imagine that the Fed will stop downsizing its balance sheet, especially when inflation is nowhere near where the Fed officials need it to be.
At least, the avalanche of bad global news has been successful in pulling oil prices lower yesterday. The barrel of American crude eased to $90 this morning, after having flirted with $94 a barrel on Monday.
US earnings – how bad doctor?
US earnings season kicks off in a dark and depressed environment. According to data from FactSet, the EPS growth of the S&P500 companies should fall by 2.6% to below 10% in the Q3. Analysts have cut their profit forecasts by around $34 billion. And if that’s the case, the S&P500 will record the worse quarter since the Q3 of 2020, when markets were hit by the pandemic, but at least they had the Fed on their side. Today, even the Fed is no longer here to give support.
Hardly saying the day
The Bank of England (BoE) kicked off the week by announcing more measures to support the British bond market. They will buy more bonds for the next five days to compensate for the huge fiscal spending that Liz Truss threw in the face of the market, that the market refused to finance. The BoE will also launch a longer-term facility designed to ease liquidity pressures.
It’s also ‘funny’ that after having scrapped tax cuts on UK’s high earners, the Chancellor of Exchequer also announced that he will reveal his medium-term fiscal strategy and economic forecasts before the end of the month, some three weeks earlier than he previously planned. I don’t know if investors are looking forward to it.
The Truss government made a disastrous entry to office, and thigs get more disorderly by the day. And unfortunately, extra measures announced yesterday hardly convinced investors. The British 10-year gilt yield shot up by more than 4.50%, while Cable hovered around the 1.10 mark, with a growing prospect of easing further.
Germany Said to Support EU Loans, But Not Grants
Market movers today
IMF will publish new forecasts today and will almost certainly revise lower global growth. But it will be interesting to see by how much. Their call on inflation developments will also be in focus.
The US NFIB small business optimism index is also due out. The release has some interesting sub-indices on price plans and compensation plans that adds some information to the state of inflation and labour market pressures.
In the Nordics, the Danish Economic Council publishes its' fall report.
Developments in the Russia/Ukraine war will also be followed closely following the recent reescalation. Yesterday Putin held a meeting in the Security Council, which could result in new military actions.
Today brings a bunch of labour market data from the UK and we expect the unemployment rate to be unchanged at 3.6% at the same time as wages are expected to take another step up. We acknowledge the inflationary nature of the fiscal package and thus see a large upside risk to our current call on BoE but think market pricing is too aggressive (currently 370bp until June 2023). However, today's figures will probably not ease the pricing. More important data about the economy will be released tomorrow with both production data and August GDP, which will give more information about the Q3 development.
The 60 second overview
Yesterday, Bloomberg reported that German chancellor Scholz backed joint EU debt to address the energy crisis, if given in the form of loans and not grants. Similar structure was announced during the early Covid-response phase via the SURE programme. That said, Reuters later rejected such proposal. However, the proposal comes as the fiscal support from Euro area governments is intensifying. By 15 October all EU member states have to hand in the 2023 budgets to the EC, although the SGP is suspended for 2023, so markets may discipline the member states rather than the EC themselves.
Japan's PM Kishida said in an interview that companies that pass on higher prices should also give higher wages. And the government is preparing measures to support businesses in the process. Kishida fully backs the very loose monetary policy and yield target from the BoJ.
Equities: A new week for equities but challenges remain the same and so did the reaction in markets yesterday. Indices in Asia, Europe and US all lower and with bond yields setting the direction. The post BoE emergency intervention rally in equities are now gone and several indices testing new lows. VIX rose to north of 32 yesterday all sectors lower led by long duration cyclical sectors. In US Dow -0.3%, S&P 500 -0.8%, Nasdaq -1.0% and Russell 2000 -0.60%. Sell-off in Asia intensifies this morning with tech stocks under pressure leading to big losses in Taiwan and South Korea. Weakening Asia not so much related to higher yields but rather attributed to the US export control announcement that aims to further restrict China's access to US-made semiconductor technologies. European and US futures lower as well this morning.
FI: What on paper seemed to be an uneventful session with US out for Columbus Day turned out quite volatile. Initially rates were under pressure from the UK as BoE confirmed its intention to end its temporary bond buying on Friday, but also the long end supply from EU and Germany contributed to the rates higher move. In the afternoon, Bloomberg reported that Scholz backed joint EU debt to address the energy crisis in the form of loans and not grants, which sent German yields 10bp higher on the news, ending the day 15bp higher at 2.34%. At the same time, BTPs staged a massive rally, ending the day 22bp tighter vs. Bunds. Late yesterday, Reuters published a piece with sources rejecting Scholz' view. That said, markets remain sensitive to the significant fiscal stimuli that may be coming to the market. Curves bull steepened across the board.
FX: Broad USD continues to strengthen and are closing in on September highs. Big swings in Scandies, but whereas the SEK weakened further yesterday the NOK, alike oil currencies in general, performed well, further aided by the inflation beat at home. USD/JPY are once again trading close to levels which prompted BOJ to intervene in September. The Yuan slid as well, as investors fear that Beijing will continue to uphold their Zero-Covid policy.
Credit: Yesterday, the week started on a weak footing with iTraxx main widening by 3bp to 135bp. The Xover index widened 11bp to 637bp. The leg wider was driven by a cocktail of renewed Russian aggressions and fears of further Central bank hawkishness.
Technical Outlook and Review
USD/JPY:
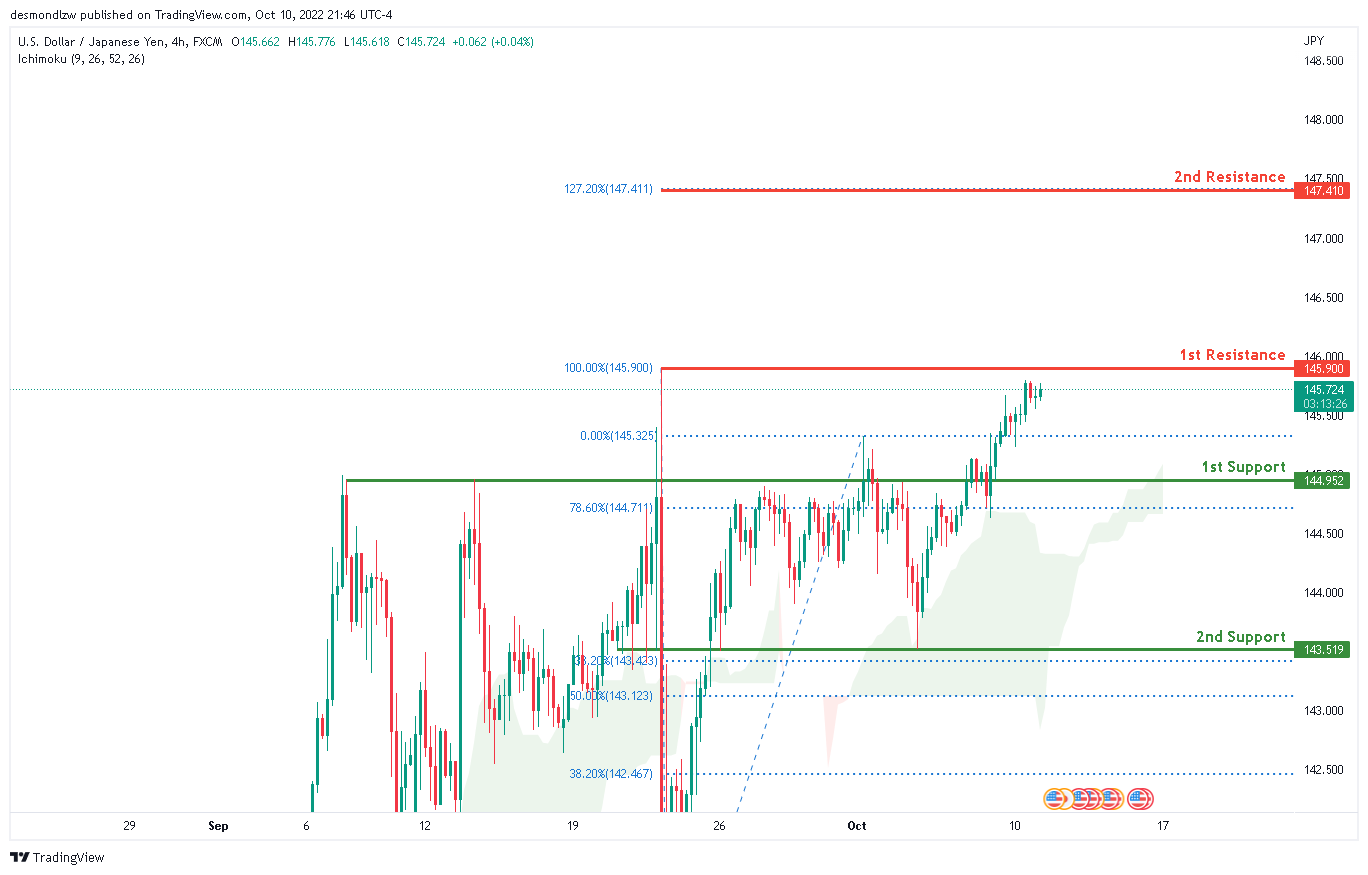
Looking at the H4 chart, the current overall bias for USDJPY is bullish . To add confluence to this bias, the price is currently above the Ichimoku cloud which indicates a bullish market. Overnight, the price has continued it’s bullish momentum upwards.. If the bullish momentum continues, expect price to possibly head towards the 1st resistance line at 145.900, where the 100% Fibonaaci line is located.
Areas of consideration:
- H4 time frame, 1st resistance at 145.900
- H4 time frame, 1st support at 144.952
DXY:
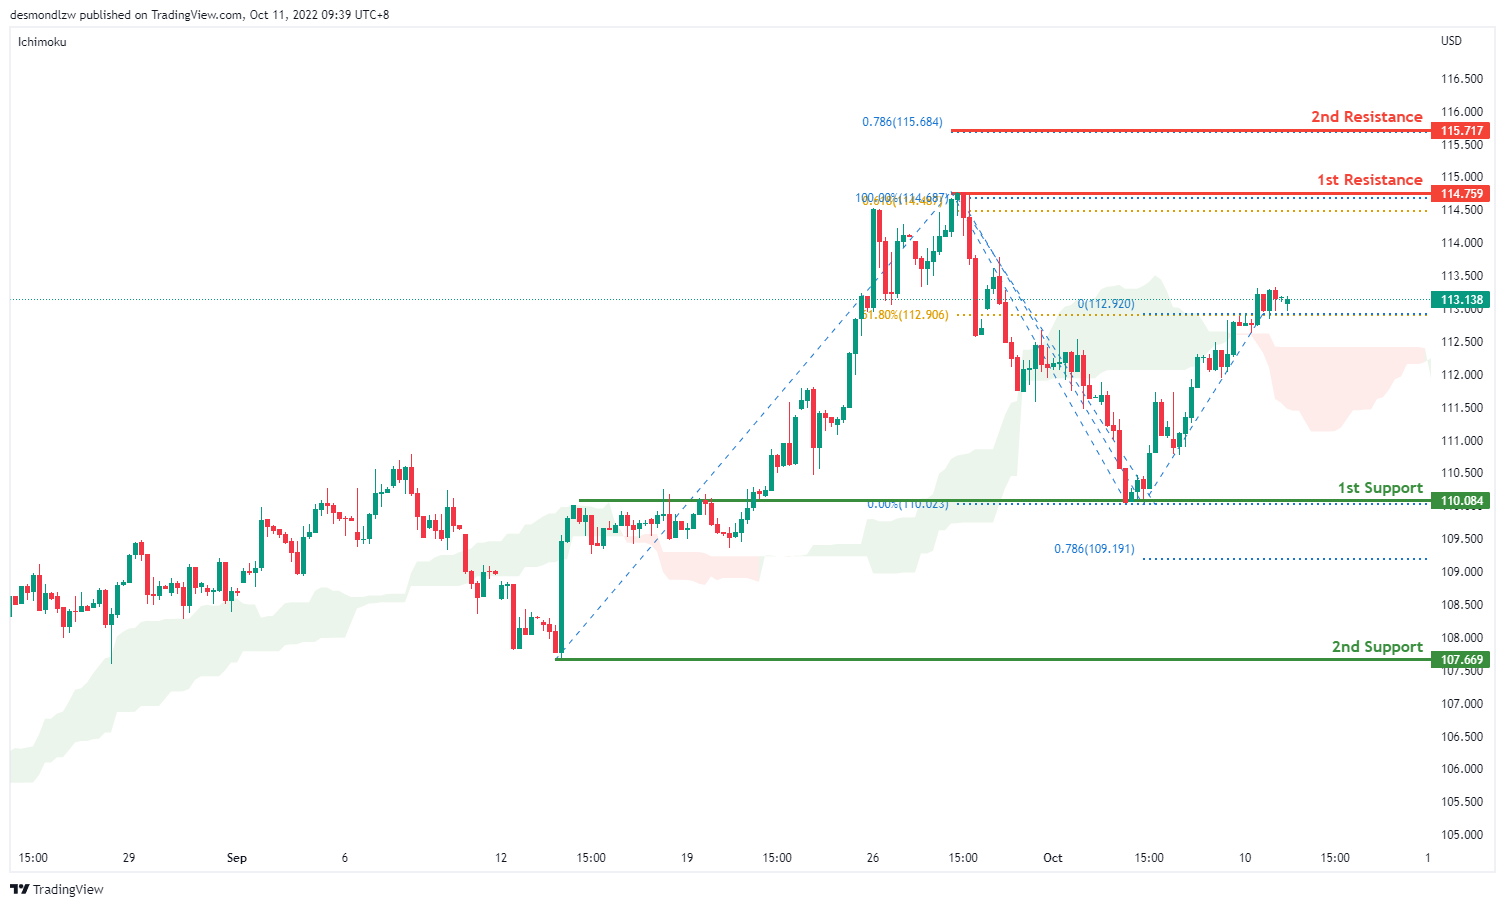
On the H4 chart, prices are moving in an ascending trend signalling slight bullish momentum. It is currently moving towards the first resistance at 114.719 where the previous swing high sits. If bullish momentum continues it will bring price to 115.717 where the 78.6% projection. Alternatively, prices could test the first support at 110.084 where the swing low sits. if it breaks this level, bearish momentum will bring price to second support at 107.669
Areas of consideration:
- H4 time frame, 1st resistance at 114.759
- H4 time frame, 1st support at 110.084
EUR/USD:
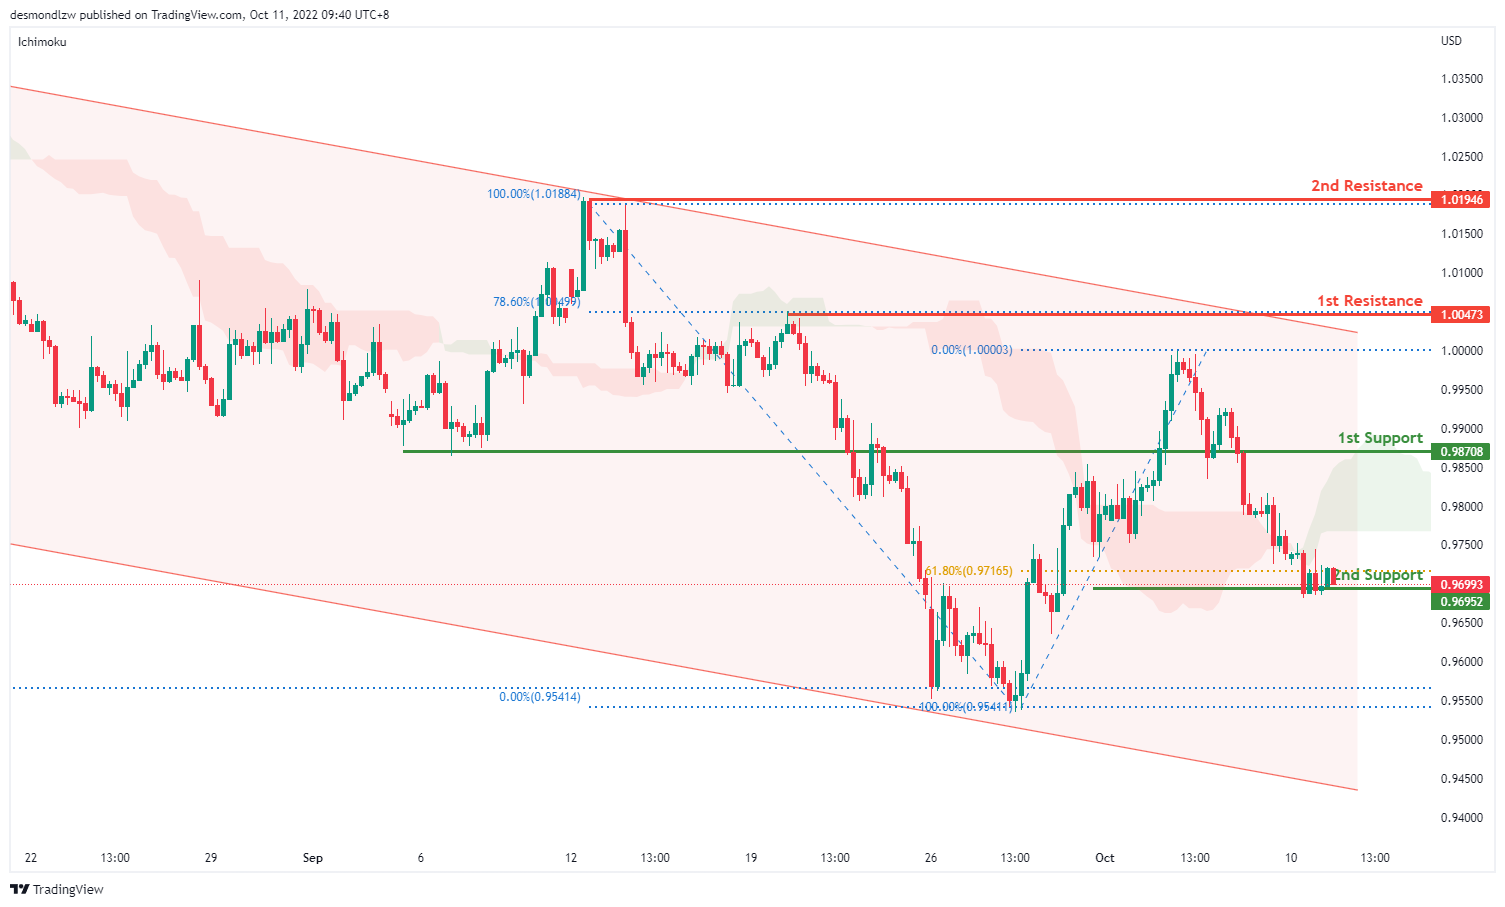
On the H4, price is moving within the descending trendline in a descending manner, with the price moving below ichimoku cloud,- we are bearish biased. Price is testing the first support at 0.9695 where the 61.8% retracement sits. If it breaks this level, bearish momentum will bring price to the second support at 0.9545 where the swing low and 161.8% extension sit. Alternatively, price may test the first resistance at 1.0047 where the 78.6% retracement sits. If price breaks this level, it may test the second resistance at 1.0194, where the previous swing high sits
Areas of consideration :
- H4 1st resistance at 1.0047
- H4 2nd resistance at 1.0194
GBP/USD:
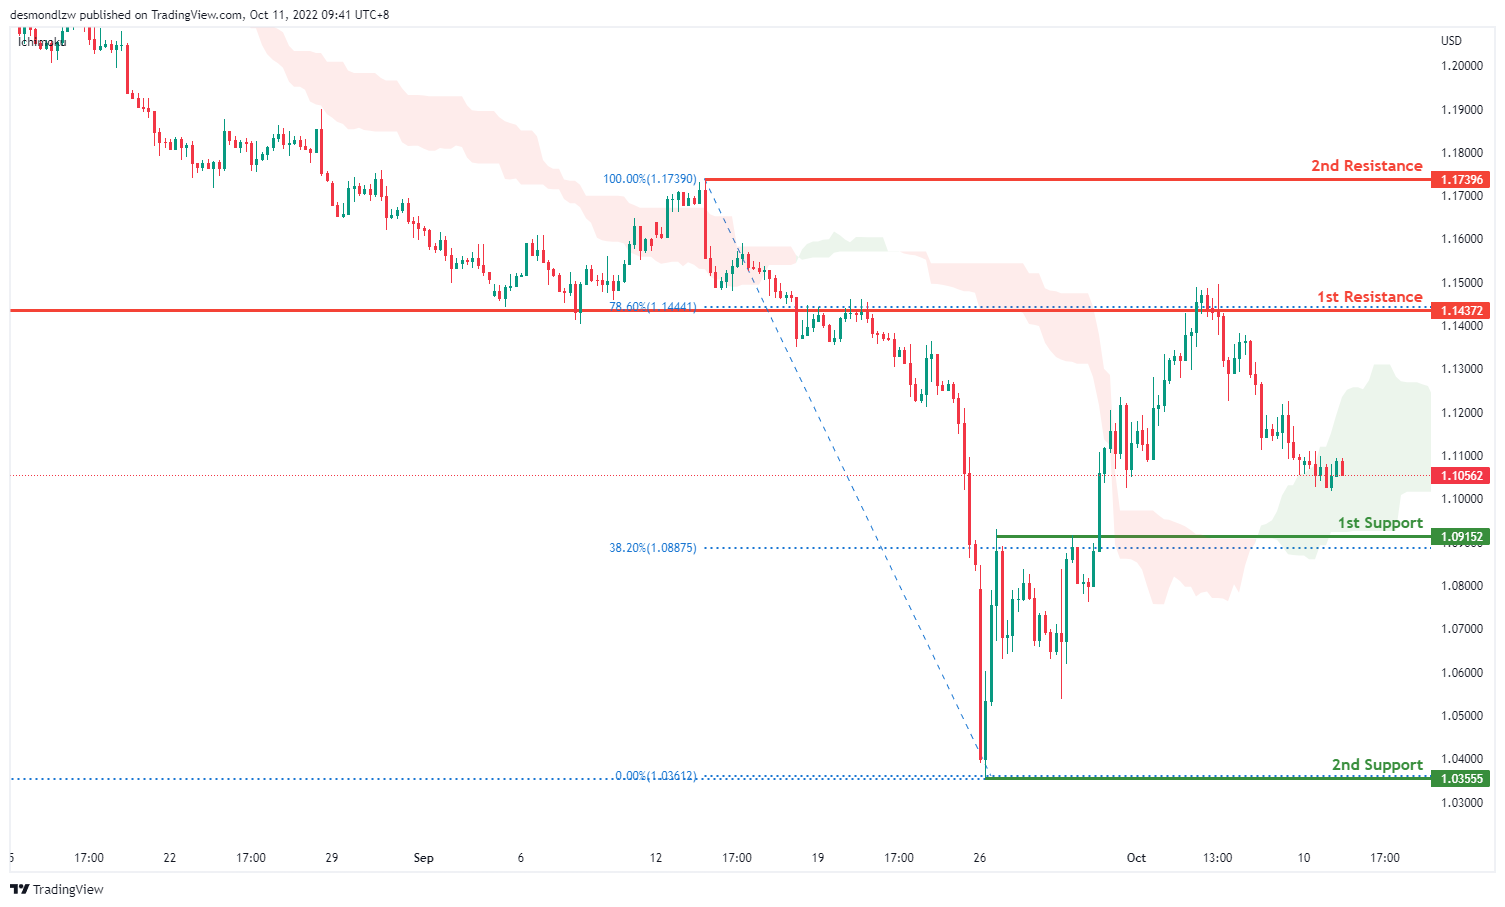
On the H4, price has rejected the first resistance and is moving in a descending trend hence we are bearish bias- price might break the ichimoku to test the first support at 1.0915 where the 38.2% retracement sits. If it breaks this level, bearish momentum will bring price to the second support at 1.0355 where the previous swing low sits. Alternatively price can test the first resistance at 1.1437 where the 78.6% retracement and overlap resistance sit. Subsequently the second resistance at 1.1739
Areas of consideration:
- H4 1st support at 1.0915
- H4 1st resistance at 1.1437
USD/CHF:
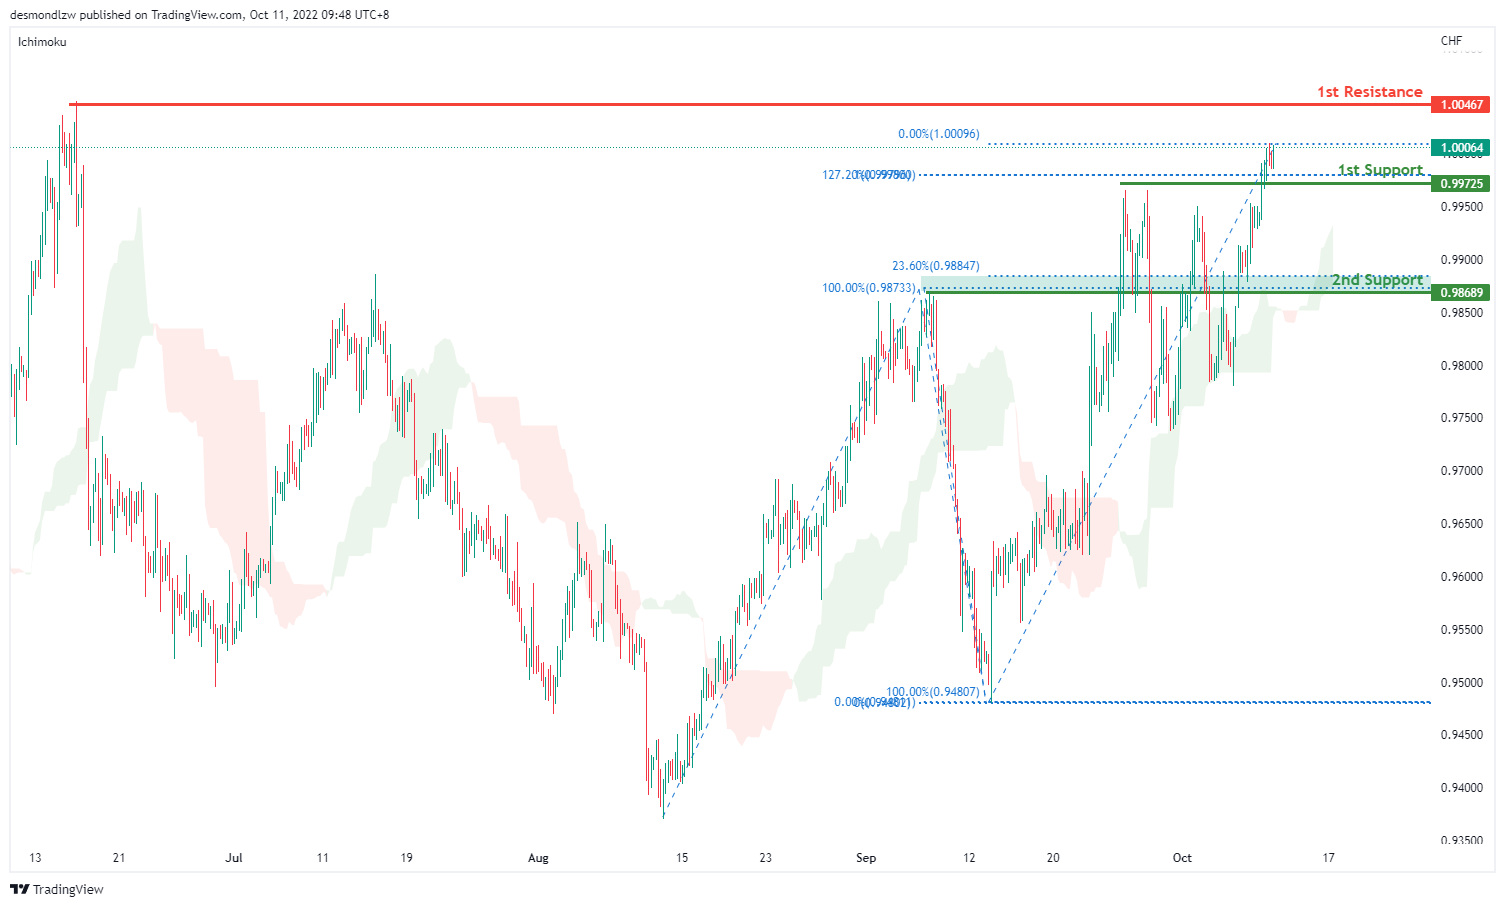
USDCHF is in a strong bullish trend on the H4 chart. Price is trading above the Ichimoku cloud signalling a bullish trend. Price looks like it’s moving toward the first resistance 1.0046 where the previous swing high sits. Alternatively price can test the first support at 0.9972 where the 127.2% extension and swing high sits then the second support at 0.9868 where the overlap support and 23.6% retracement sits
Areas of consideration
- H4 1st support at 0.9972
- H4 1st resistance at 1.0046
XAU/USD (GOLD):
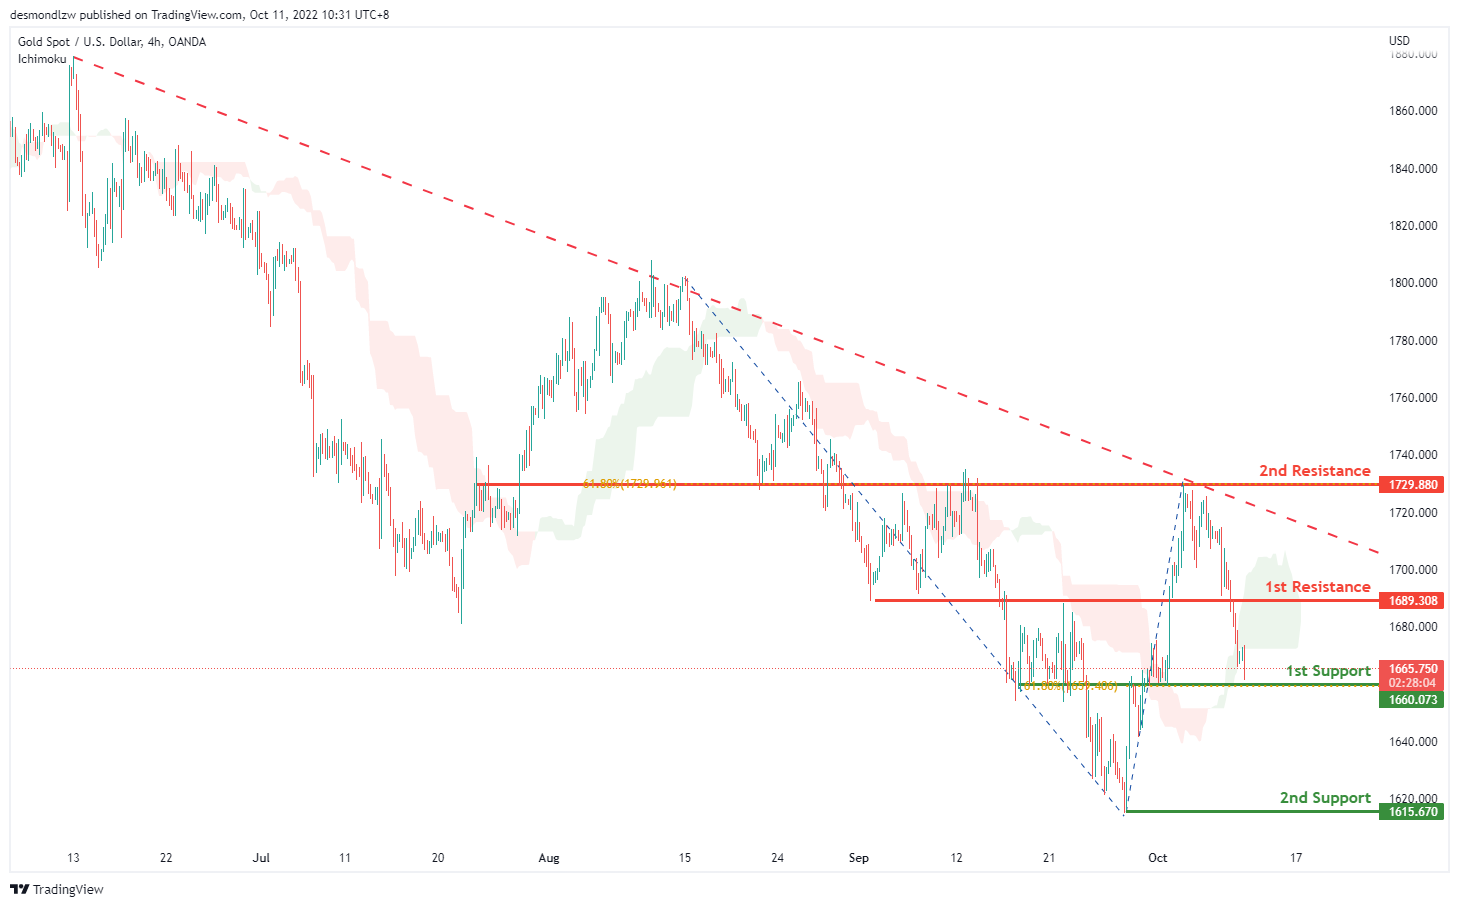
On the H4, price is dropping to test the 1st support at 1665.160, which is in line with the 61.8% fibonacci retracement and overlap support, as the price is above ichimoku cloud, we can expect the price bounce off from here and rise to the 1st resistance at 1689.308, which is in line with the overlap resistance. If the 1st resistance is broken, we can expect the price rise to the 2nd resistance at 1729.880, where the 61.8% fibonacci retracement and previous swing high is. Alternatively, the price may break the 1st support and drop to the 2nd support at 1615.670, where the swing low is.
Areas of consideration:
- H4 time frame, 1st support at 1665.160
- H4 time frame, 2nd resistance at 1729.880
AUD/USD:
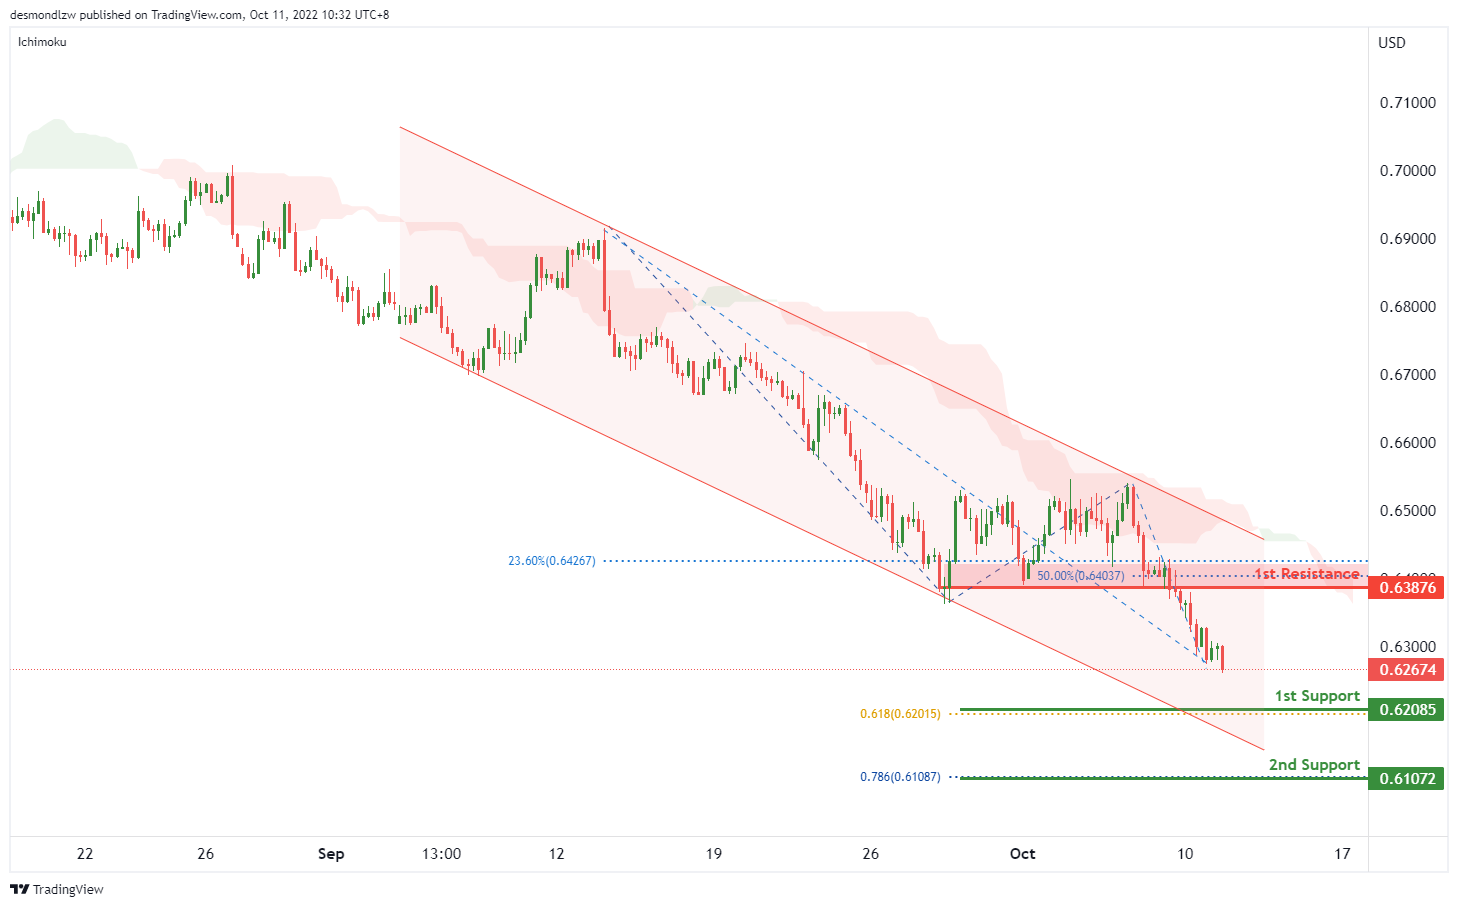
On the H4, the price is moving within the descending channel and below ichimoku cloud, we have a bearish bias that the price may drop to the 1st support at 0.62085, which is in line with the 61.8% fibonacci projection. If the 1st support is broken, the 2nd support could be at 0.61072, where the 78.6% fibonacci projection is. Alternatively, the price may rise to the 1st resistance at 0.63876, which is in line with the 23.6% fibonacci retracement and 50% fibonacci retracement.
Areas of consideration
- H4, 1st support at 0.63509,
- H4, 2nd support at 0.61072
NZD/USD:
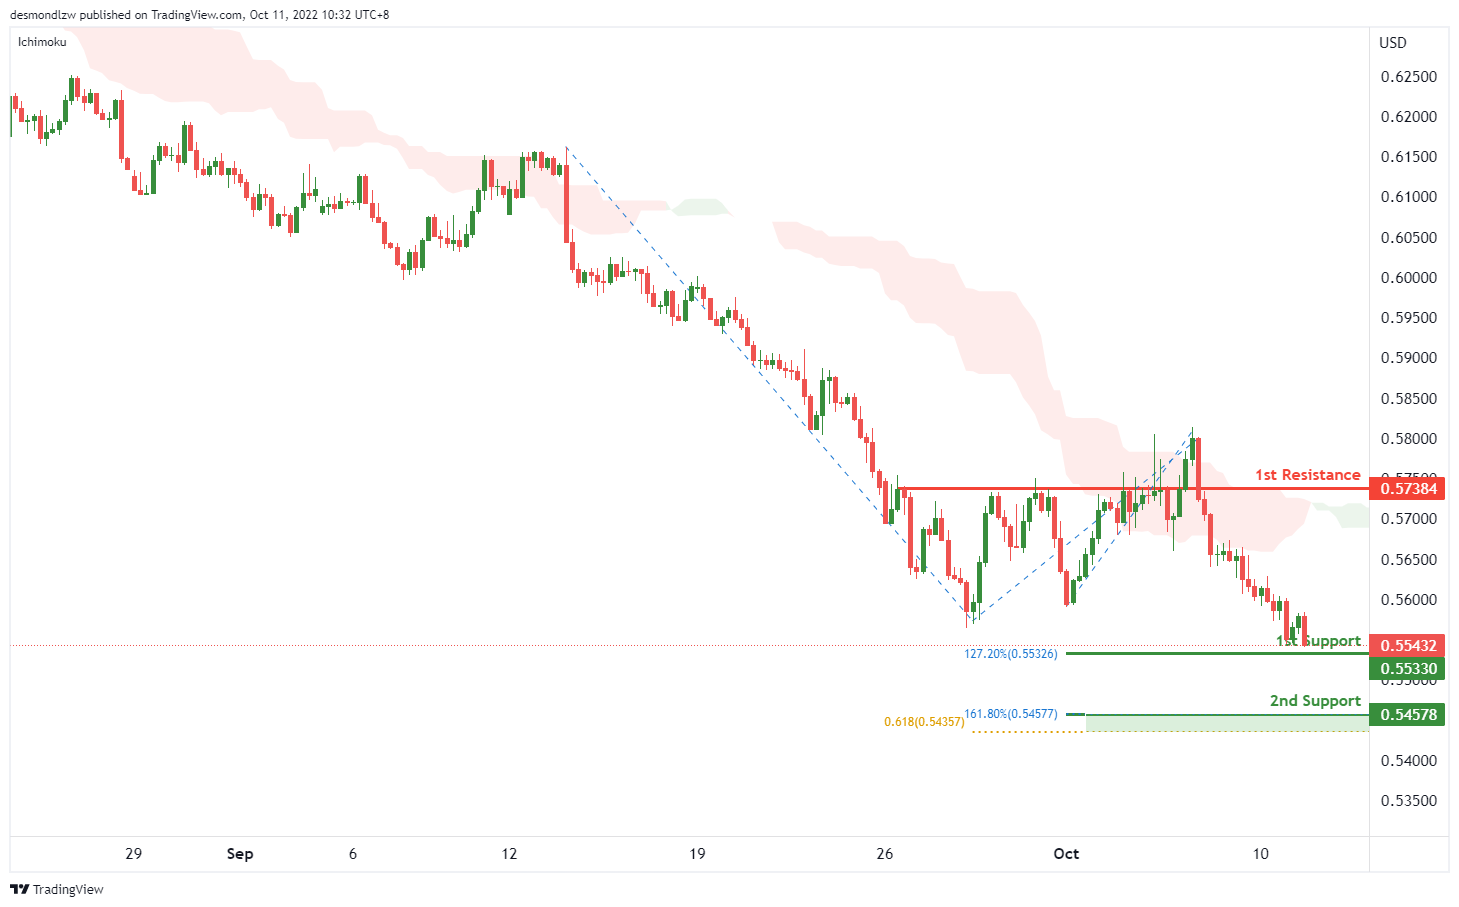
On the H4, the price is below ichimoku cloud and testing the 1st support at 0.55330, which is in line with the 127.2% fibonacci extension, if the price can break this level, we can expect the price drop to the 2nd support at 0.54578, which is in line with the 161.8% fibonacci extension and 61.8% fibonacci projection. ALternatively, the price may bounce off from the 1st support and rise to the 1st resistance at 0.57384, where the previous swing highs are.
Areas of consideration:
- H4 time frame, 1st support at 0.55330
- H4 time frame, 2nd support at 0.54578
USD/CAD:
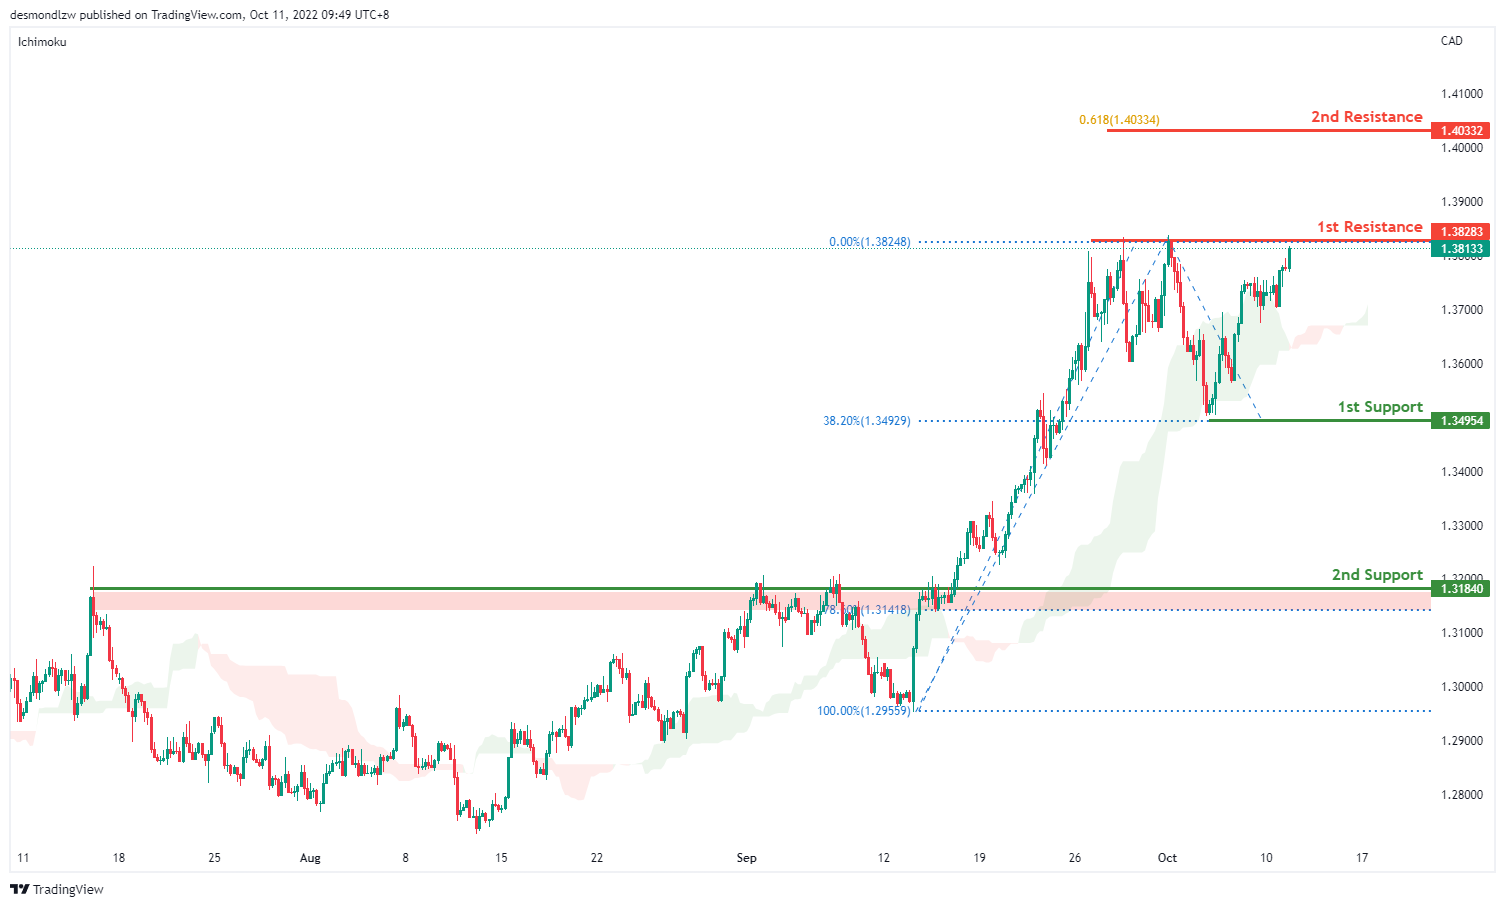
On the H4, the price trades higher near the 1st resistance of 1.3832 which is the previous swing high level. With the price trading above the ichimoku cloud, we have a short term bullish bias. The price could break the first resistance to test the second resistance at 1.4033 where the 61.8% projection sits. Alternatively it could fall to the 1st support at 1.3495 which is in line with the 38.2% retracement level and the previous swing low subsequently the second support at 1.3184 where the overlap support sits
Areas of consideration:
- H4 time frame, 1st resistance at 1.3828
- H4 time frame, 1st support at 1.3495
OIL:
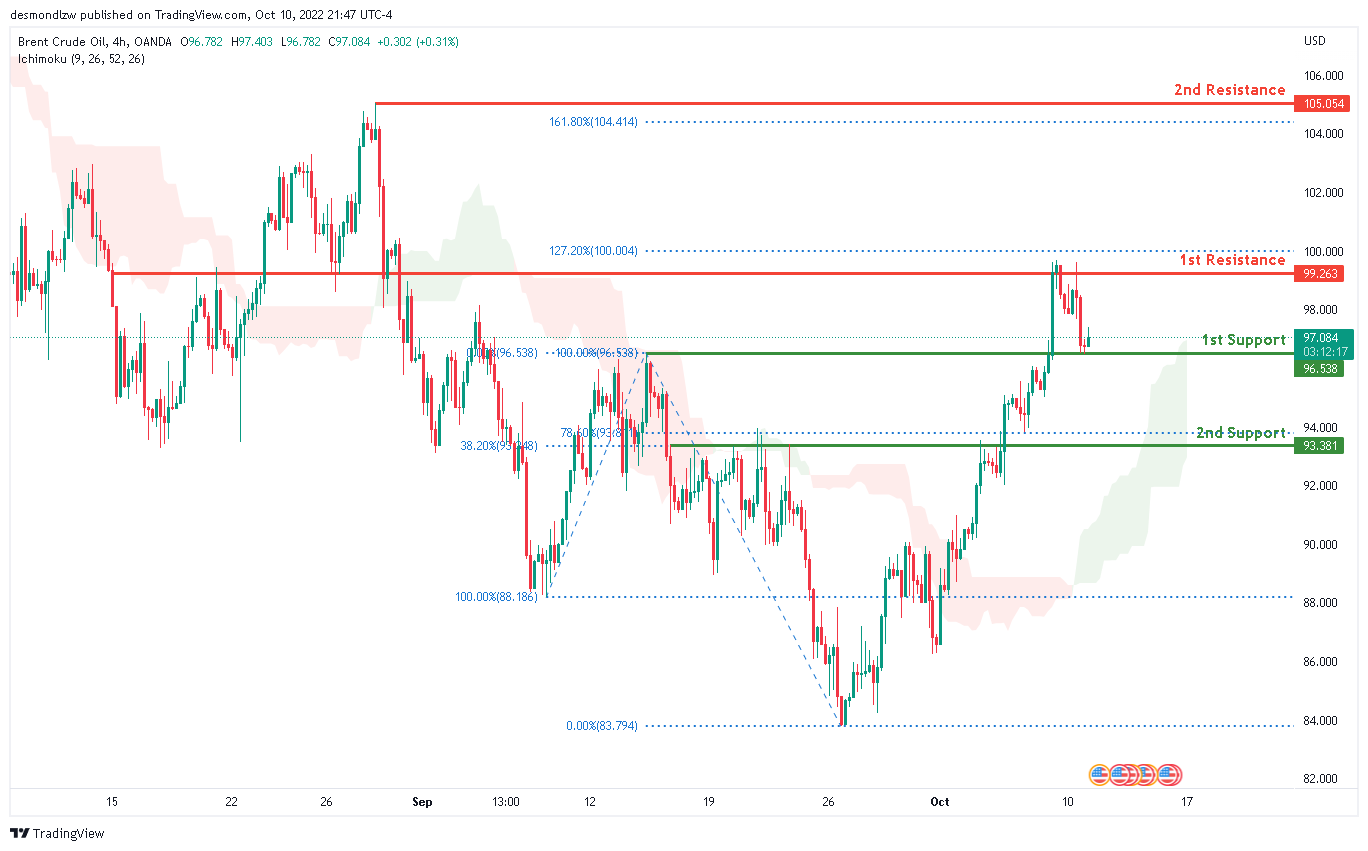
Looking at the H4 chart, the current overall bias for Oil is bullish . To add confluence to this bias, the price is currently above the Ichimoku cloud which indicates a bullish market. Overnight, price has retraced backdownards.. If the bullish momentum continues, expect price to possibly head towards the 1st resistance line at 99.263, where the 127.2% Fibonaaci extension line is located.
Areas of consideration:
- H4 time frame, 1st resistance at 99.263
- H4 time frame, 1st support at 96.538
Dow Jones Industrial Average:
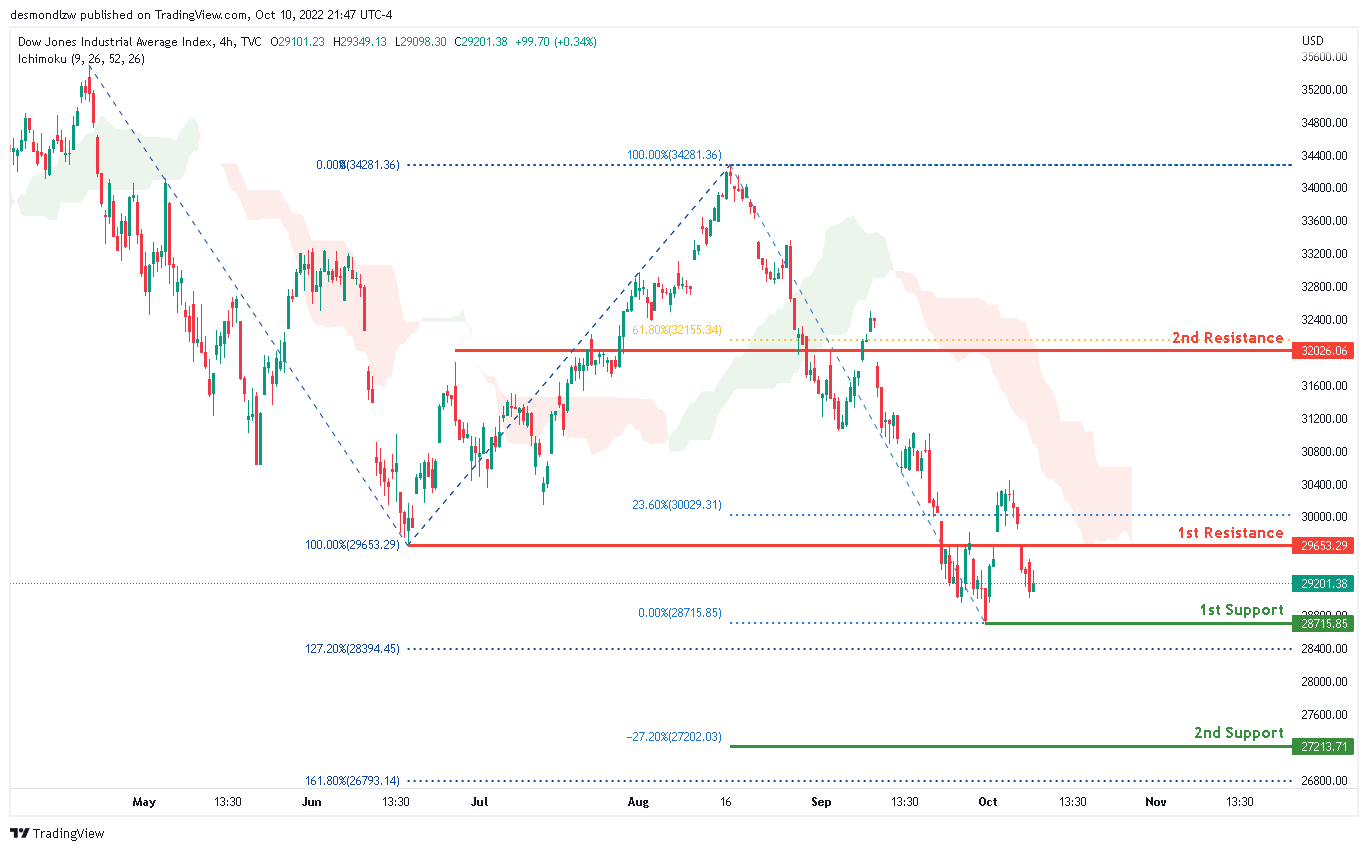
Looking at the H4 chart, the current overall bias for Oil is bearish. To add confluence to this bias, the price is currently below the Ichimoku cloud which indicates a bearish market. Overnight, price has continued it’s bearish momentum downwards… If the bearish momentum continues, expect price to possibly head towards the 1st support line at 29653.29, where the 0% Fibonacci line and 127.2% Fibonacci extension line is located.
Areas of consideration:
- H4 time frame, 1st support at 28715.85
- H4 time frame, 1st resistance at 29653.29
DAX:
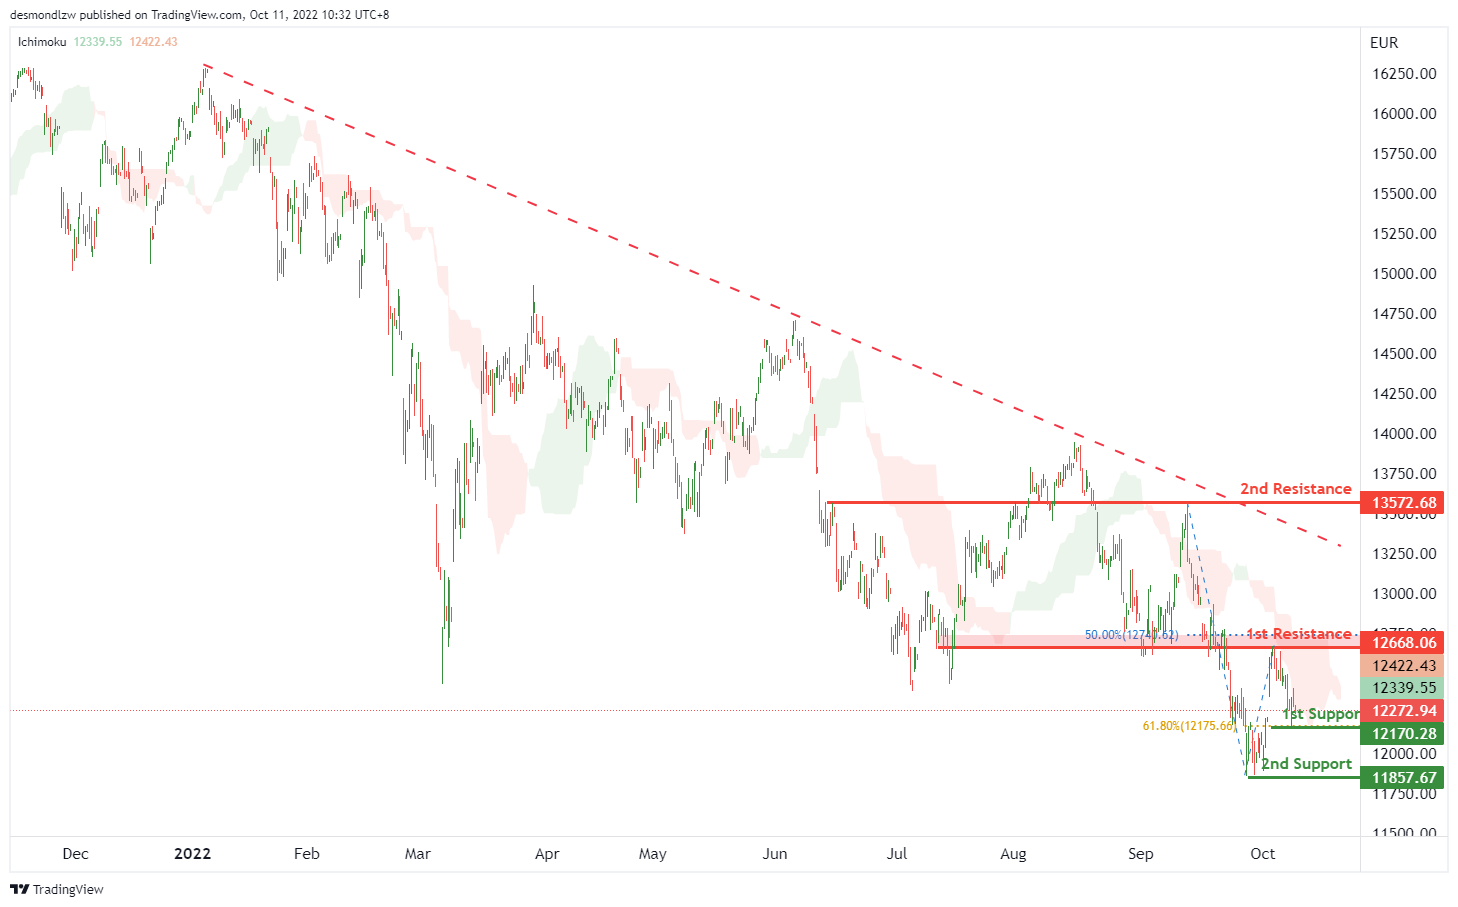
On the H4, with the price moving below ichimoku cloud and long term descending trendline, we have a bearish bias that the price may break the 1st support at 12170.28, which is in line with the 61.8% fibonacci retracement. If the 1st support is broken, the 2nd support could be at 11857.67, which is in line with the swing low. Alternatively, the price may rise to the 1st resistance at 12668.06, which is in line with the 50% fibonacci retracement and overlap resistance, if the 1st resistance is broken, the 2nd resistance could be at 13572.68, where the previous swing high is.
Areas of consideration:
- H4 time frame, 1st support at 12170.28
- H4 time frame, 2nd support at 11857.67
ETHUSD:
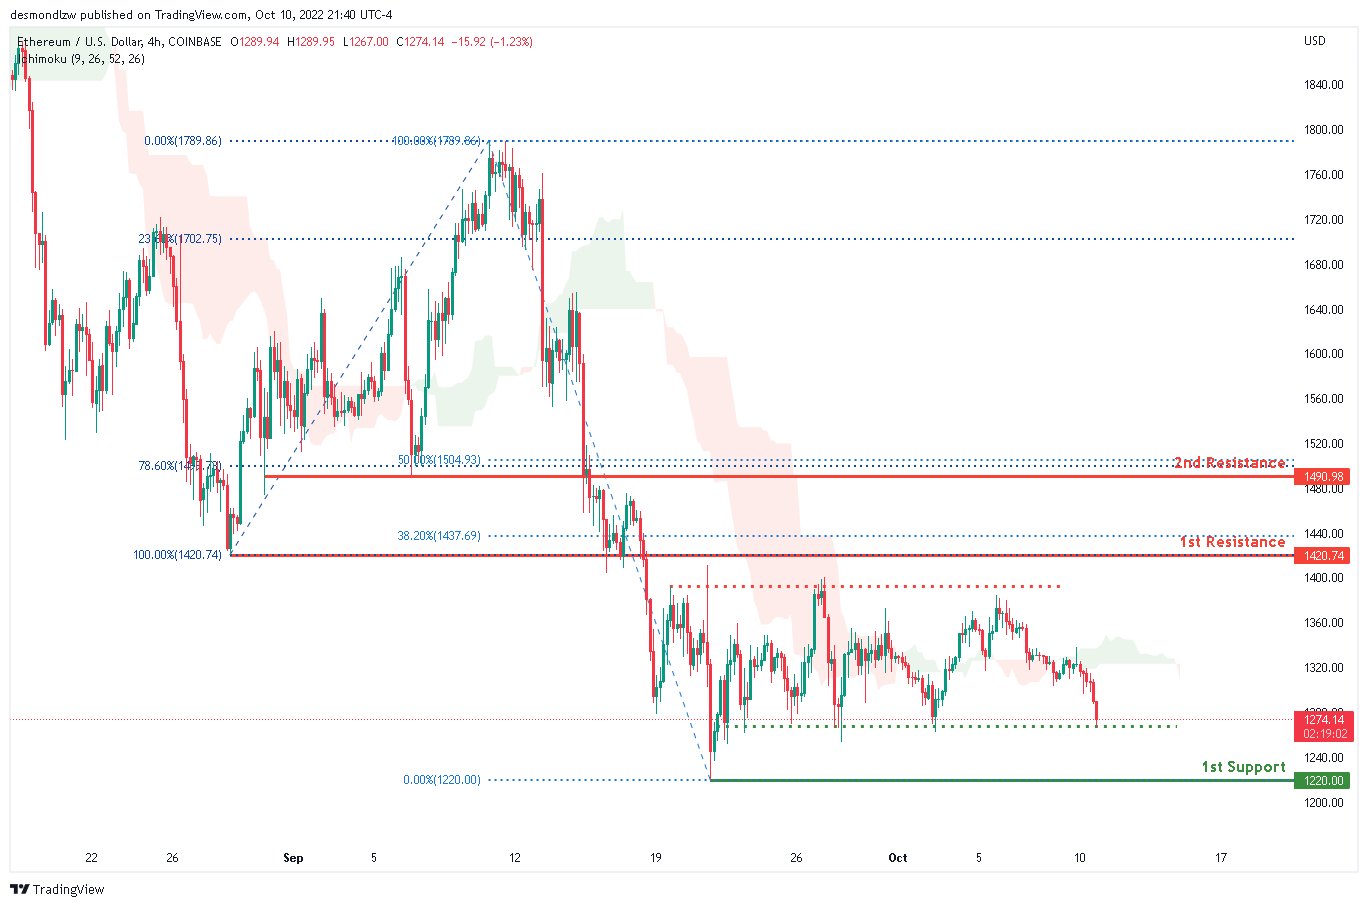
Looking at the H4 chart, the current overall bias for ETHUSD is bearish. To add confluence to this bias, the price is currently under the Ichimoku cloud which indicates a bearish market. Overnight, the price has continued it’s bearish momentum downwards.. If the bearish momentum continues, expect price to possibly head towards the 1st support line at 1220.00, where the 0% Fibonaaci line is located.
Areas of consideration:
- H4 time frame, 1st resistance of 1420.74
- H4 time frame, 1st support at 1220.00
BTCUSD:
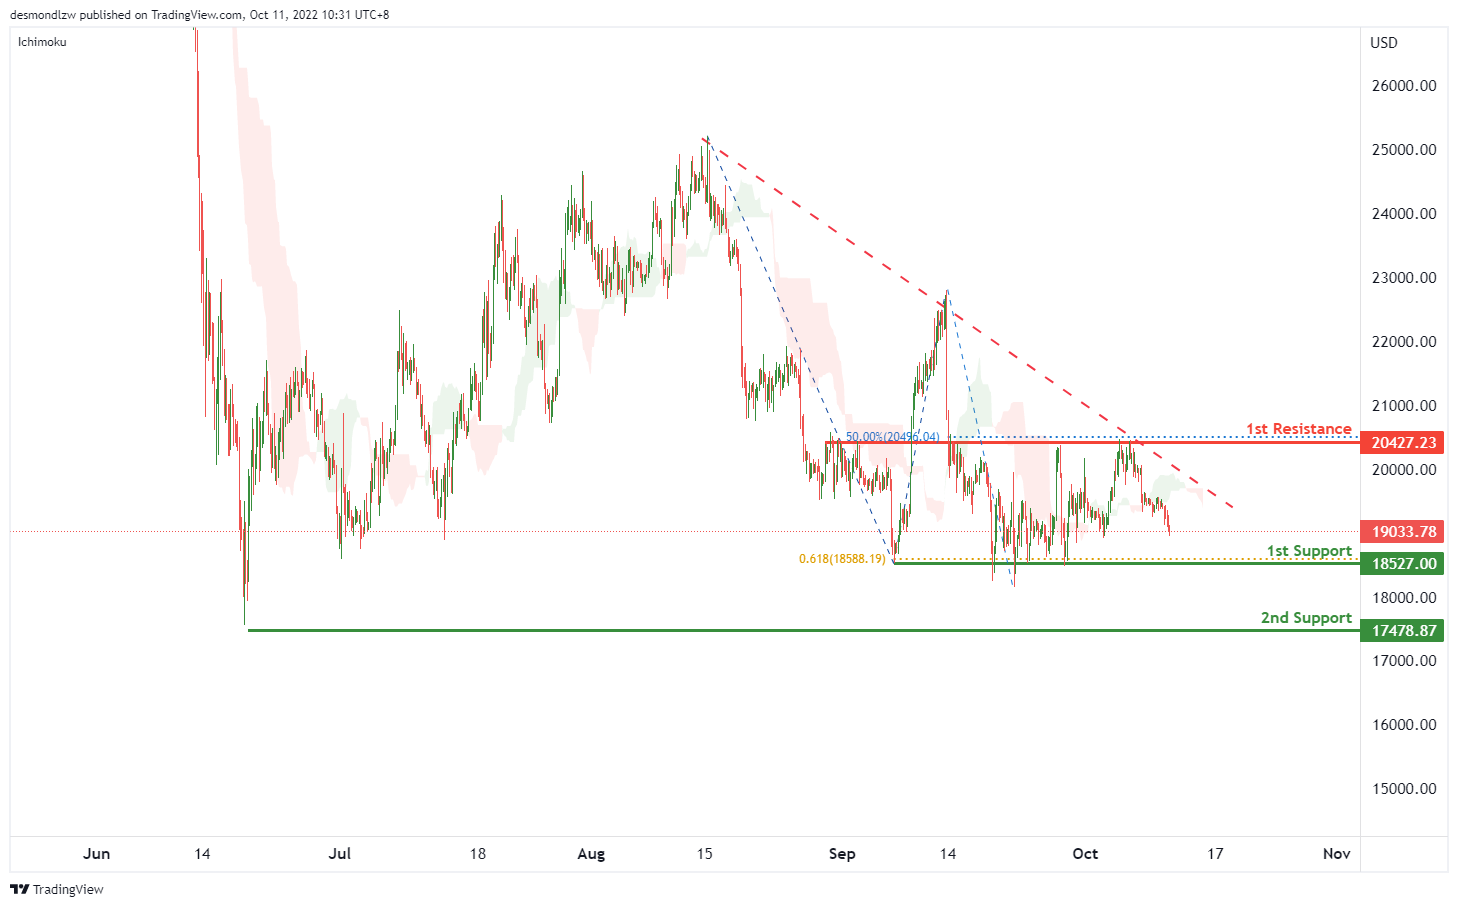
On the H4, price is showing a descending trendline and below the ichimoku cloud, we can expect the price drop to test the 1st support at 18527.00, which is in line with the swing lows and 61.8% fibonacci projection. If the 1st support is broken, we can expect the price drop to the 2nd support at 17475.87, where the previous swing low is. Alternatively, the price may rise to the 1st resistance at 20427.23, where the overlap resistance and 50% fibonacci retracement are.
Areas of consideration:
- H4 time frame, 1st support at 18527.00
- H4 time frame, 2nd support at 17475.87
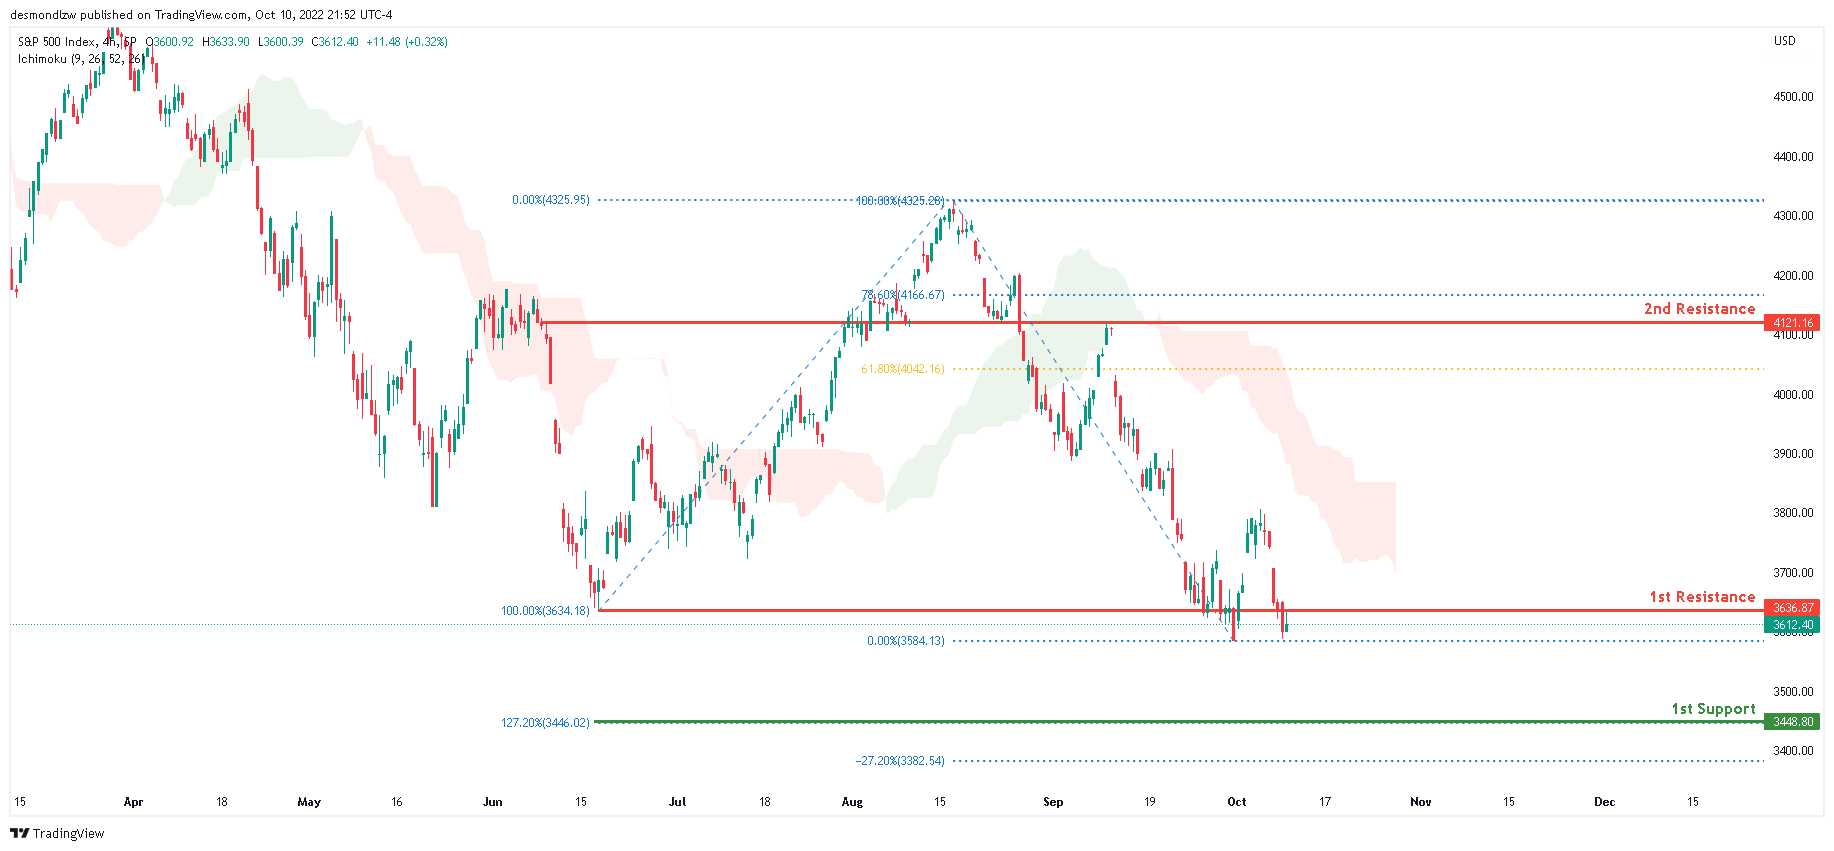
S&P 500:
Looking at the H4 chart, the current overall bias for S&P500 is bearish. To add confluence to this bias, the price is currently under the Ichimoku cloud which indicates a bearish market. Overnight, the price has closed under the 1st resistance line at 3636.87, where the 100% Fibonacci line and previous swing low is located. If the bearish momentum continues, expect price to possibly head towards the 1st support line at 3448.80, where the 127.2% Fibonaaci line is located.
Areas of consideration:
- H4 time frame, 1st support at 3448.80
- H4 time frame, 1st resistance at 3636.87