Sample Category Title
Technical Outlook and Review
DXY:
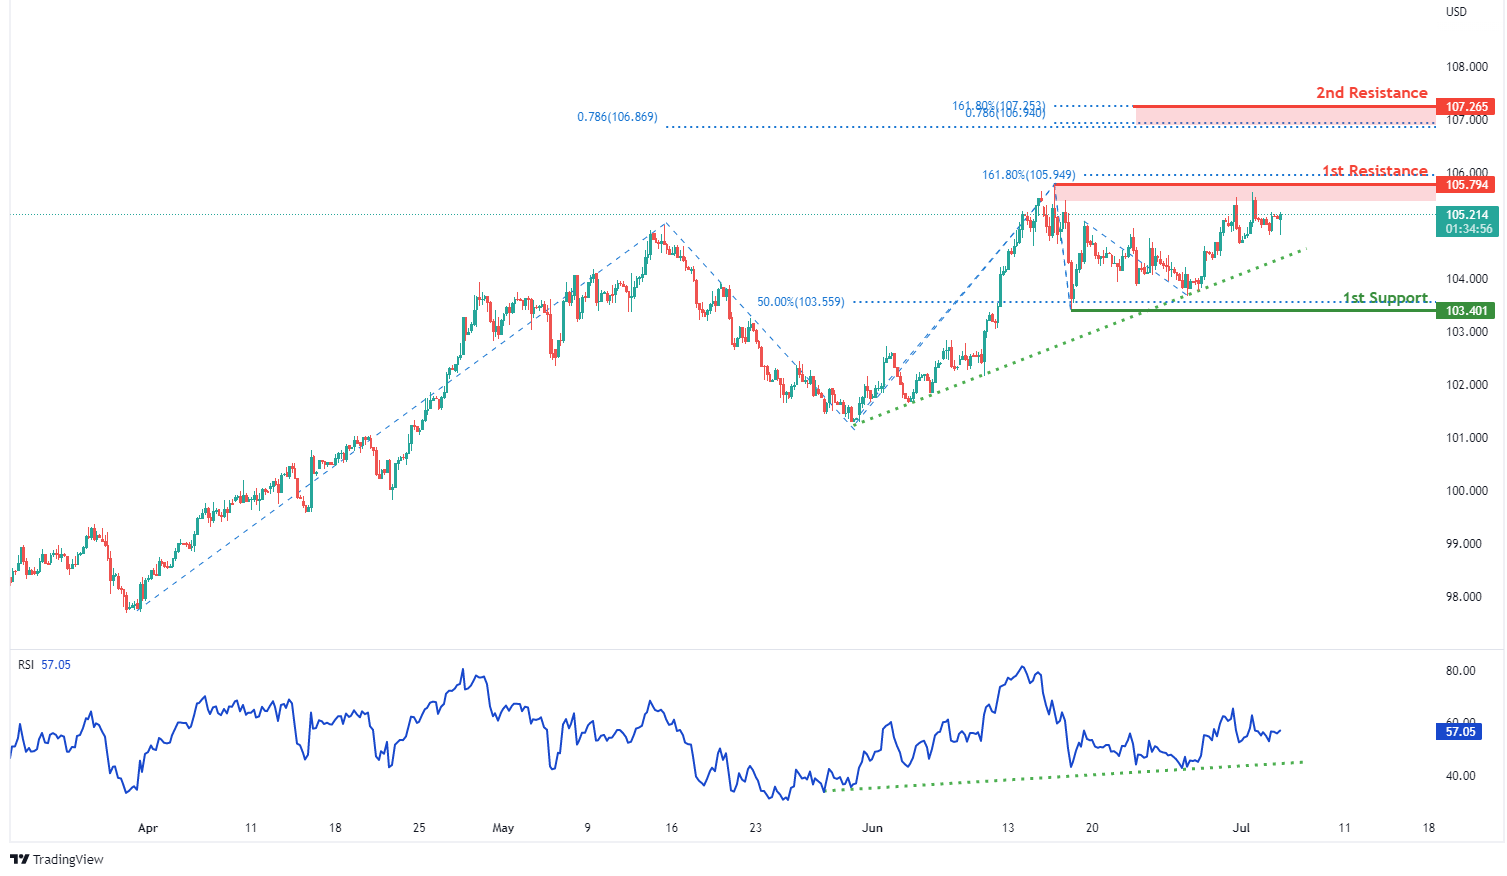
On the H4, with RSI moving along an ascending trendline and prices moving along the ascending trendline, we have a bullish bias that bullish momentum will carry prices to 1st resistance at 105.794 where the swing high resistance and 161.8% fibonacci extension are. Once we have upside confirmation, we would expect bullish momentum to carry prices to 2nd resistance at 107.265 in line with 161.8% fibonacci extension, 78.6% fibonacci projection and 78.6% fibonacci projection. Alternatively, price may drop to 1st support at 103.401 where the horizontal swing low support and 50% fibonacci retracement are.
Areas of consideration:
- H4 time frame, 1st resistance at 105.794
- H4 time frame, 1st support at 103.401
XAU/USD (GOLD):
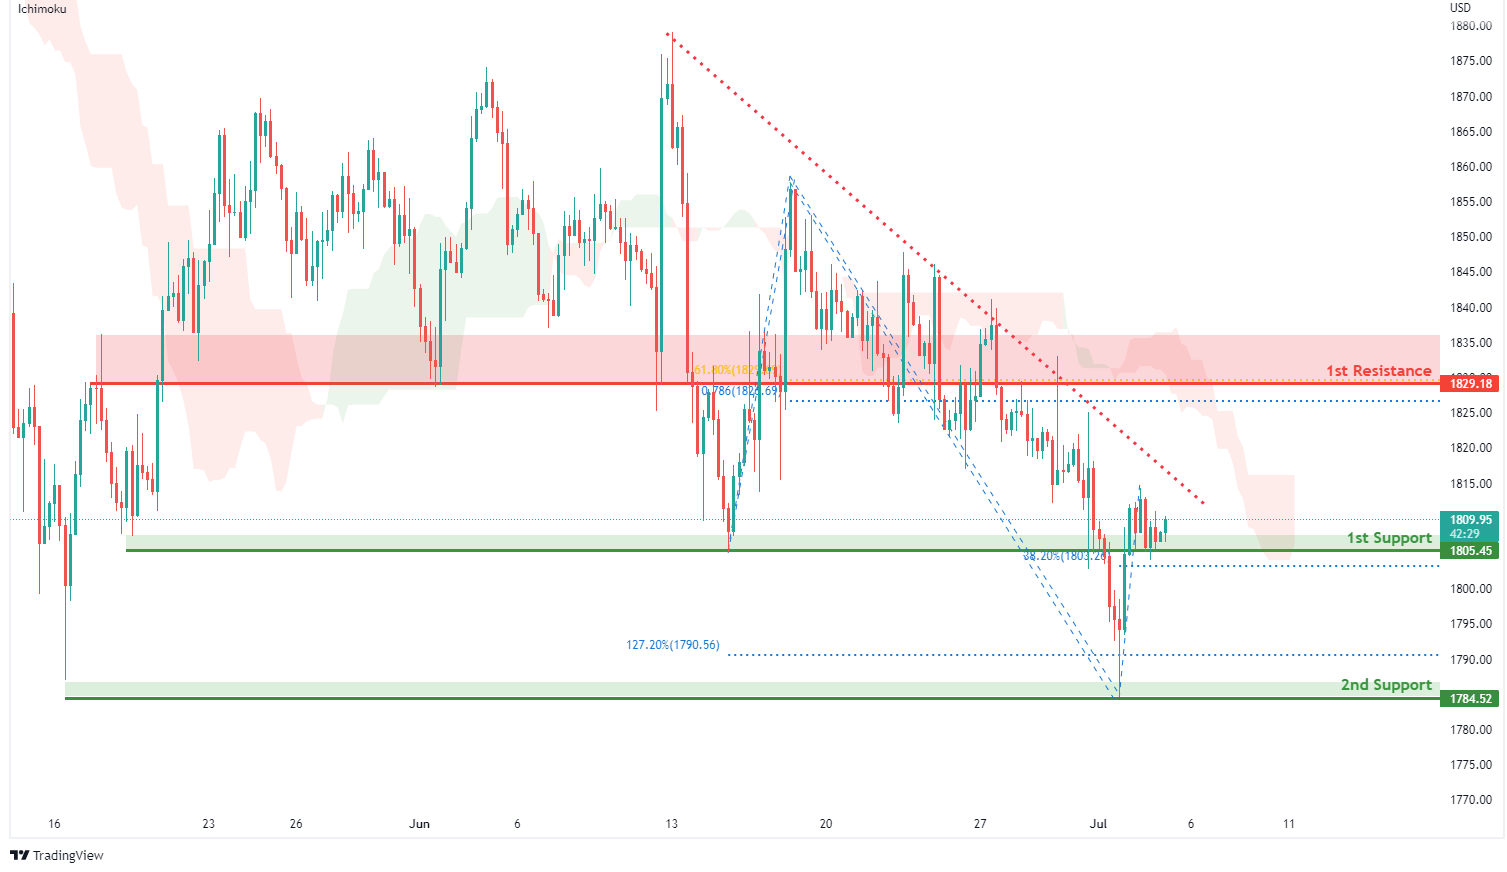
On the H4, with prices moving below the ichimoku indicator and along a descending trendline, we have a bearish bias that prices will drop to our 1st support at 1805.45 where the horizontal overlap support and 38.2% fibonacci retracement. Once we have downside confirmation, we would expect bearish momentum to carry price to 2nd support at 1784.52 in line with swing low support and 127.2% fibonacci extension. Alternatively, price could rise to our 1st resistance at 1829.18 in line with overlap resistance, 61.8% fibonacci retracement and 78.6% fibonacci projection.
Areas of consideration:
- H4 time frame, 1st Resistance at 1829.18
- H4 time frame, 1st Support at 1805.45
GBP/USD:
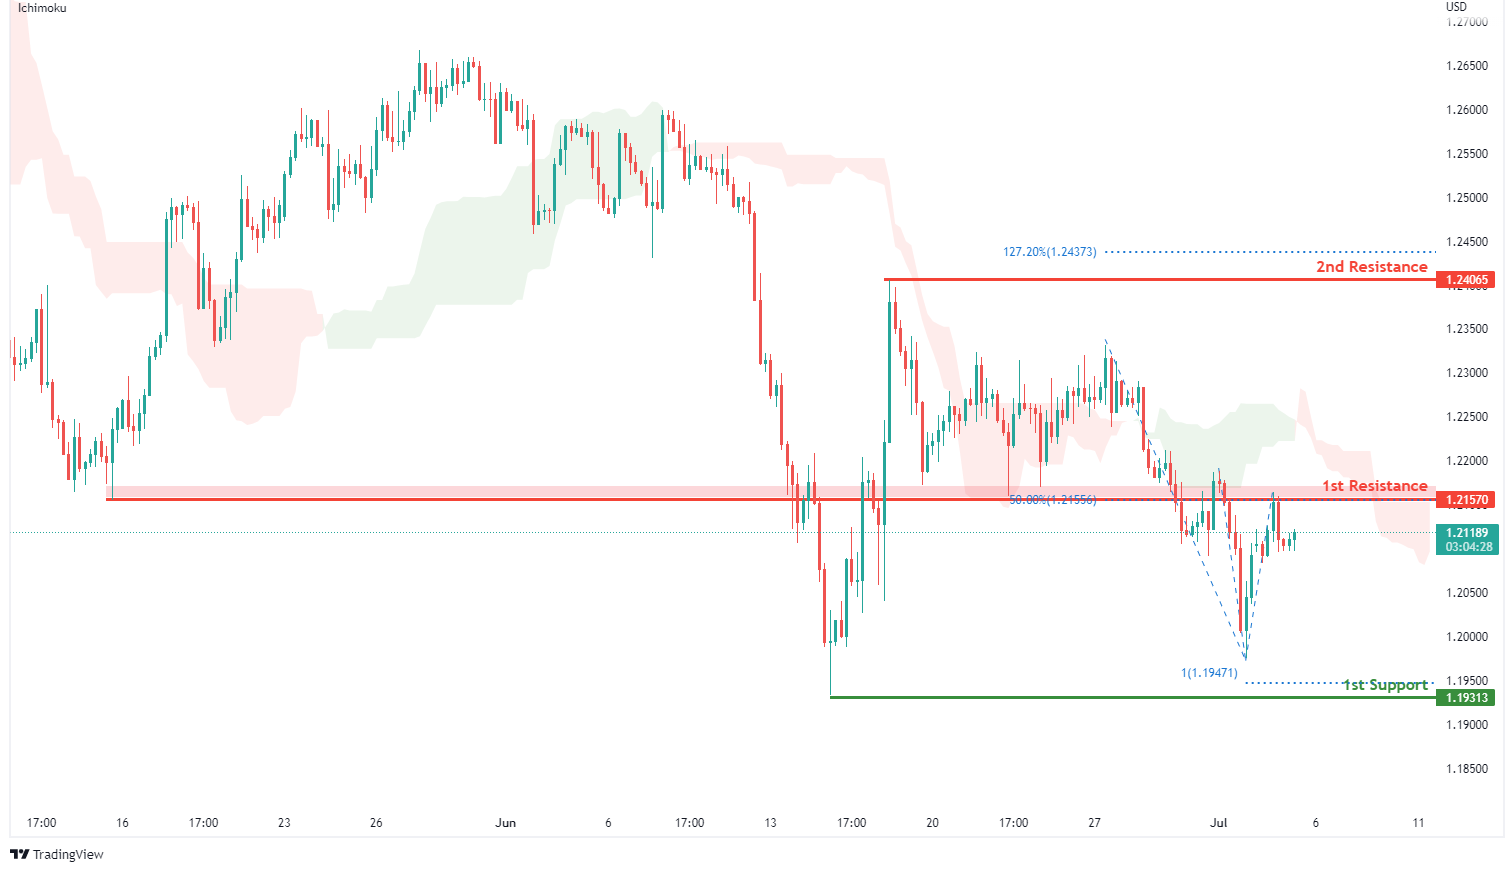
On the H4, with prices moving below the ichimoku indicator, we have a bearish bias that price will rise and drop from our 1st resistance at 1.21570 where the horizontal overlap resistance and 50% fibonacci retracement are to our 1st support at 1.19313 where the horizontal swing low support and 100% fibonacci projection are. Alternatively, price could rise above 1st resistance structure and head to 2nd resistance at 1.24065 in line with the swing high resistance and 127.2% fibonacci extension.
Areas of consideration:
- H4 1st resistance at 1.21570
- H4 1st support at 1.19313
USD/CHF:
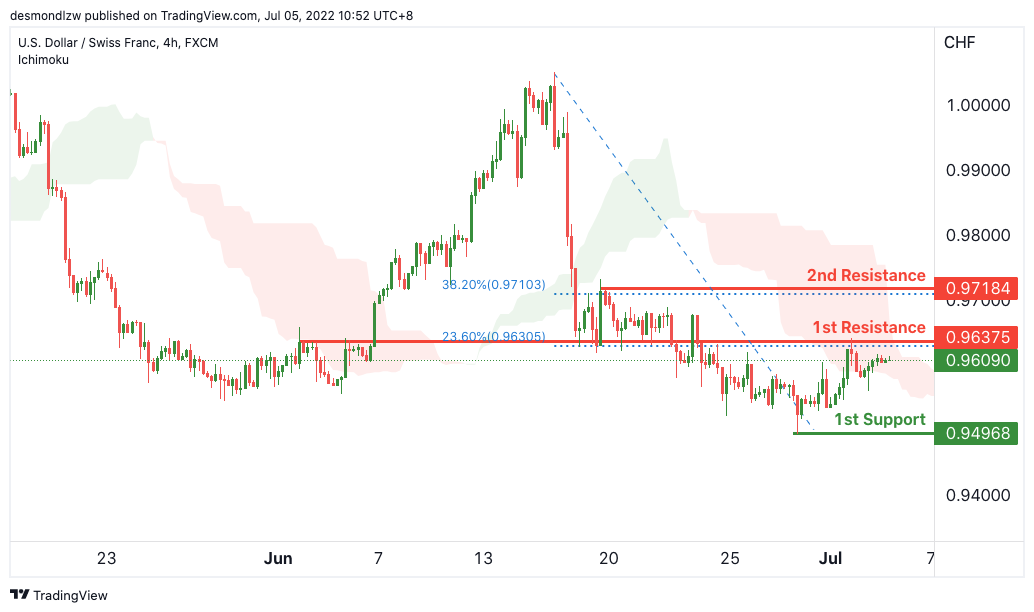
On the H4, with price moving below the ichimoku cloud , we have a bearish bias that price will continue to drop from the 1st resistance at 0.96375 in line with the horizontal pullback resistance and 23.6% Fibonacci retracement to the 1st support at 0.94968 in line with the horizontal swing low support. Alternatively, price may reverse off the 1st resistance and rise to the 2nd resistance where the 38.2% Fibonacci retracement and pullback resistance is.
Areas of consideration
- 1st support level at 0.94968
- 1st resistance level at 0.96375
EUR/USD :
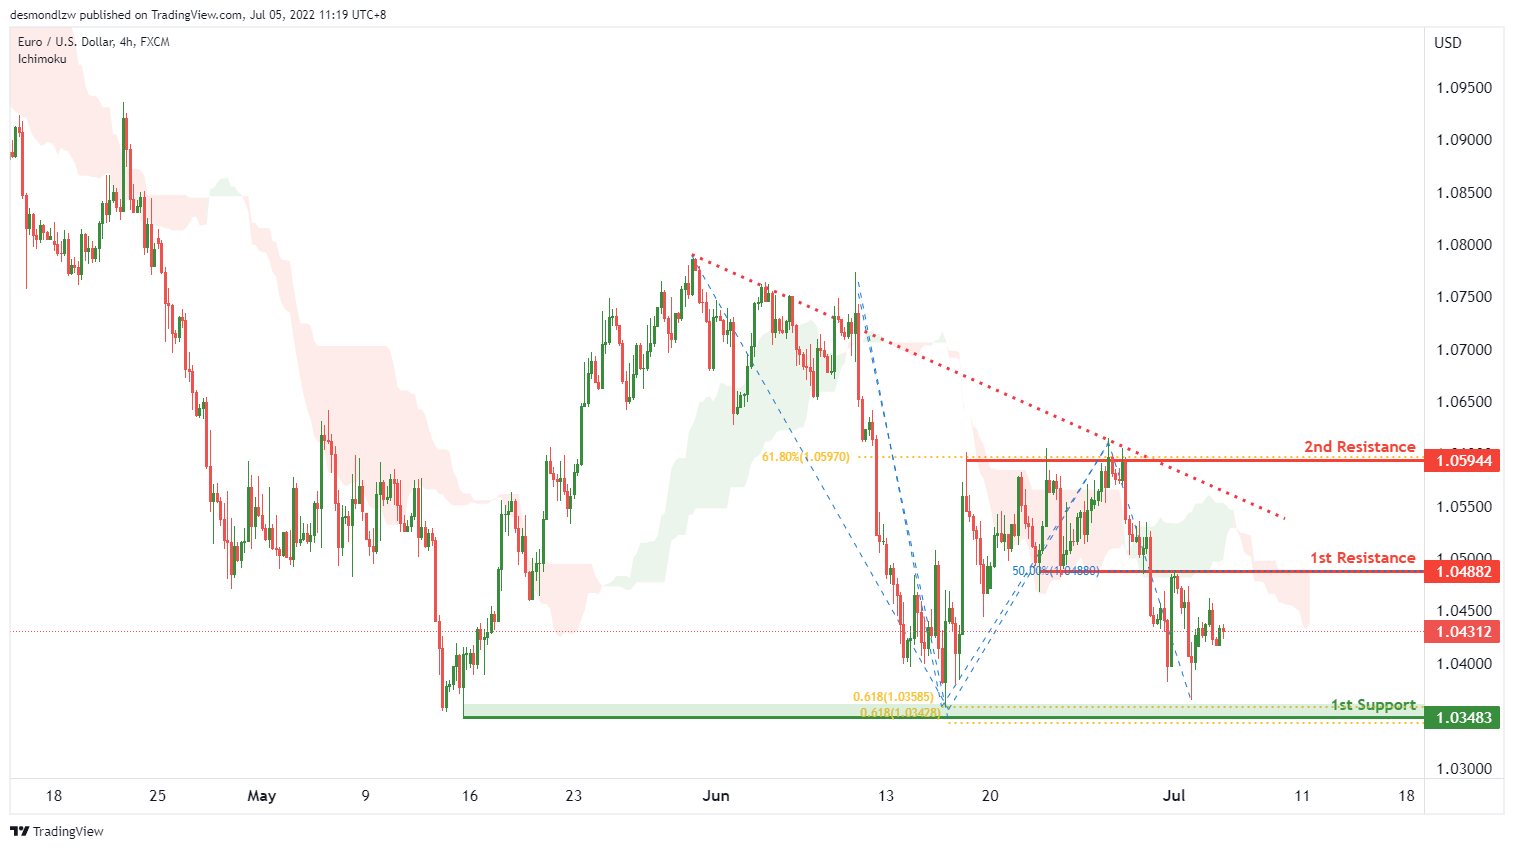
On the H4, with price moving below the ichimoku cloud and in a descending trendline, we have a bearish bias that price will continue to drop from the 1st resistance at 1.04882 at the overlap resistance to the 1st support at 1.03483 at the swing low in line with the two 61.8% fibonacci projections. Alternatively, price may reverse off the 1st resistance and rise to the 2nd resistance at the multiple swing high in line with the 61.8% fibonacci retracement.
Areas of consideration :
- H4 1st resistance at 1.04882
- H4 1st support at 1.03483
USD/JPY:
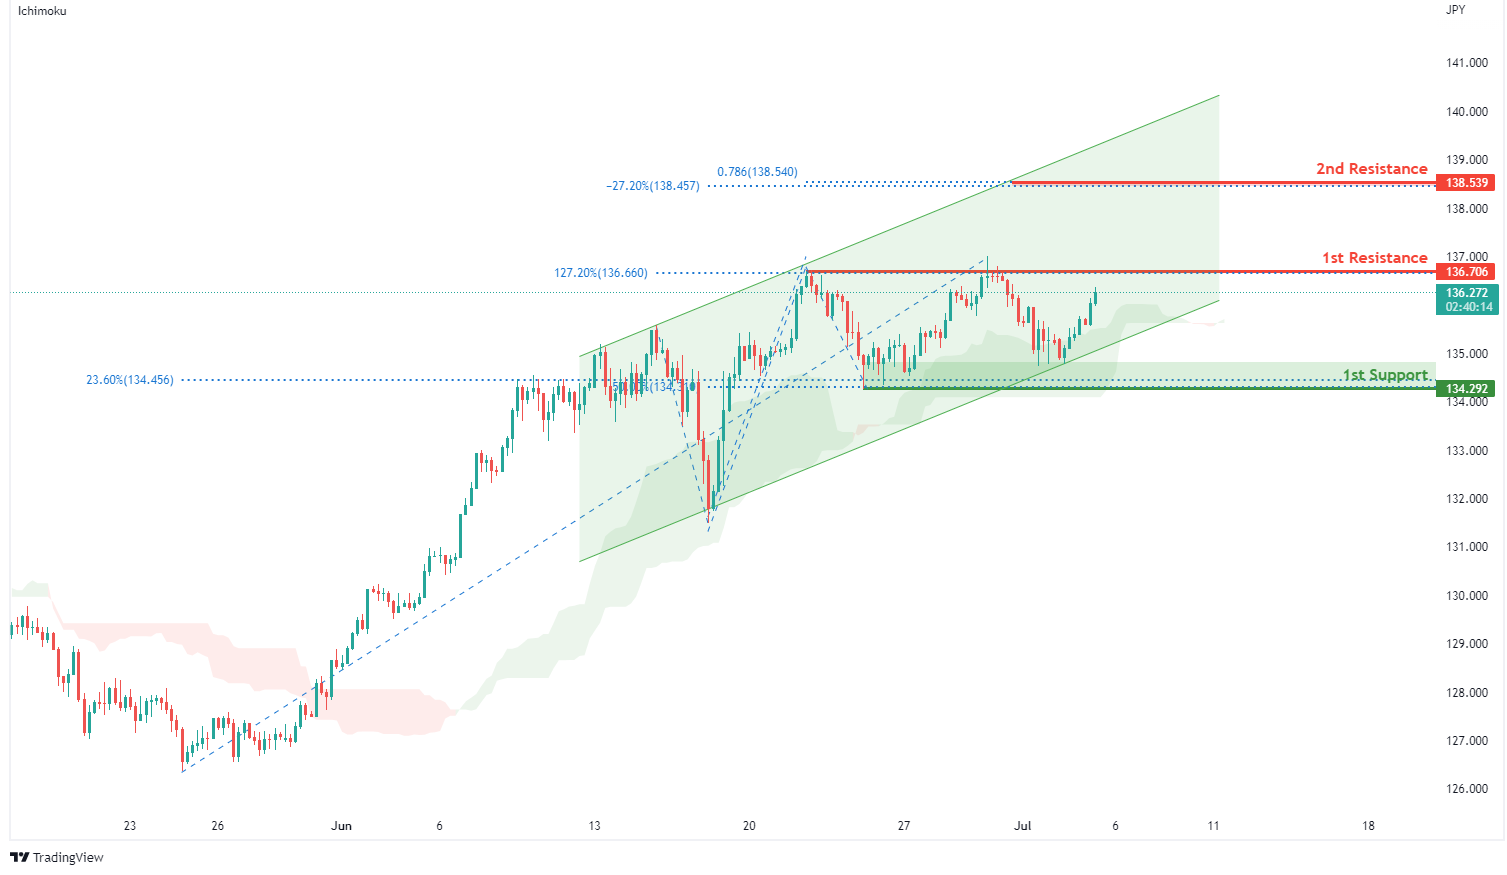
On the H4, with price moving within an ascending channel and above the ichimoku indicator, we have a bullish bias that price will rise to our 1st resistance at 136.706 where the swing high resistance and 127.2% fibonacci extension are. Once there is upside confirmation that price has broken past the 1st resistance, we would expect bullish momentum to carry price to our 2nd resistance at 138.539 where the -27.2% fibonacci expansion and 78.6% fibonacci projection are. Alternatively, price may drop to 1st support at 134.292 in line with the swing low support, 23.6% fibonacci retracement and 50% fibonacci retracement.
Areas of consideration:
- H4 time frame, 1st resistance at 136.706
- H4 time frame, 1st support at 134.292
AUD/USD:
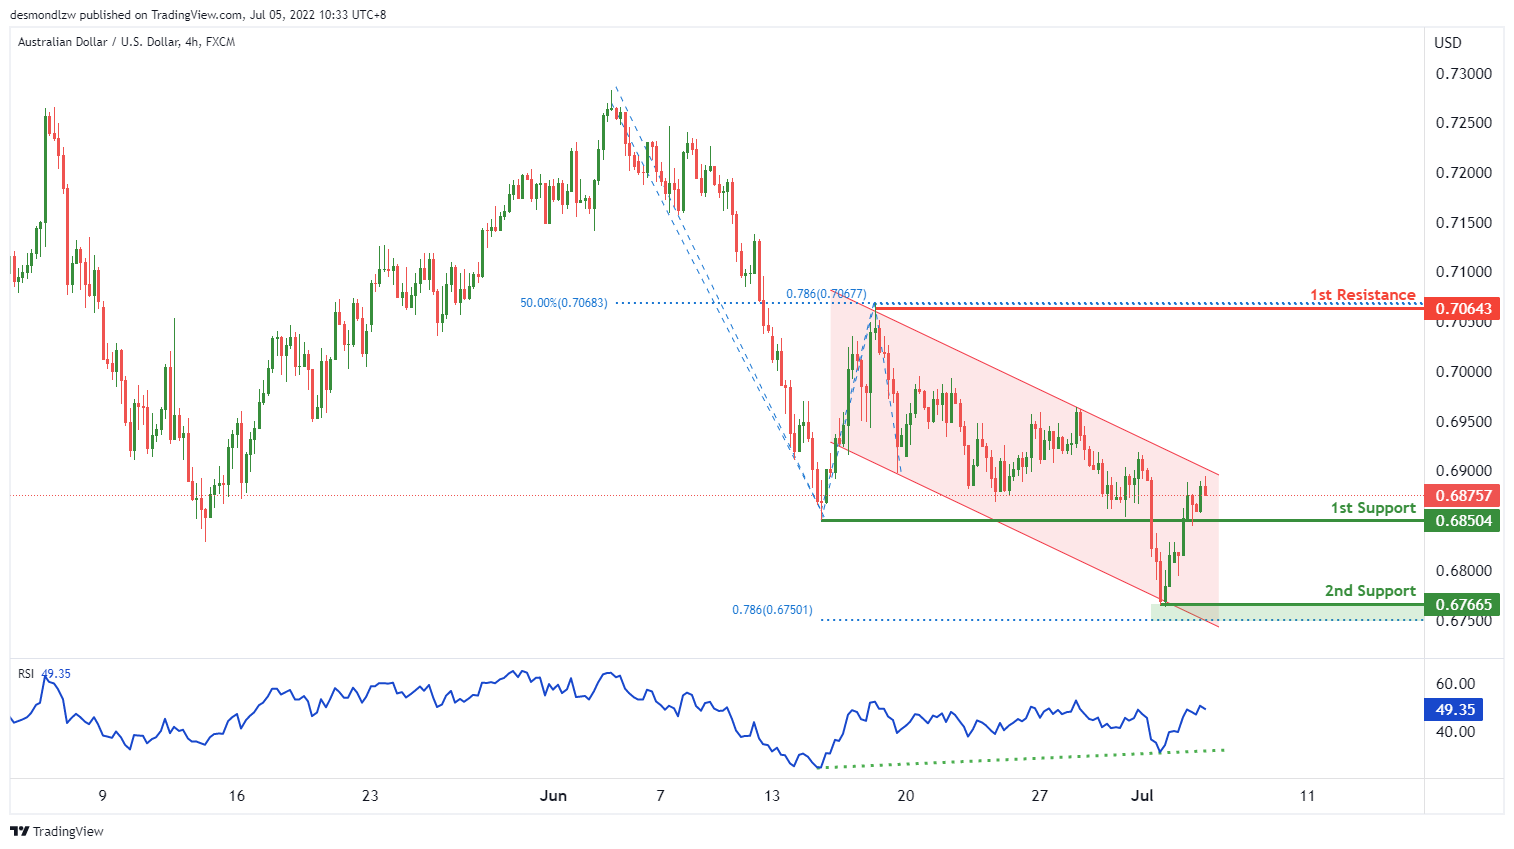
On the H4, with price moving in a descending trend channel but in an ascending trendline on the RSI, there is a bullish divergence, and we have a bullish bias that price will rise from the 1st support at 0.68504 at the pullback support to the 1st resistance at 0.70643 at the swing high in line with the 50% fibonacci retracement and 78.6% fibonacci projection. Alternatively, price may reverse off the 1st support and drop to the 2nd support at 0.67665 at the swing low in line with the 78.6% fibonacci projection.
Areas of consideration
- H4 1st resistance at 0.70643
- H4 1st support at 0.68504
NZD/USD:
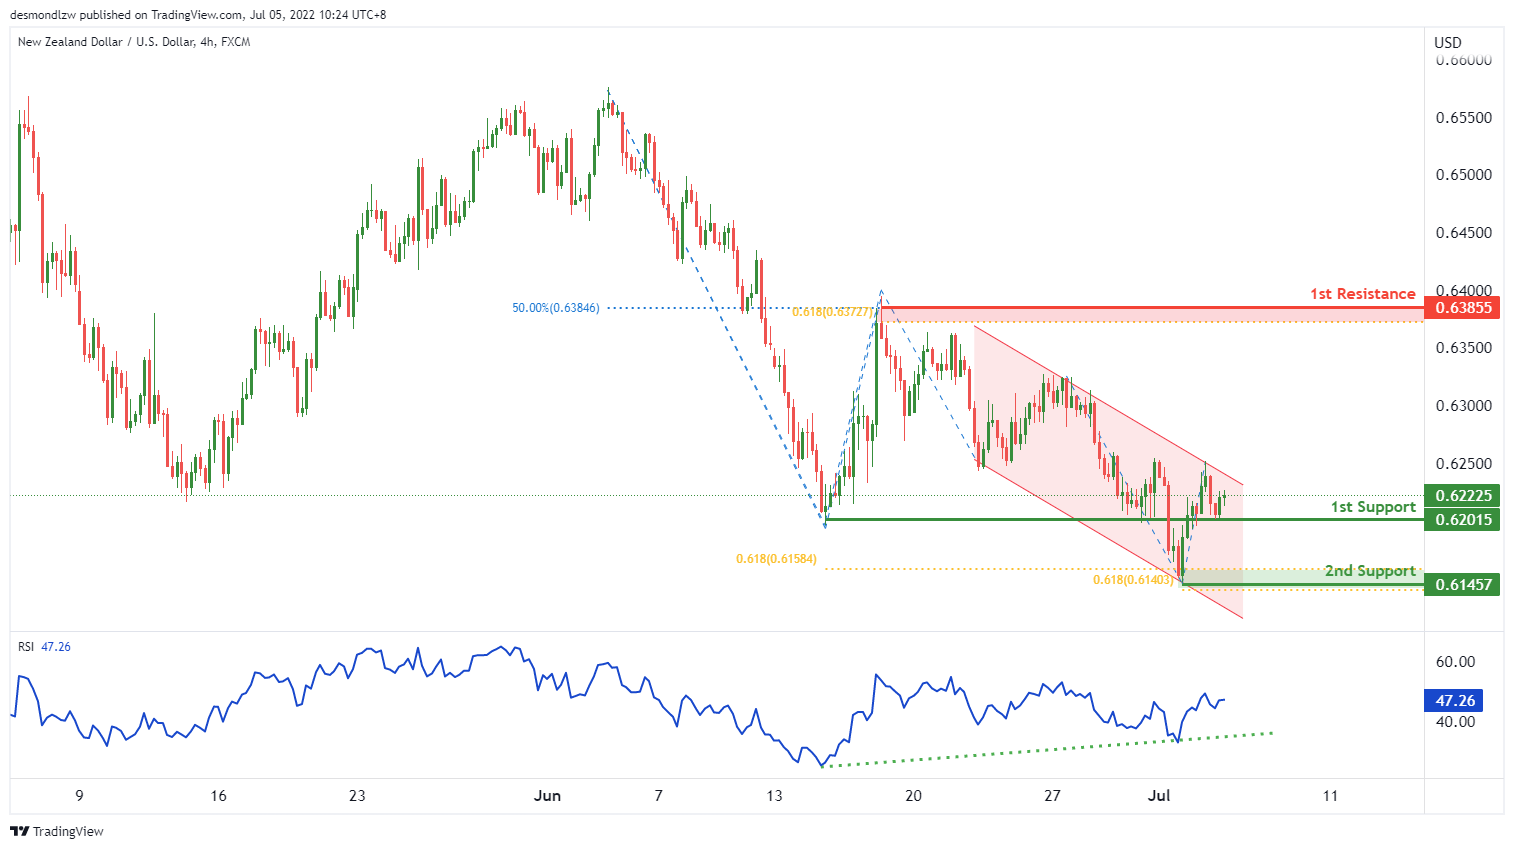
On the H4, with price moving in a descending trend channel but in an ascending trendline on the RSI, there is a bullish divergence, and we have a bullish bias that price will rise from the 1st support at 0.62015 at the pullback support to the 1st resistance at 0.63855 at the swing high in line with the 50% fibonacci retracement and 61.8% fibonacci projection. Alternatively, price may reverse off the 1st support and drop to the 2nd support at 0.61457 at the swing low in line with the two 61.8% fibonacci projections.
Areas of consideration:
- H4 time frame, 1st support at 0.62015
- H4 time frame, 1st resistance at 0.63855
USD/CAD:
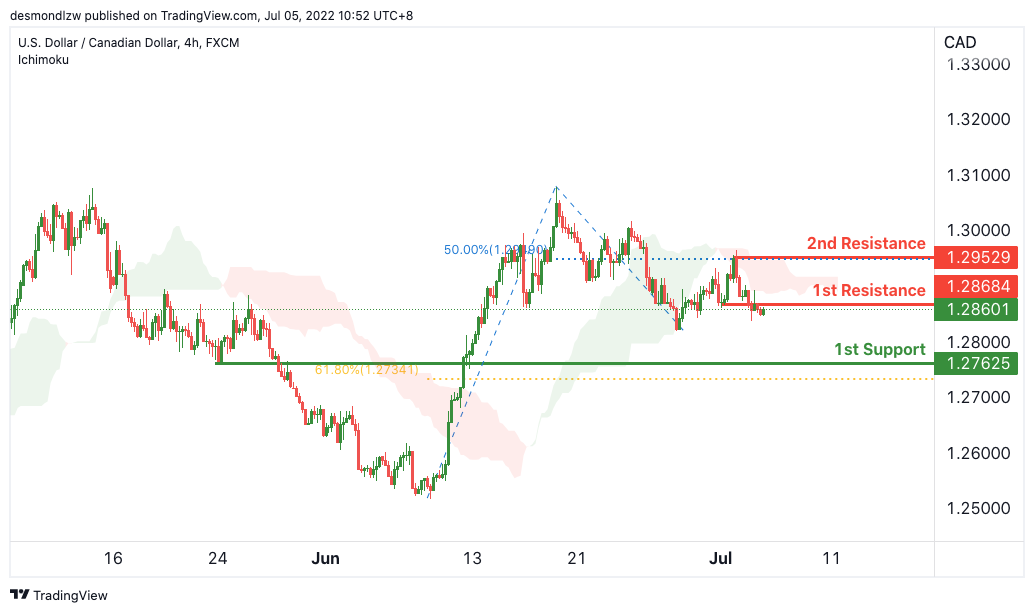
On the H4, with price moving below the ichimoku cloud , we have a bearish bias that price will continue to drop from the 1st resistance at 1.28684 in line with the horizontal pullback resistance to the 1st support at 1.27625 in line with the horizontal pullback support and 61.8% Fibonacci retracement. Alternatively, price may reverse off the 1st resistance and rise to the 2nd resistance where the 50% Fibonacci retracement and swing high resistance is.
Areas of consideration:
- H4 time frame, 1st resistance at 1.28684
- H4 time frame, 1st support at .27625
OIL:
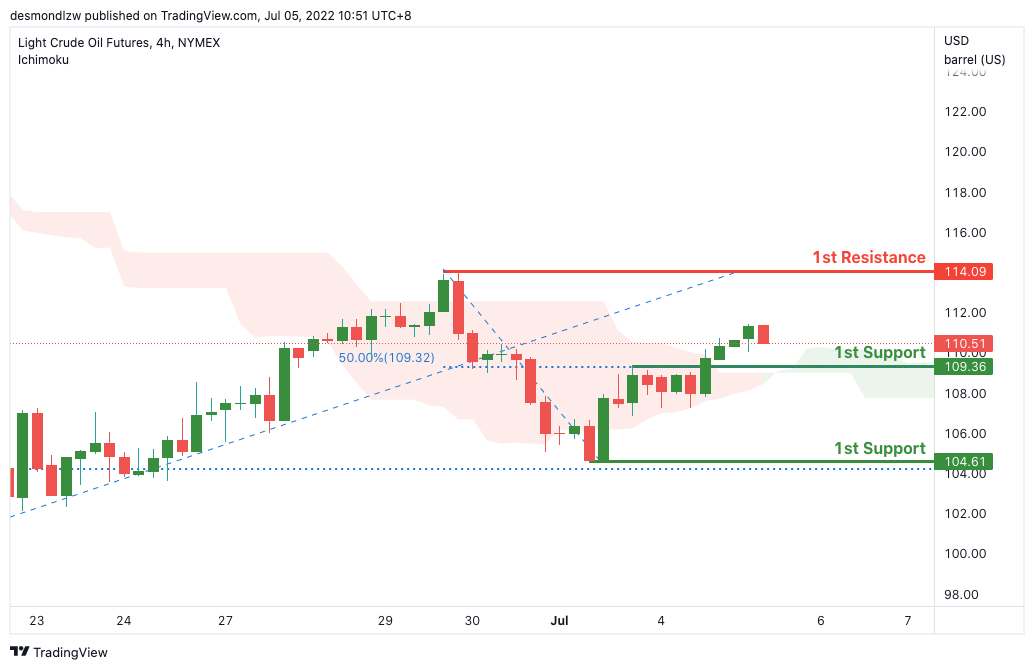
On the H4, with price moving above the ichimoku cloud, we have a bullish bias that price will rise from our 1st support at 109.36 where the horizontal pullback support and 50% Fibonacci retracement are to our 1st resistance at 114.09 in line with the horizontal swing high resistance. Alternatively, price may break 1st support and head for 2nd support at 104.61 where the horizontal swing low support.
Areas of consideration:
- H4 time frame, 1st resistance of 109.36
- H4 time frame, 1st support of 104.41
Dow Jones Industrial Average:
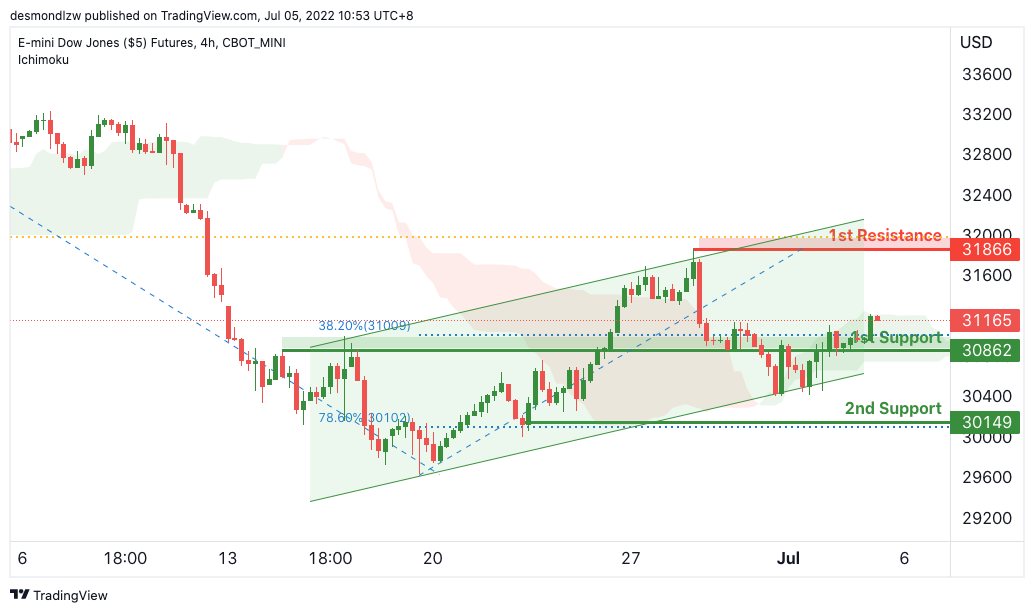
On the H4, with price moving along an ascending channel and expected to break out of the ichimoku cloud, we have a bullish bias that price will rise from our 1st support at 30862 where the horizontal pullback support and 38.2% Fibonacci retracement are to our 1st resistance at 31866 in line with the horizontal swing high resistance and 61.8% fibonacci retracement. Alternatively, price may break 1st support and head for 2nd support at 30149 where the horizontal swing low support and 78.6% fibonacci retracement are. Take note we are waiting for the break of the 1st resistance to confirm the bullish move.
Areas of consideration:
- H4 time frame, 1st resistance of 31866
- H4 time frame, 1st support of 30862
Elliott Wave View: Dollar Index (DXY) Remains Bullish
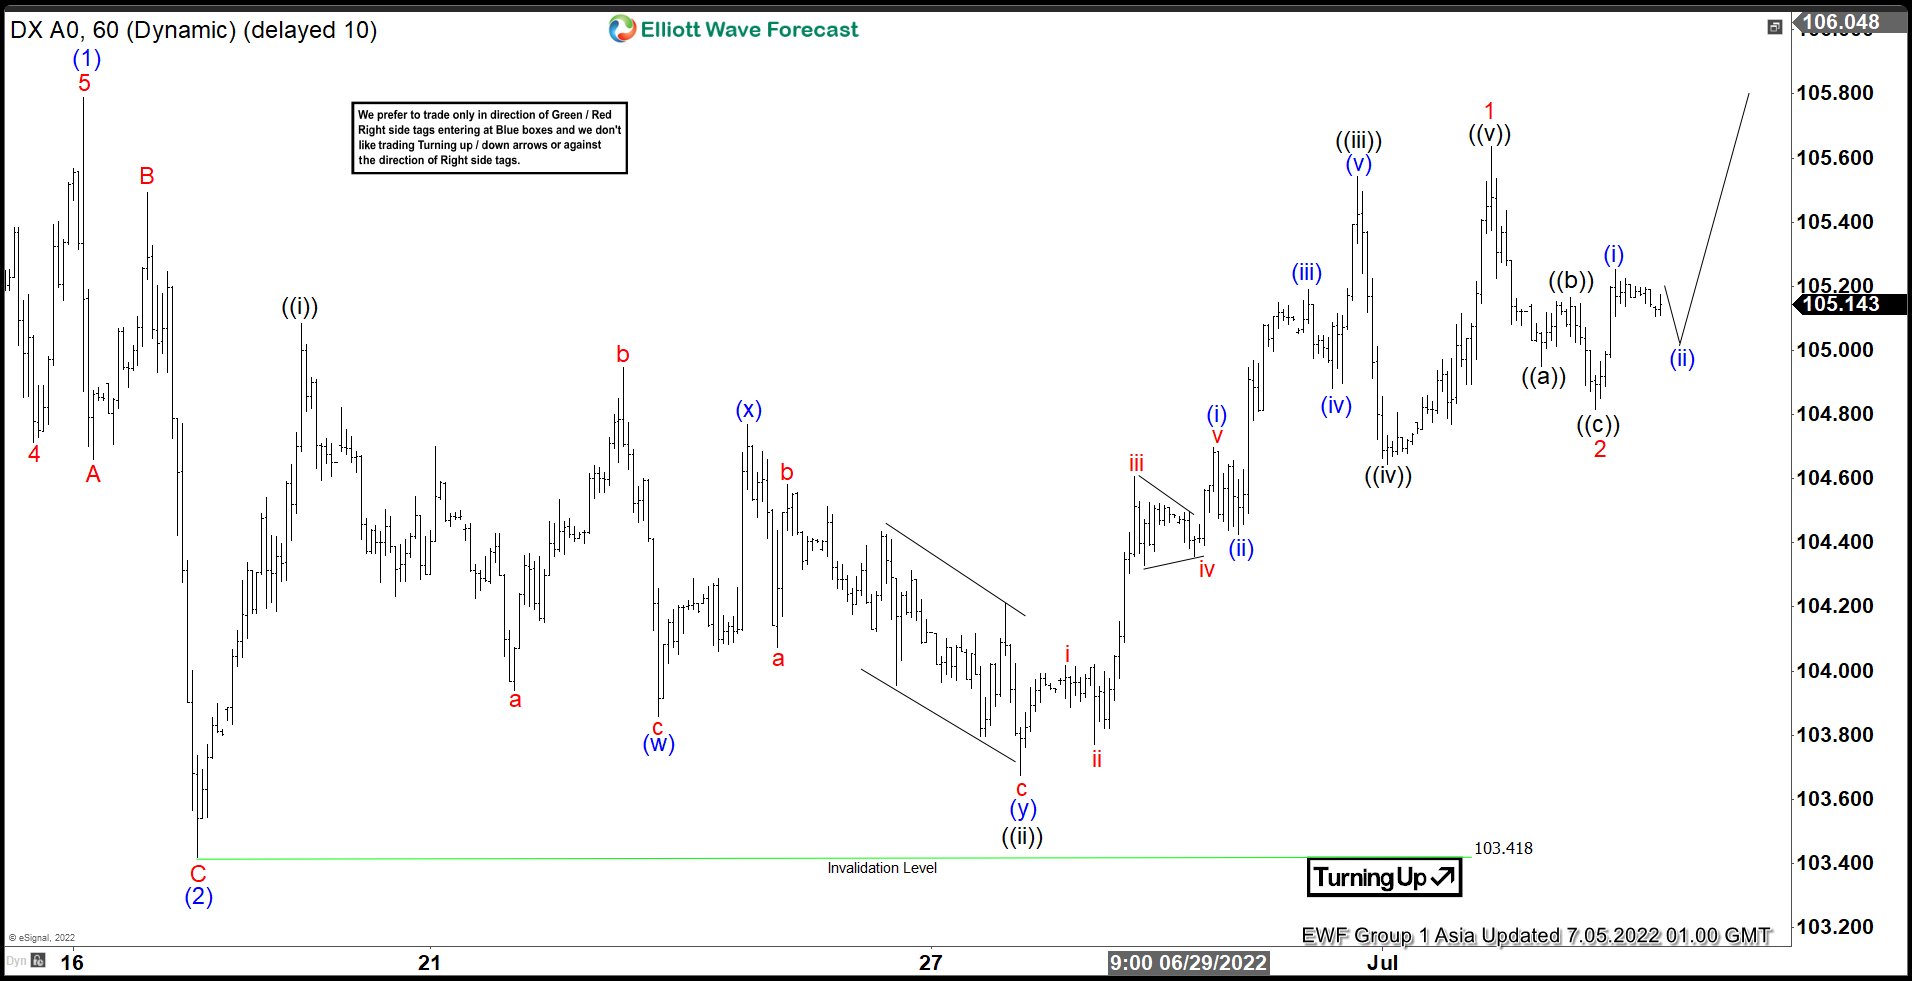
Short term Elliott Wave view in Dollar Index suggests rally to 105.78 ended wave (1). Wave (2) pullback ended at 103.41 with subdivision as a zigzag Elliott Wave structure. Down from wave (1), wave A ended at 104.66 and wave B ended at 105.49. Index extended lower in wave C towards 103.41 to complete wave (2). Index has resumed higher in wave (3), but it still needs to break above wave (1) at 105.78 to validate this view and rule out a double correction in wave (2).
Internal subdivision of wave (3) is unfolding as a 5 waves impulse structure. Up from wave (2), wave ((i)) ended at 105.08, and dips in wave ((ii)) ended at 103.67. Index then resumes higher in wave ((iii)) towards 105.54, and pullback in wave ((iv)) ended at 104.64. Final leg higher wave ((v)) ended at 105.63 which completed wave 1. Pullback in wave 2 ended at 104.81 with internal subdivision as a zigzag in lesser degree. Down from wave 1, wave ((a)) ended at 104.95, wave ((b)) ended at 105.16, and wave ((c)) ended at 104.81. Near term, while dips stay above 103.41, expect the Index to extend higher.
DXY 60 Minutes Elliott Wave Chart
Platinum Support Area
The Fed’s aggressive rate hikes to fight inflation has caused deterioration in economic outlook. Atlanta Fed’s GDP gauge now sees the second quarter running at – 2.1%. With the first quarter’s decline of 1.6%, this makes it two quarters in a row with negative GDP. This fits with the technical definition of a recession. As a result of the aggressive rate hikes, all risk assets including stock, commodities, and cryptos have been hit really hard while US Dollar has rallied very strongly. In today’s update, we will look specifically at Platinum to see a possible support area.
Platinum Monthly Elliott Wave Chart
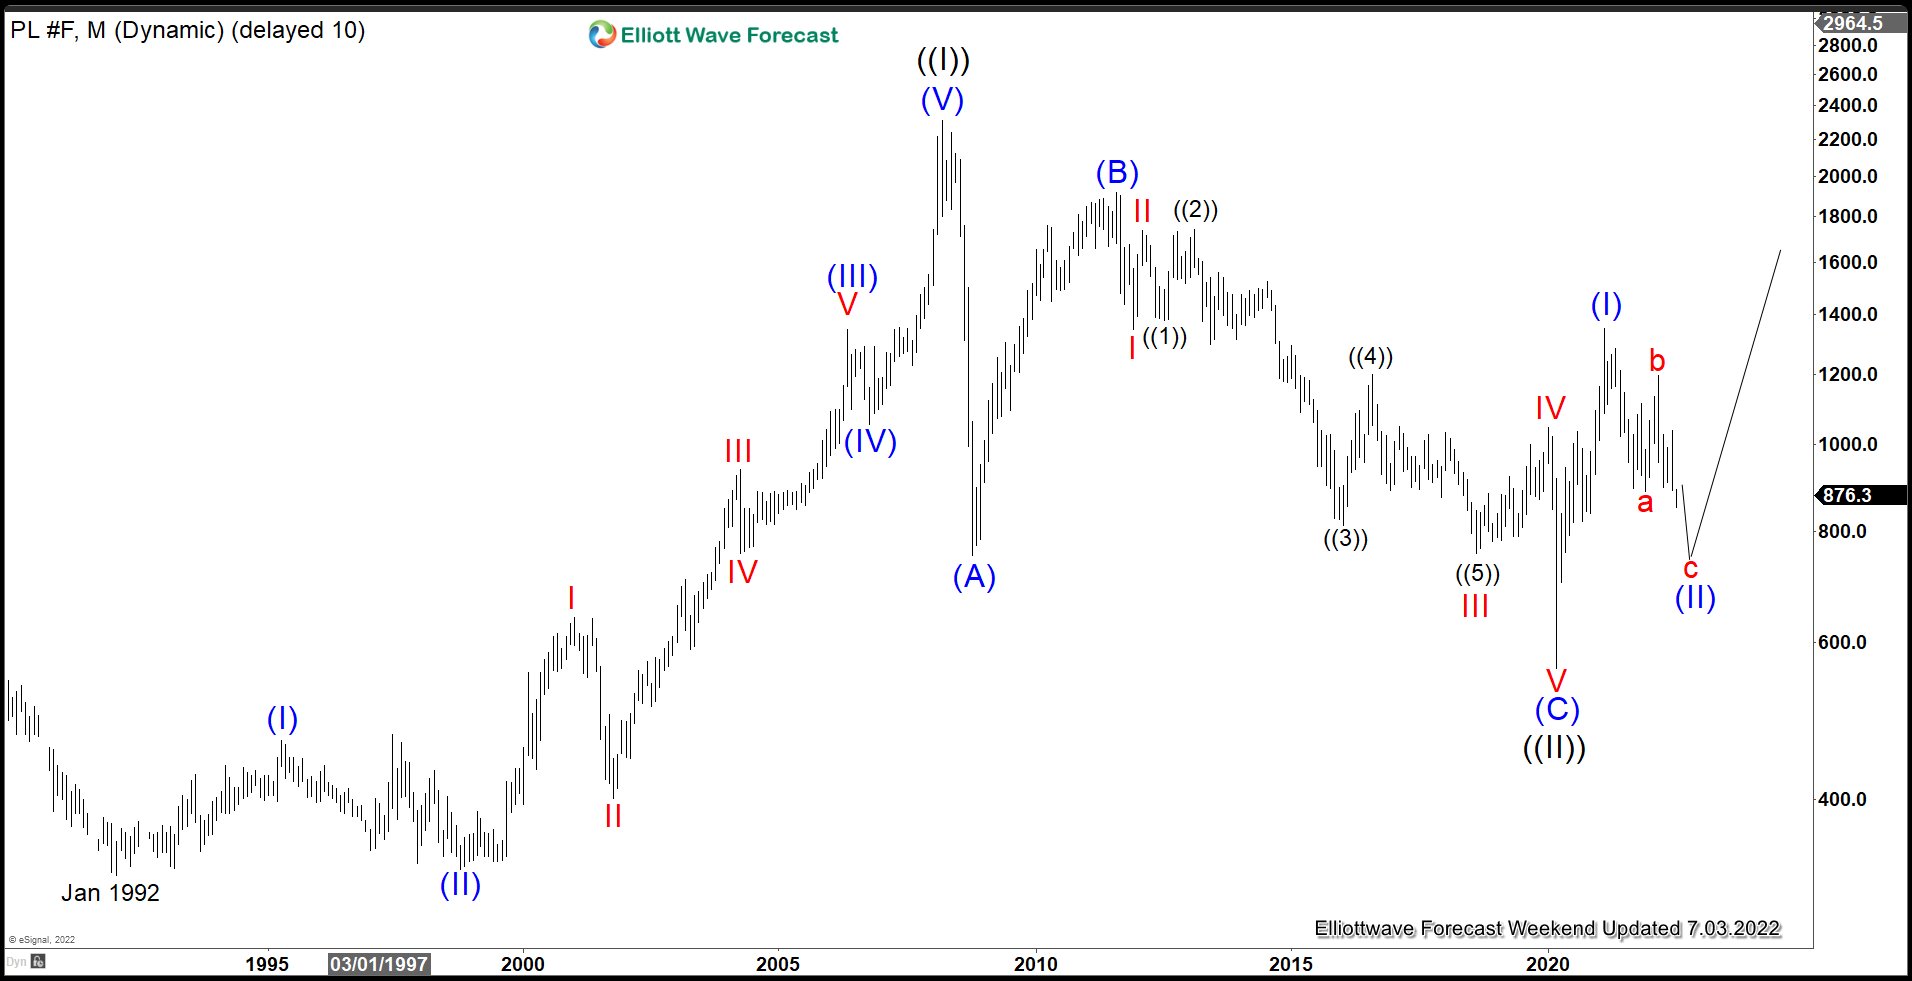
Monthly Elliott Wave in Platinum above suggests that the metal has ended Grand Super Cycle wave ((II)) pullback at $562. This ended the multi-decade correction to the cycle from January 1992. From there, Platinum has started a new bullish leg higher in wave ((III)). Up from wave ((II)), wave (I) ended at $1348.2. Wave ((II)) pullback is now in progress to correct cycle from 3/16/2020 low before the next leg higher. Let’s look at the daily chart below to get better look of the potential support area.
Platinum Daily Elliott Wave Chart
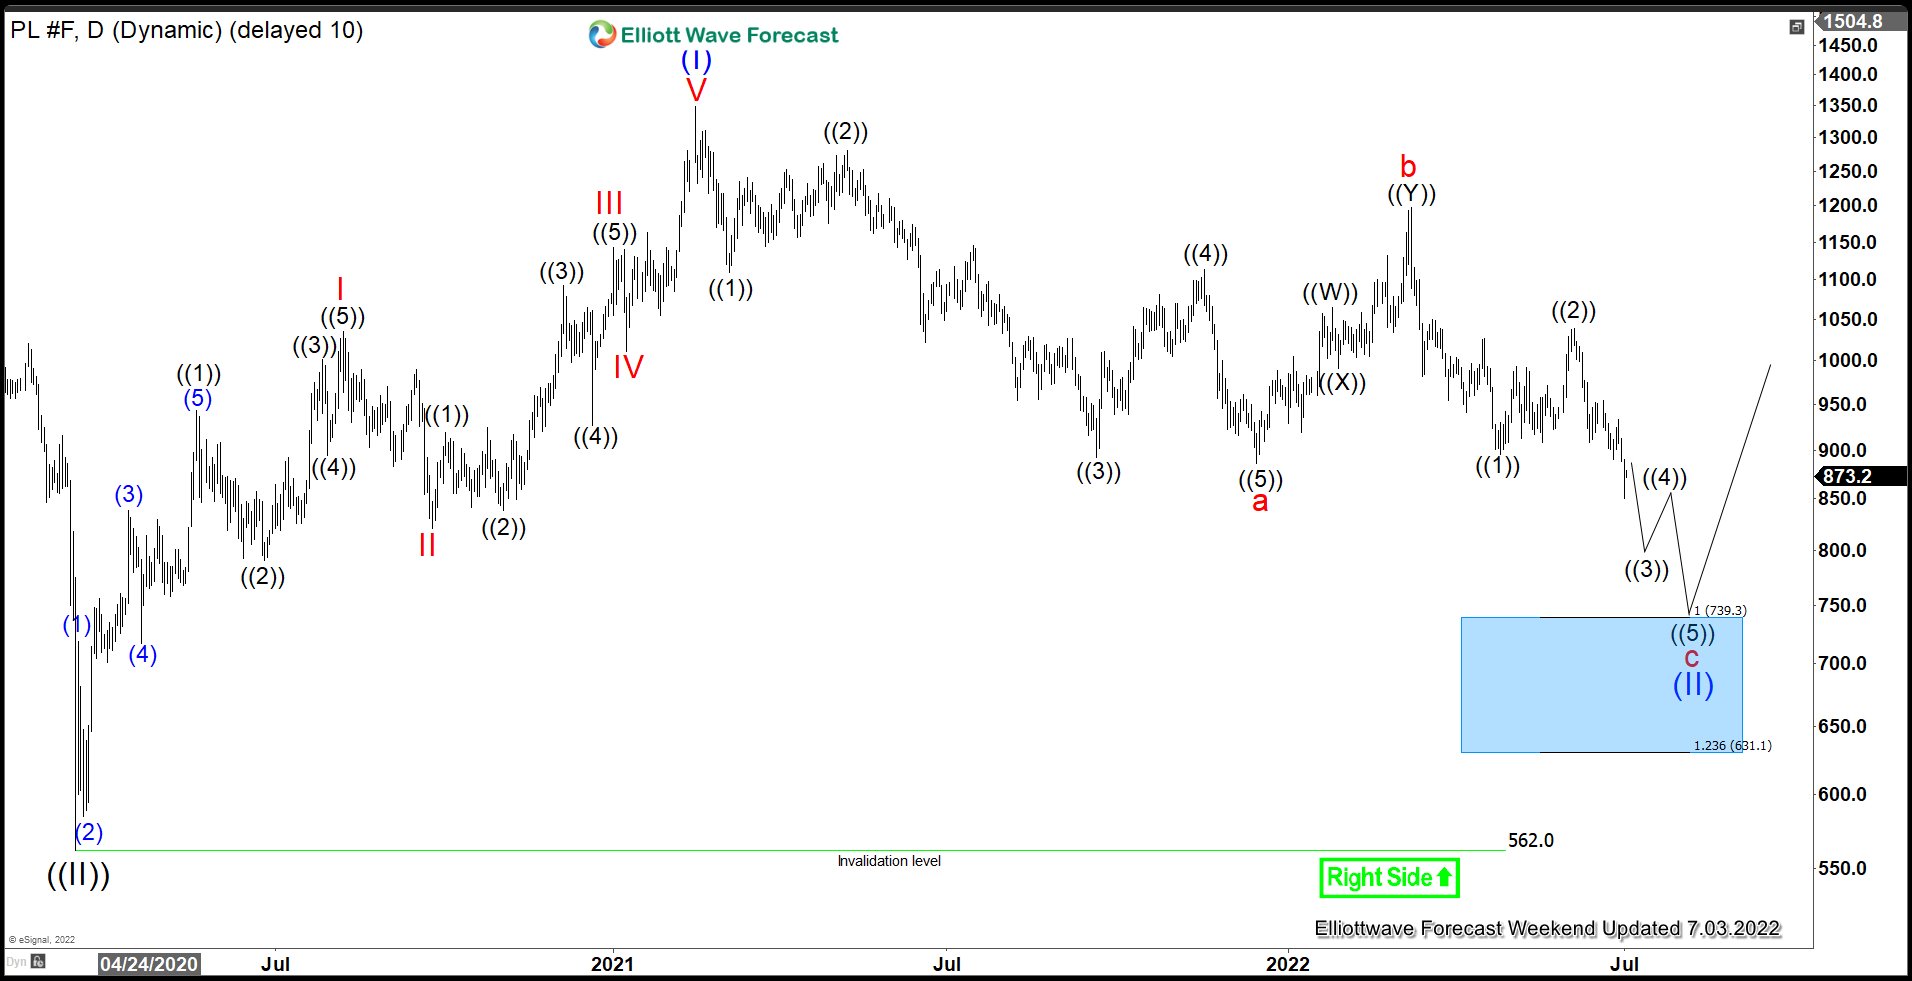
Daily Elliott Wave chart of Platinum above shows the potential support area for wave (II). The pullback is unfolding as a zigzag Elliott Wave structure. Down from wave (I), wave a ended at $886, and wave b ended at $1197. Wave c target can be measured as 100% – 123.6% Fibonacci extension of wave a which comes at $631 – $739 area. This area should see buyers for the next leg higher and give a good buying opportunity.
EURNZD Buying The Dips At The Blue Box Area
In this technical blog we’re going to take a quick look at the Elliott Wave charts of EURNZD published in members area of the website. As our members knew, we’ve been favoring the long side in EURNZD since it broke above May 12, 2022 high. Break of May 12, 2022 high created an incomplete bullish sequence in the pair up from April 5, 2022 low against June 3, 2022 low. EURNZD cycle from June 3, 2022 low ended at June 29, 2022 peak and it started pulling back. This pull back took the form of Elliott Wave Zig Zag pattern and members knew it was nothing more than another buying opportunity. In the remainder of the article, we are going to explain the Elliott Wave Pattern and talk about the blue box buying area.
Before we take a look at the real market example, let’s explain Elliott Wave Zigzag.
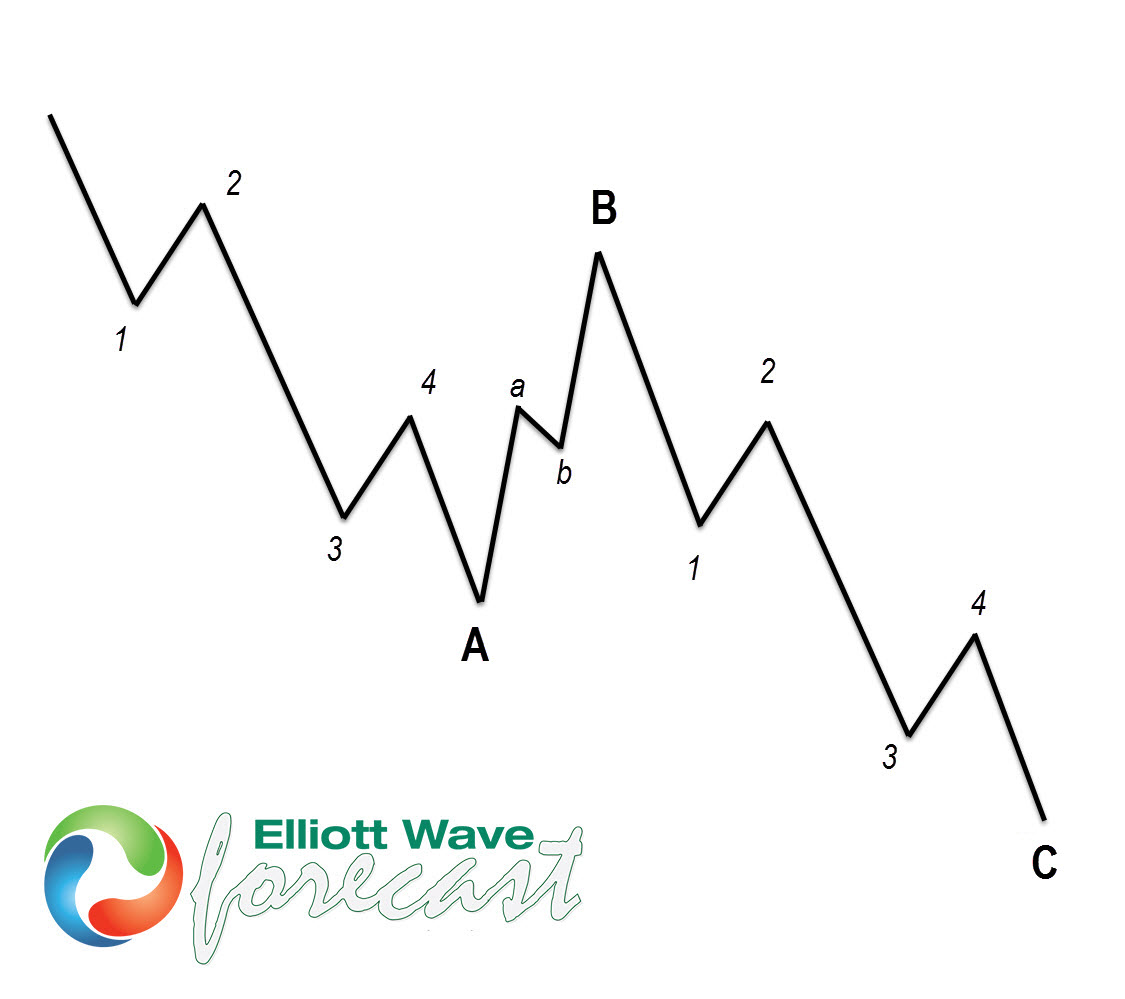
Elliott Wave Zigzag is the most popular corrective pattern in Elliott Wave theory . It’s made of 3 swings and is sub-divided as 5-3-5. Inner swings are labeled as A,B,C where A =5 waves, B=3 waves and C=5 waves. That means A and C can be either impulsive waves or diagonals. (Leading Diagonal in case of wave A or Ending in case of wave C) . Waves A and C must meet all conditions of being 5 wave structure, such as: having RSI divergence between wave subdivisions, ideal Fibonacci extensions and ideal retracements etc. Wave B could be a triangle, FLAT, Zigzag or a double three structure.
EURNZD 30 June, 2022 1 Hour Elliott Wave Update
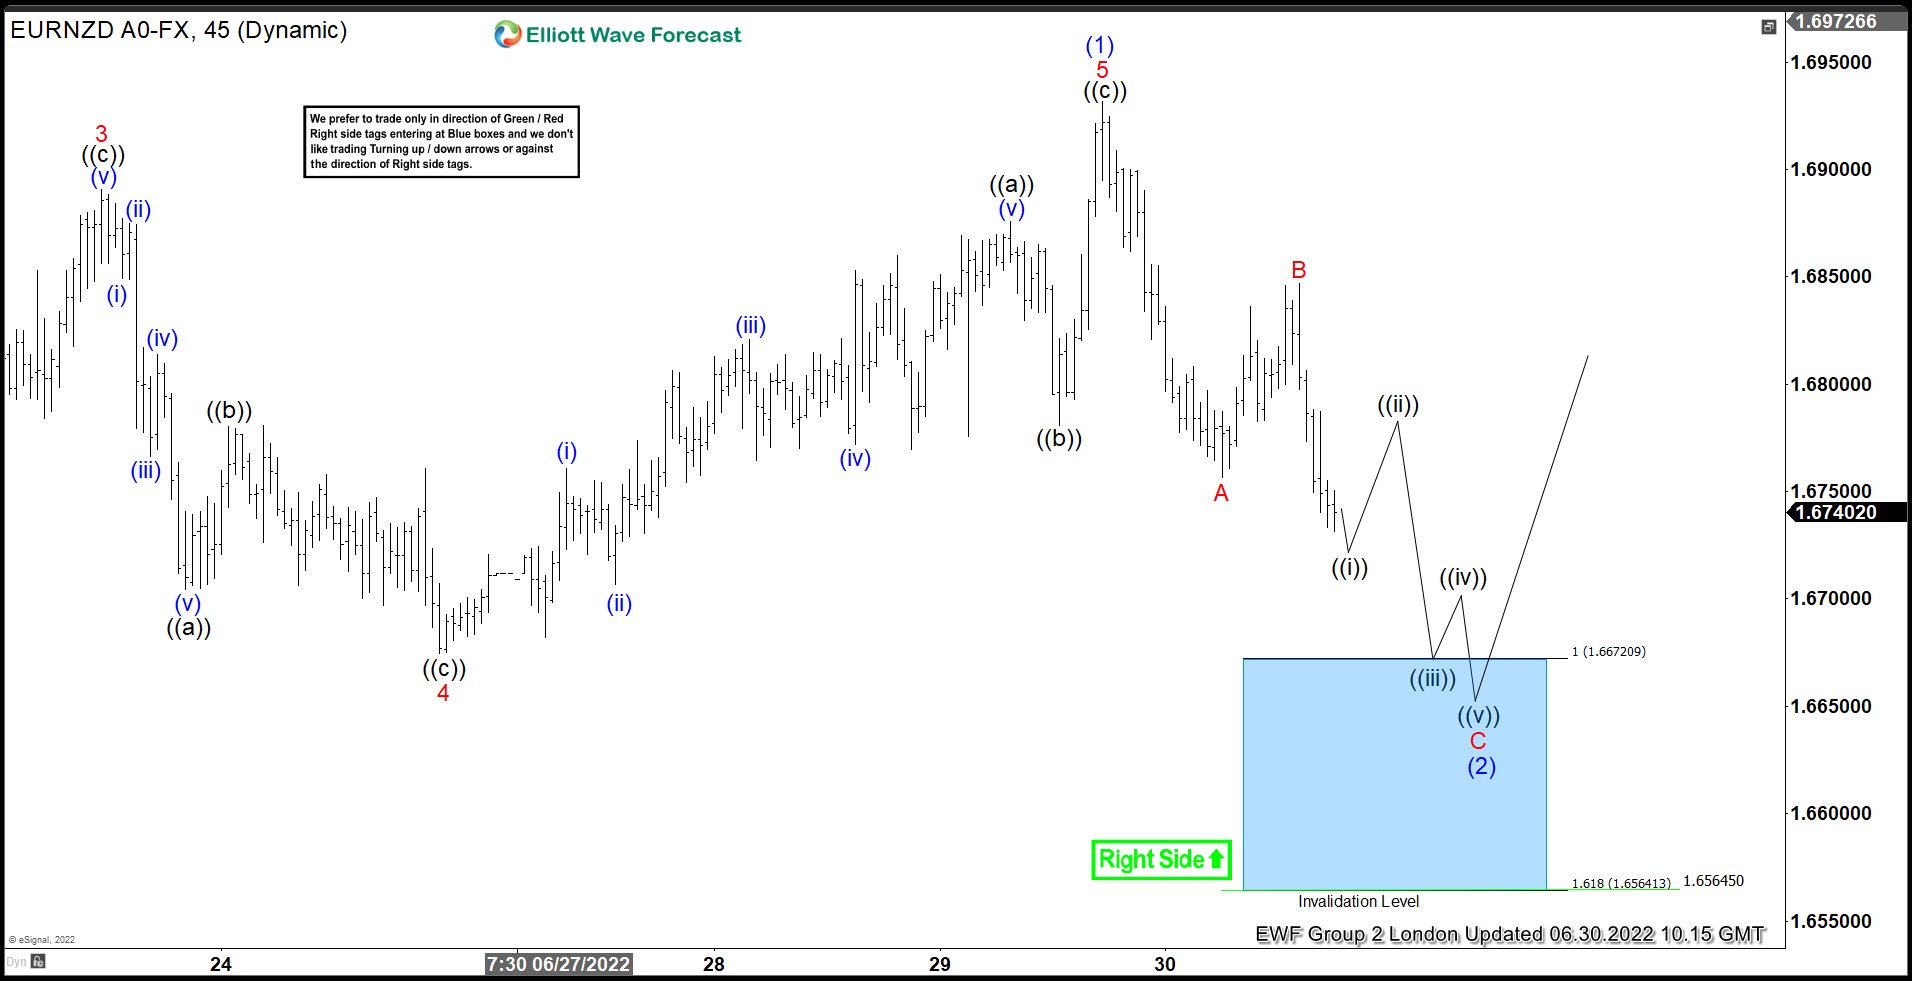
Current view suggests EURNZD is doing black pull back against the June 3, 2022 (1.6348) low. First leg from the peak was in 5 waves which has been labelled as wave A. Bounce was corrective and completed wave B. We have already seen a new low below wave A which makes it an incomplete sequence against June 30, 2022 peak. Current view suggests C leg is in progress toward 1.6672 – 1.6564 area (highlighted with a blue box).
We don’t recommend selling the pair against the main bullish trend. Strategy is waiting for the price to reached marked blue box zone, before buying the pair again. As the main trend is bullish we expect buyers to appear at the blue box for 3 waves bounce at least. Once bounce reaches 50 Fibs against red B high, we will make long position risk free by either moving stop loss to entry position or taking partial profits and putting stop on remaining position below the low within the blue box. Invalidation for the trade would be break of marked invalidation level at 1.6564. As our members know, Blue Boxes are no enemy areas , giving us around 80% or a higher chance to get 3 waves bounce at least from the blue box.
EURNZD 01 July, 2022 1 Hour Elliott Wave Update
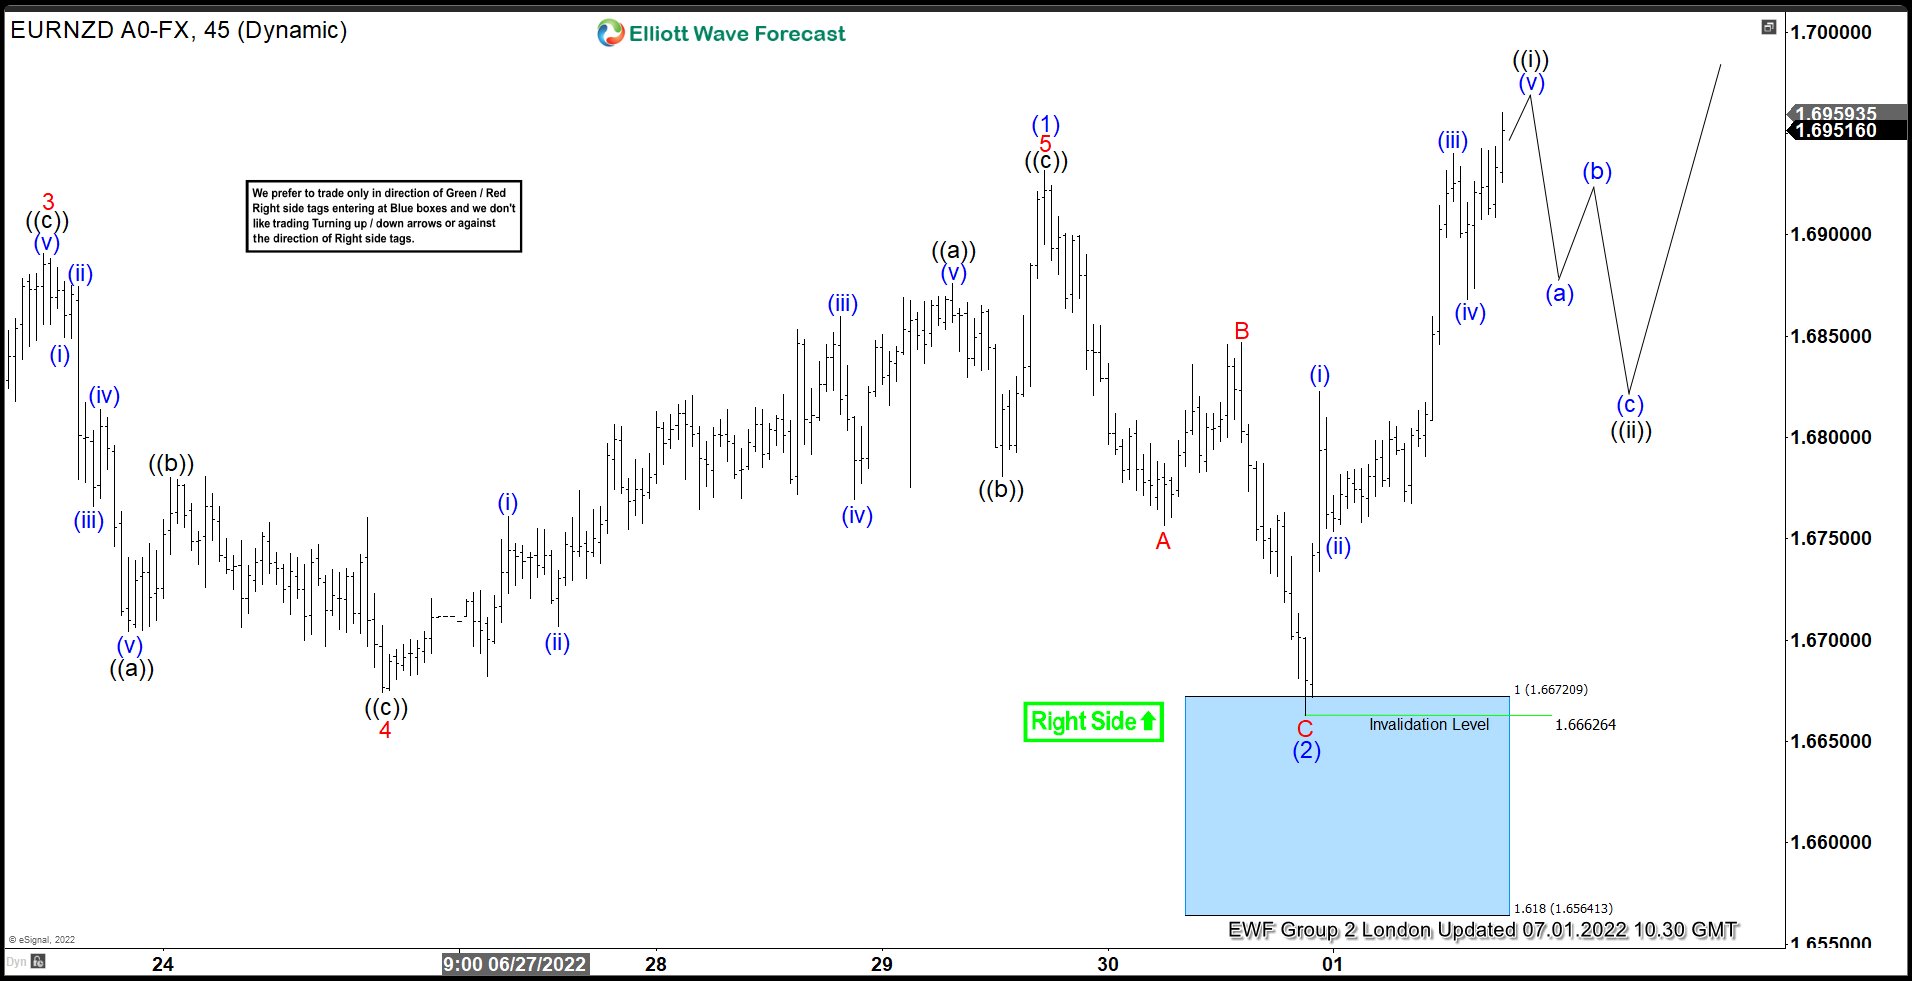
Chart below shows EURNZD made proposed leg down as we expected. The pair has found buyers at the Blue Box area and we are getting good reaction from there. Pull back completed at1.6662 low as a Zig Zag pattern. The rally from the blue box has already made a new high above June 29, 2022 low. Consequently, members who have taken the long trades at the blue box now enjoying profits in a risk free trades. As dips hold above 1.6662 low, expect the pair to continue higher and resume the rally.
EURNZD 04 July, 2022 1 Hour Elliott Wave Update
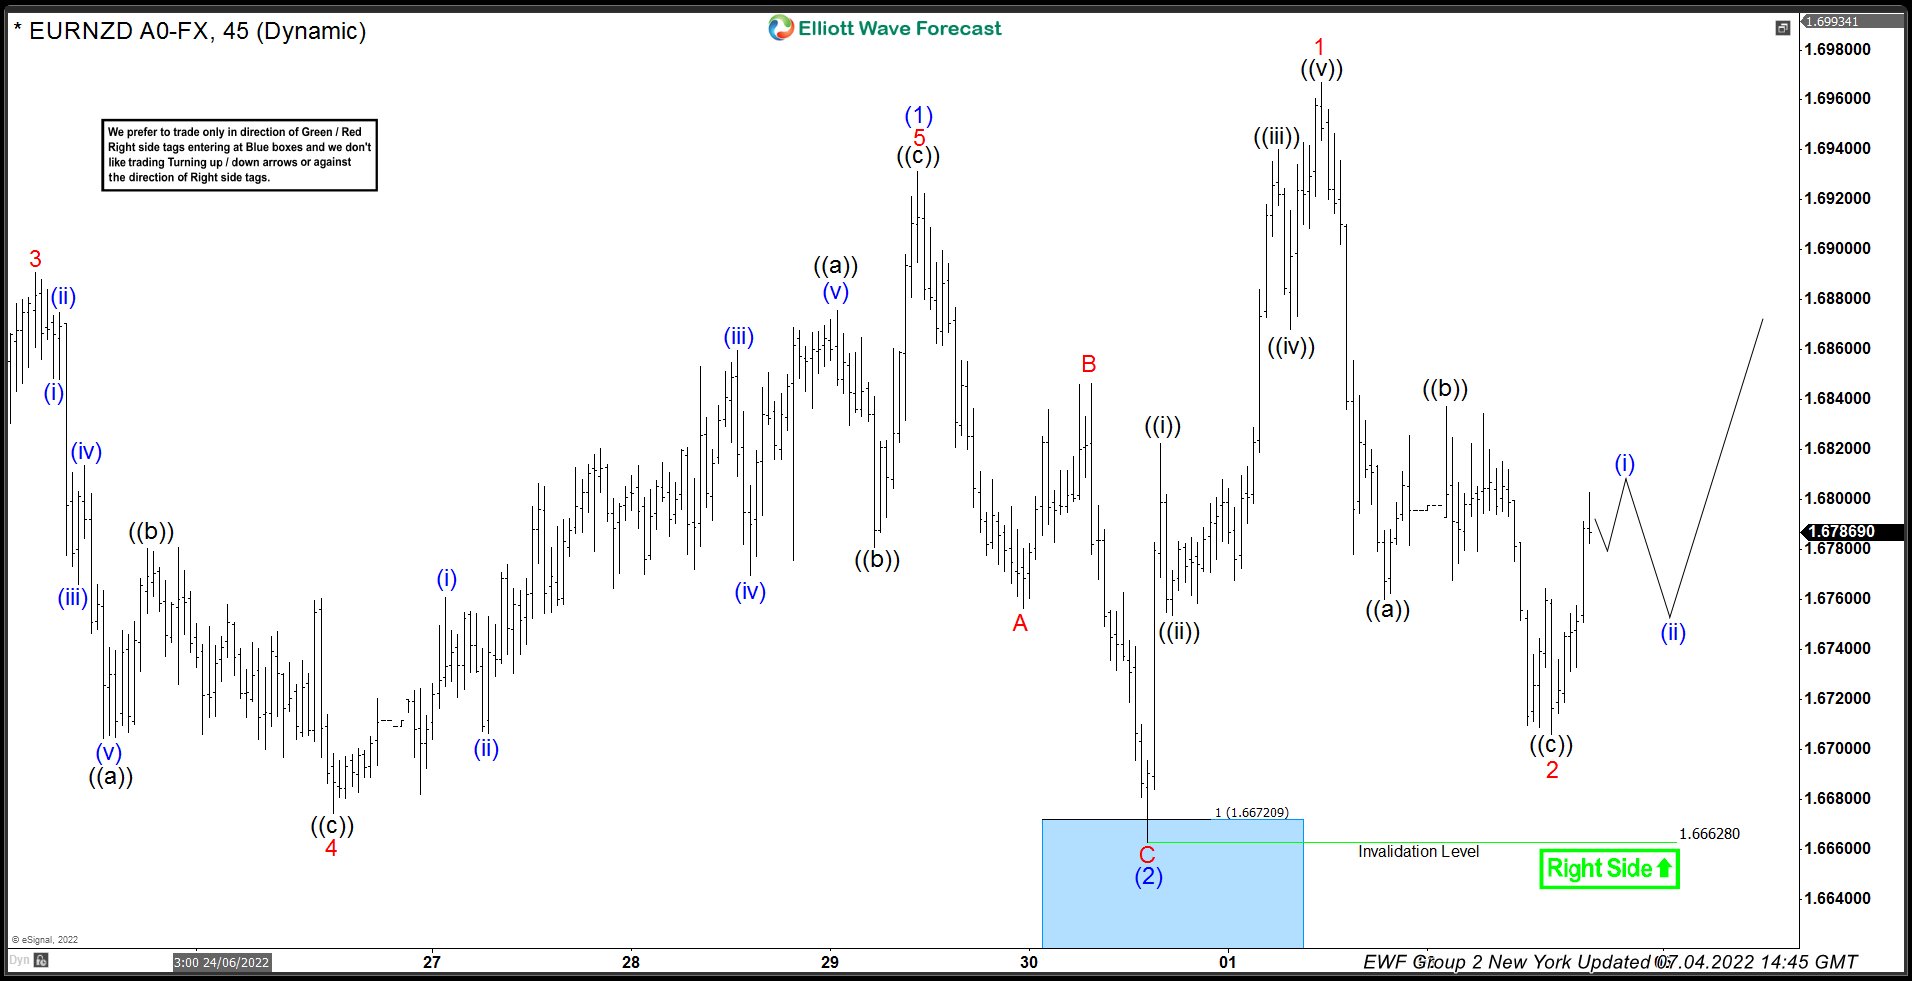
Chart below shows pair completed 5 waves up from 1.6662 low and pulled back in 3 waves. Pull back has held above 1.6662 low and now pair has scope to continue higher in wave 3. In case of a break below the recent low at 1.6706, wave (1) could be moved to July 1, 2022 peak (1.6967), 1.6706 low would become wave W and the bounce from 1.6706 low will become wave X. New low below 1.6706 should be part of wave Y of (2) and we should see buyers entering the market again at 100 – 161.8 Fibonacci extension area of W-X cycles. We will show the area with a blue box if market follows this path.
Keep in mind that market is dynamic and presented view could have changed in the mean time. You can check most recent charts in the membership area of the site.
EURAUD Wave Analysis
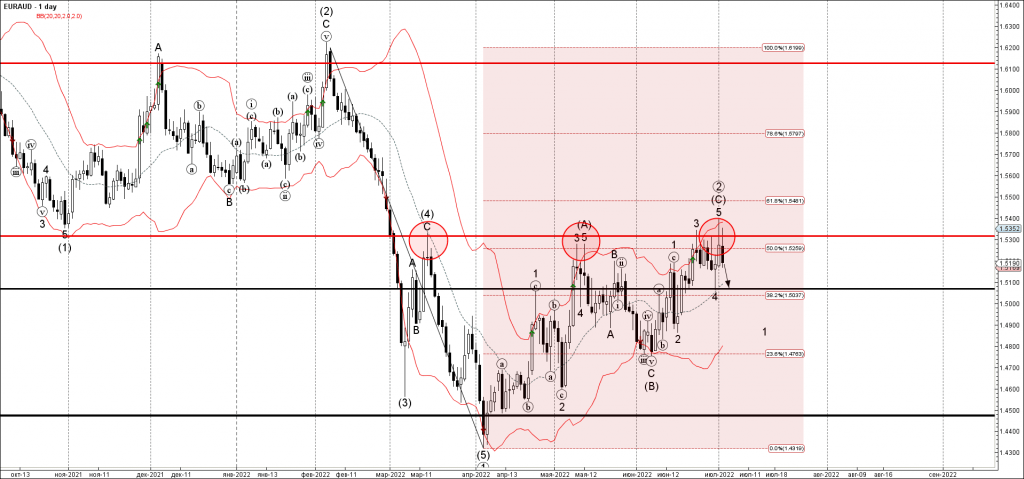
- EURAUD reversed from resistance level 1.5315
- Likely to fall to support level 1.5070
EURAUD recently reversed down from the key resistance level 1.5315 (which has been repeatedly reversing the pair from the start of March).
The resistance level 1.5315 was further strengthened by the upper daily Bollinger Band and by the 50% Fibonacci correction of the earlier downward impulse from the start of February.
EURAUD can be expected to fall further toward the next support level 1.5070 (low of the previous short-term correction 4 from the end of June).
GBPAUD Wave Analysis
- GBPAUD reversed from strong resistance level 1.7790
- Likely to test support level 1.7570
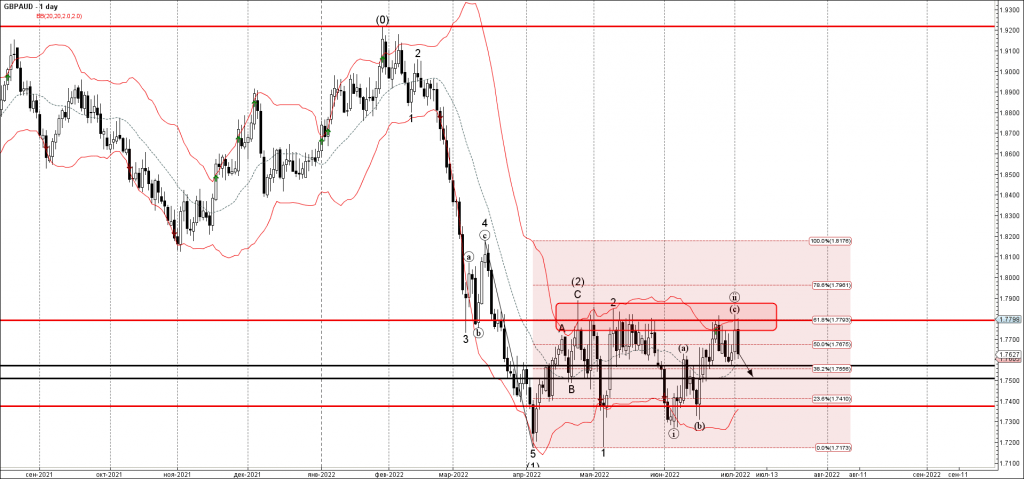
GBPAUD recently reversed down from the strong resistance level 1.7790 (former strong support from the start of March) , located near the upper daily Bollinger Band and the 61.8% Fibonacci correction of the earlier downward impulse from March.
The downward reversal from the resistance level 1.7790 stopped the previous minor ABC correction (ii).
Given the clear daily downtrend, GBPAUD can be expected to fall further toward the next support level 1.7570 (previous minor reversal low from the end of June).
Canadian Business Outlook Remains Elevated Heading into the Summer
Business optimism ticked lower but remained elevated in the second quarter of 2022, according to the Bank of Canada Business Outlook Survey (BOS). The BOS indicator, a statistical summary of survey results, remained elevated at 4.85 in 2022Q2, though down from 5.01 in 2021Q1.
Businesses generally expect solid sales growth over the next twelve months. However, it is expected to moderate, reflecting a return to more normal demand conditions. Firms with expectations of slowing sales growth were mainly linked to housing, natural resources and transportation. On the other hand, firms in high-touch industries heavily impacted by the pandemic expect their sales to grow faster, reflecting eased restrictions and pent-up demand.
The number of firms reporting supply chain bottlenecks remained high at 43%, though down slightly from the first quarter's record level. Meanwhile, labour shortages remain a huge challenge, with the share of firms reporting shortages as impeding their ability to meet demand remaining very high.
Both investment and hiring intentions were elevated, with the former supported in part by the need to improve productivity amid labour shortages, and by increased investment in the energy sector.
Tight labour markets (and a desire to reflect cost of living increases) have firms continuing to expect rising wages. Expected wage growth was at 5.8% - by far a survey high. Expectations remain that firms will pass on some of higher costs to customers, with the share of firms expecting output prices to increase significantly at a record high of 36%.
Businesses also expect inflation to be high for longer. Most business anticipate that inflation will be more than 3% on average over the next two years. Meanwhile, nearly one-quarter of firms expect inflation to stay well above 2% for three years or more, marking a significant increase from 2022Q1.
Key Implications
Today's BOS results delivered a dose of good news in that business optimism remained quite elevated heading into the summer, reflected in a well-above average reading on the BOS indicator. In addition, hiring and investment intentions remained healthy. However, the survey was conducted in May, before recession talk really started to ramp up.
We are getting some signs that the Canadian economy is beginning to cool. Manufacturing sentiment eased in June. In addition, we had a surprising drop in GDP during May (according to Statcan's flash estimate). Some slowdown in economic growth is required to bring inflation to heel. However, it still remains uncomfortably high. Price pressures are broadening, and today's BOS results showed an uptick in wage growth and in the share of firms anticipating inflation to remain higher for longer. As such, we look for another aggressive move by the Bank of Canada at their next rate announcement on July 13th.
NFP This Week Will Test Dollar’s Year-Long Trend
While the calendar’s second half of the year started last Friday, it will probably not begin in the markets until the upcoming US jobs data is released this Friday. It is worth sorting out where the US currency currently stands on the forex market.
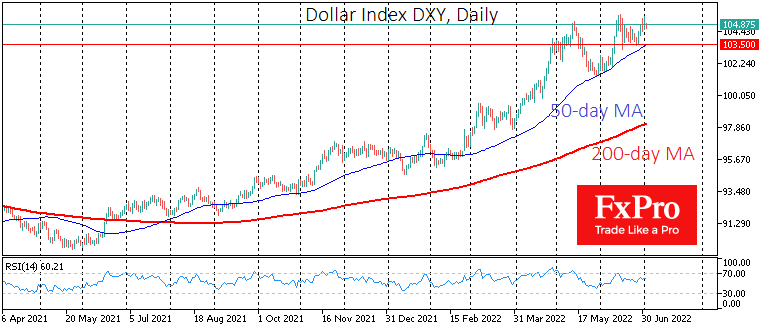
The Dollar Index has climbed to a 20-year high in the middle and at the end of June after a 12-month upward move. That’s an impressive age for a currency market, but it still takes more than old age to change a direction.
To assess the chances of a trend reversal in the USD, investors and traders should now pay closer attention to the labour market data and the Fed’s reaction. Weak employment growth data could confirm the current level of the Dollar Index as unbreakable. However, we shall still have to wait for data assessments from the Fed to confirm this.
However, another option is more likely. High inflation could stimulate the recovery of the labour market as more and more people will look for earning opportunities. This would pave the way for another 75-point key rate hike by the Fed in the second half of July, allowing interest rates to reach neutral levels in the next 6-8 months. That is much faster than developed country competitors will do, forming the conditions for further strengthening the Dollar.
Another attempt to take the 105 level by storm will likely be more successful. A corrective pullback in May from these heights was followed by a much shallower retreat in June, reflecting a strengthening of the bulls’ position. As has been the case over the last year, significant technical support is the 50-day moving average.
Should the week’s outcome follow the first bearish scenario, investors and traders should keep an eye on the 103.5 area. A sharp pullback below that would be a significant reversal signal. However, the index will likely touch new highs before the reversal.
Gold Price Analysis: Too Much Pressure
The Gold prices reached stability on Monday not far from $1,812 per troy ounce. The strong American currency still puts much pressure on the precious metal.
Despite the significant market turbulence, demand for Gold as a “safe haven” asset is close to zero because US bonds are rallying and attracting much more attention. Unlike bonds, Gold doesn’t generate its own profitability.
Another factor that makes Gold less attractive to investors in the anticipation of another rate hike by the US Federal Reserve System.
Also, the Gold price is being pressured by news from India, which raised its import fee for the precious metal from 7.5% с 12.5% to reduce the foreign trade deficit. This move will decrease the demand for Gold in the country – the news is very important for market players because India is the second biggest consumer of Gold on the planet.
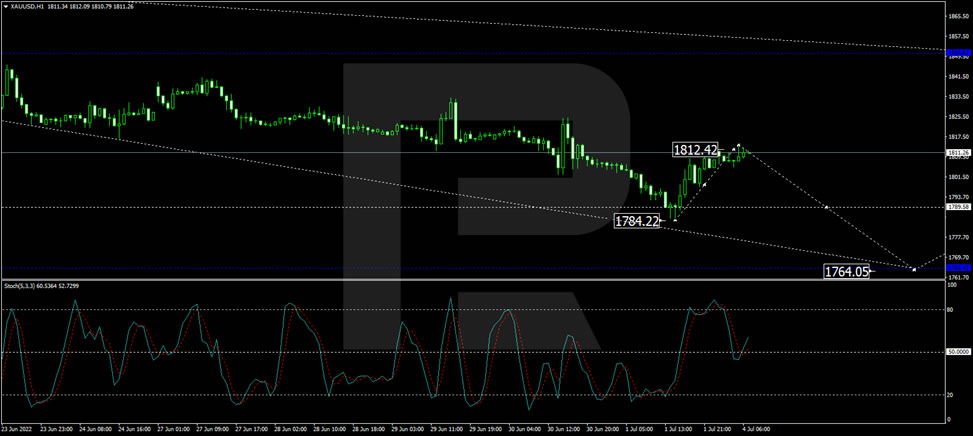
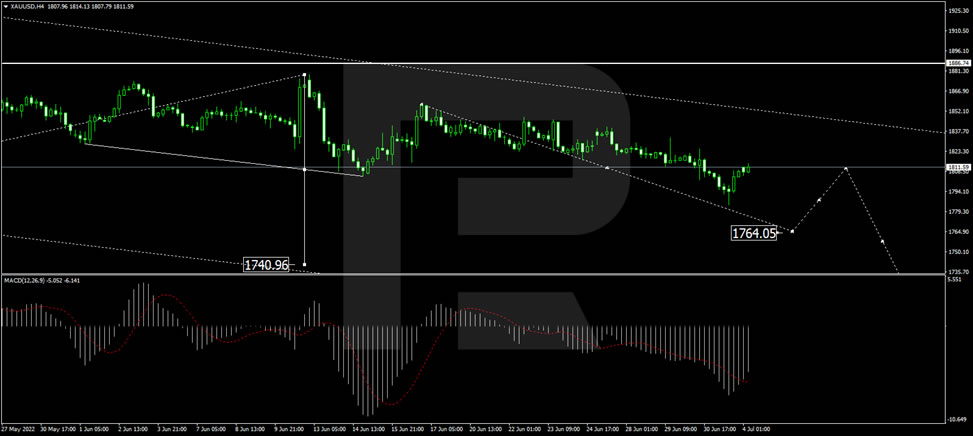
As we can see in the H4 chart, after completing the first descending structure at 1805.05, along with the correction up to 1857.10, XAU/USD has rebounded from the latter level; right now, it is falling again with the short-term target at 1764.00. Later, the market may start a new correction to test 1811.77 from below and then resume trading downwards towards 1704.88. From the technical point of view, this scenario is confirmed by the MACD Oscillator: its signal line is moving below 0 and may soon update its lows.
In the H1 chart, Gold has finished the descending wave at 1784.22, along with the correction to test 1812.40 from below; right now, it is consolidating below the latter level. Possibly, the metal may break this range to the downside and resume falling with the short-term target at 1764.00. From the technical point of view, this scenario is confirmed by the Stochastic Oscillator: after breaking 50 downwards, its signal is expected to continue falling and reach 20.