Sample Category Title
Gold Raises a Bullish Flag, But How Strong are the Bulls?
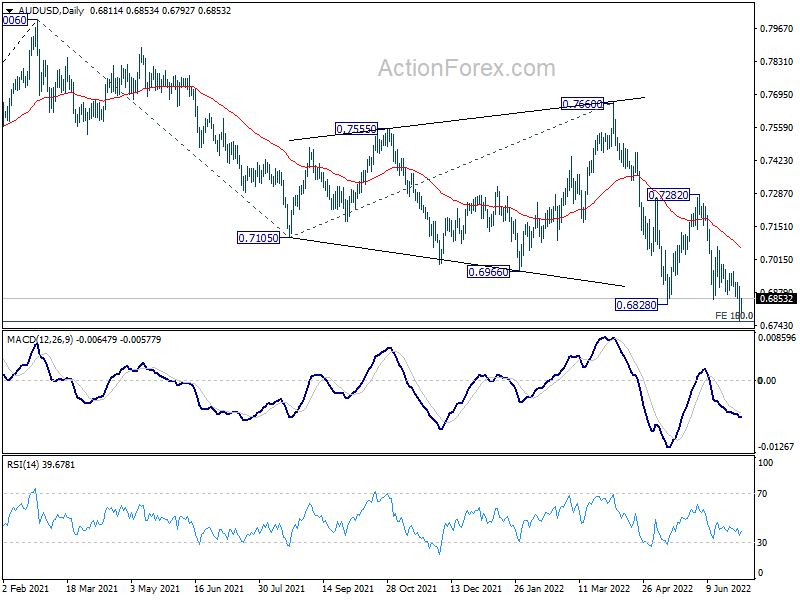
Gold optimism started to shine again after the creation of a bullish hammer candlestick on Friday, which succeeded the sharp bounce on May’s bottom of $1,786/ounce.
The price is currently pushing for a higher close slightly above the $1,810 level, trying to confirm the green bullish candlestick formation. Yet, some caution is still required given the negative trend in the RSI and the MACD, which keep hovering within the bearish area.
More importantly, the market is setting up a death cross between the 50- and 200-day simple moving averages (SMAs) after the bearish cross between the 20- and 200-day SMAs last week, suggesting that any upside correction might only be temporary and part of the original negative trend.
Nevertheless, if bullish forces persist, the precious metal will attempt to crawl above the broken support trendline seen at $1,825. Should efforts prove successful, the recovery may continue towards the $1,845 – $1,855 key region, where the longer-term SMAs and the upper boundary of the bearish channel are positioned. Further up, the price may face some congestion around the $1,870 barrier before accelerating towards the surface of the short-term bullish channel at $1,890.
On the downside, the $1,786 – $1,777 floor will remain under the spotlight. If it cracks, the downtrend could stretch towards the support zone around $1,760, while lower, all attention will turn to the 2021 barrier at $1,723.
Summarizing, gold has charted an encouraging candlestick pattern, flagging a potential turnup in the price, but negative risks haven't completely evaporated yet. Perhaps a durable advance above $1,825 could reduce skepticism and motivate additional buying.
AUD/USD: Aussie Bounces from New Two-Year Low But Upticks Seen Limited, RBA in Focus
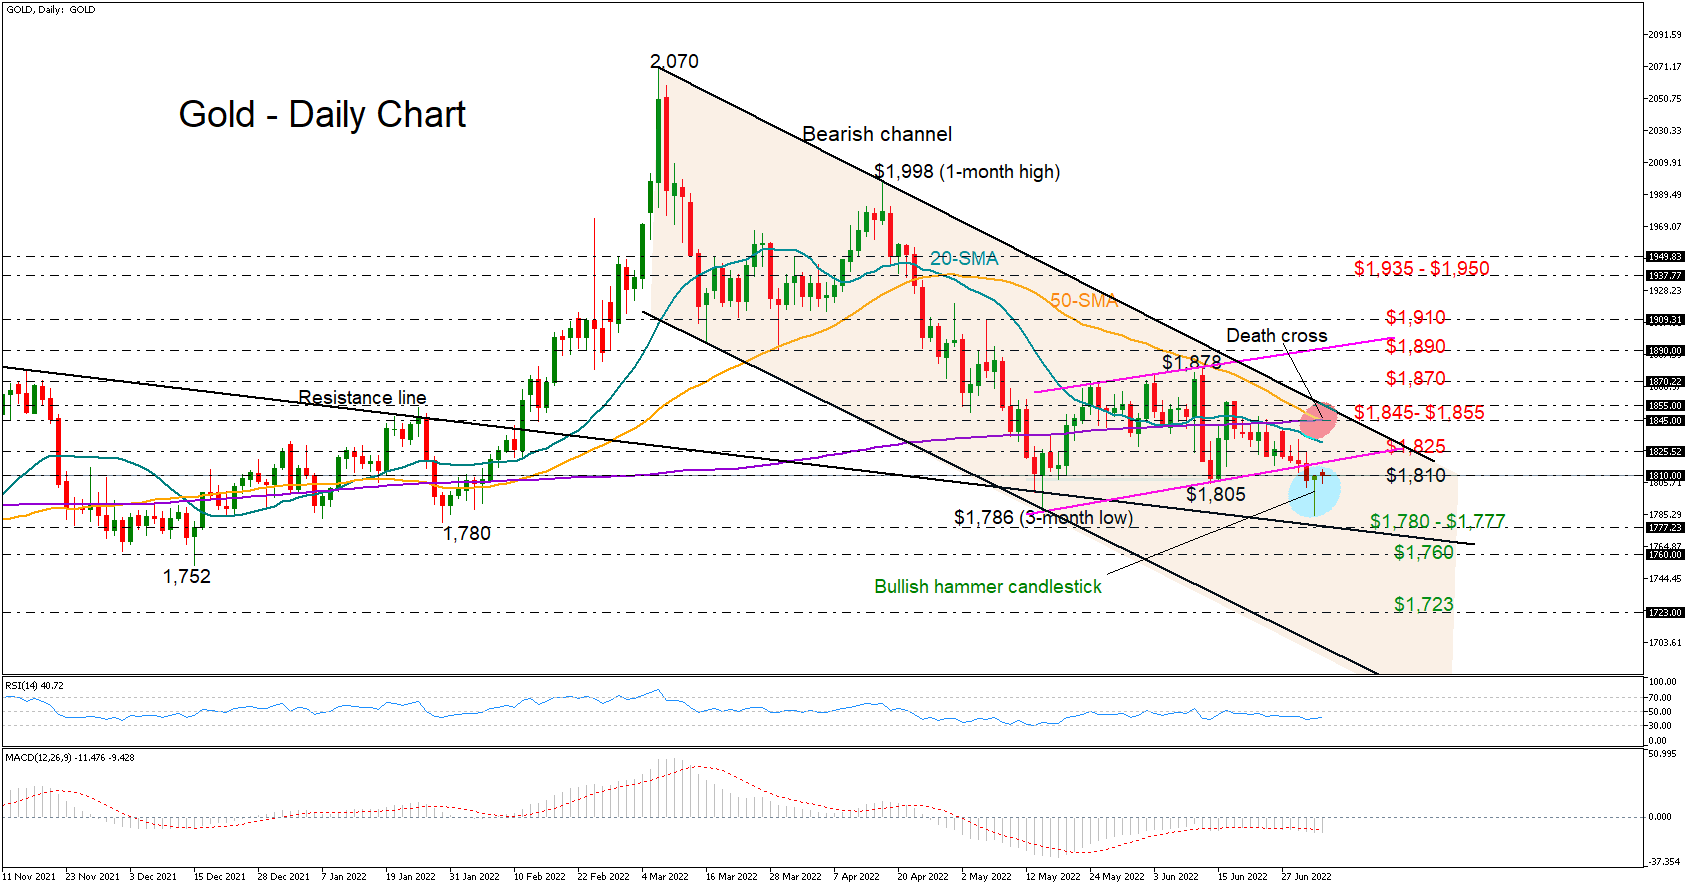
The AUDUSD edges higher in early Monday after 1.2% drop on Friday, when the pair broke below previous low at 0.6828 (May 12) and hit new two-year low at 0.6815.
Friday’s close below 0.6828 low was a bearish signal, though bears face headwinds here and may hold in extended consolidation before resuming.
Technical studies on daily chart are negative and adds to bearish sentiment on global growth worries that continues to hurt risk appetite.
Traders await Tuesday’s RBA policy meeting, with wide expectations for the second consecutive 0.5% hike that will push the rate to 1.35%, as the central bank puts all efforts to curb soaring inflation which is expected to hit 7% this year, with RBA statement expected to remain hawkish.
Focus is also on Fed minutes due on Wednesday, with the US central bank also seen maintaining hawkish stance, with growing expectations for more aggressive action on 0.75% hike.
Upticks face initial resistance at 0.6900 (falling 10DMA) which should ideally cap, while break here would ease downside pressure and open way for test of strong barriers at 0.7000/60 (psychological / base of thick daily cloud) where extended upticks should stall and offer better selling opportunities.
Bears eye initial target at 0.6758 (50% retracement of 0.5509/0.8007, Mar 2020/Feb 2021 rally), violation of which would risk acceleration towards 0.6643 (Jan 2019 spile low) and 0.6463 (Fibo 61.8%).
Res: 0.6871; 0.6900; 0.6964; 0.7000.
Sup: 0.6828; 0.6793; 0.6758; 0.6643.
AUD/USD Technical Analysis 4th July 2022
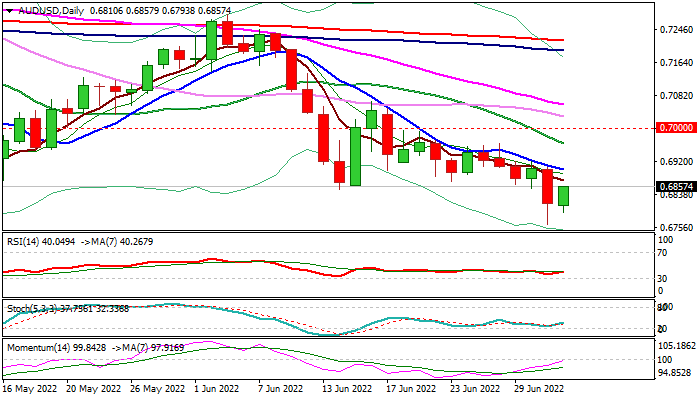
The Aussie Dollar started a fresh decline from the 0.6920 zone against the US Dollar. The AUD/USD pair traded below the 0.6850 support to move into a bearish zone.
It tested the 0.6760 zone on FXOpen and is currently correcting losses. It is now trading well below the 0.6850 level and the 50 hourly simple moving average. An immediate resistance on the upside is near the 0.6820 level.
There is also a key bearish trend line with resistance near 0.6825 on the hourly chart. If there is an upside break above the 0.6825 level, the pair could rise steadily towards the 0.6850 level in the near term. Any more gains could send the pair towards 0.6920.
An immediate support on the downside is near the 0.6780 level. The next key support is near the 0.6750 level. A downside break below the 0.6750 support could lead the pair towards the 0.6680 support.
GBP/JPY Daily Outlook
Daily Pivots: (S1) 161.68; (P) 163.50; (R1) 165.42; More...
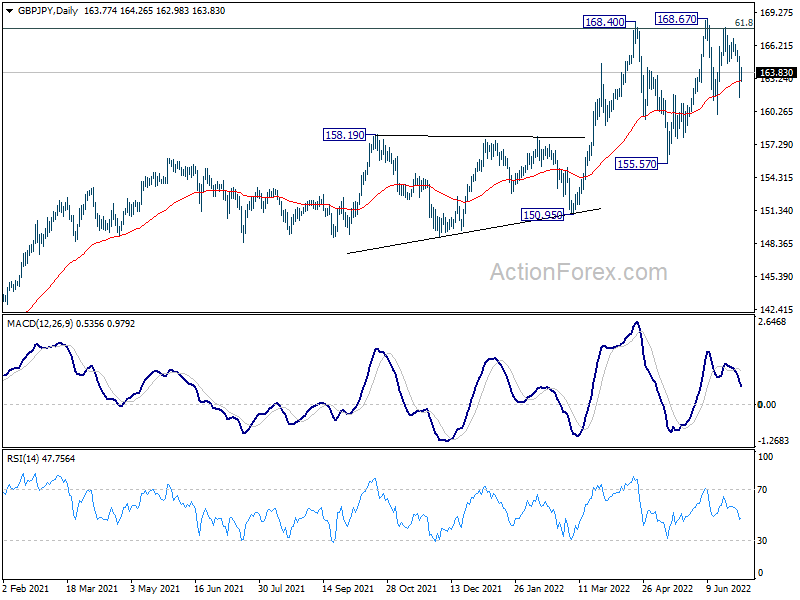
Intraday bias in GBP/JPY stays mildly on the downside for 159.97 support. Firm break there will raise the chance of rejection by 167.93 long term fibonacci resistance. Deeper fall would be seen to 155.57 support for confirmation. On the upside, above 164.13 minor resistance will bring retest of 168.67 high instead.
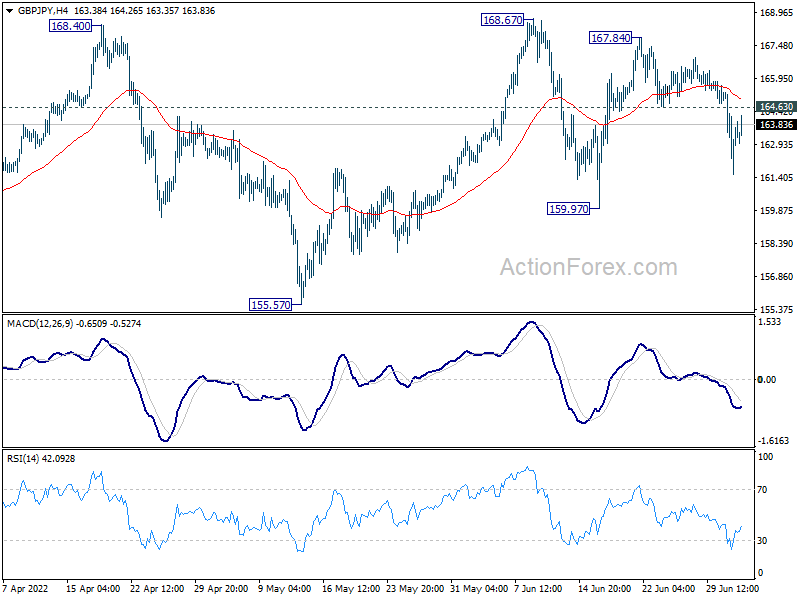
In the bigger picture, up trend from 123.94 (2020 low) is still in progress. Sustained break of 61.8% retracement of 195.86 (2015 high) to 122.75 (2016 low) at 167.93 will be a long term bullish signal, and could pave the way back to 195.86 high. This will now remain the favored case as long as 155.57 support holds, even in case of deep pull back.
EUR/JPY Daily Outlook
Daily Pivots: (S1) 139.75; (P) 141.09; (R1) 142.38; More....
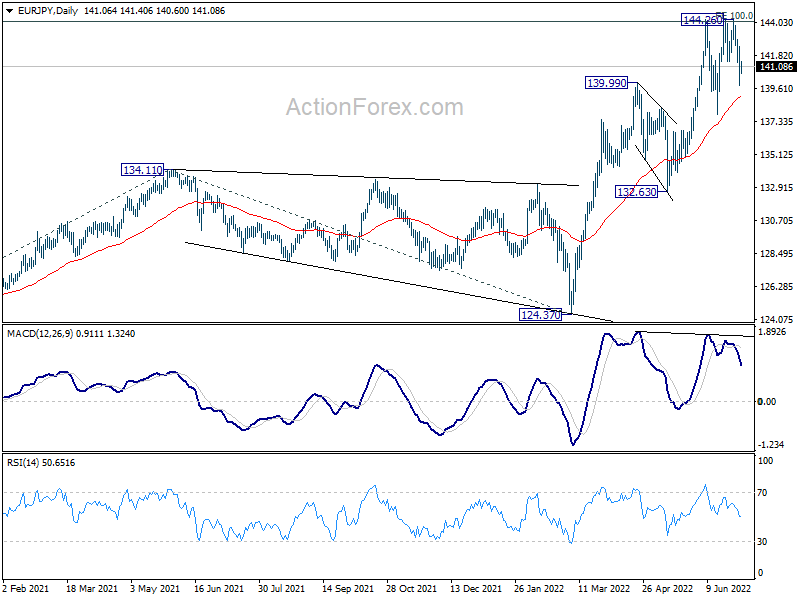
Intraday bias in EUR/JPY stays mildly on the downside for 137.83 support first. Sustained break there will raise the chance of rejection by 144.06 long term projection level and target 132.63 support. On the upside, above 142.42 minor resistance will bring retest of 144.26 high instead.
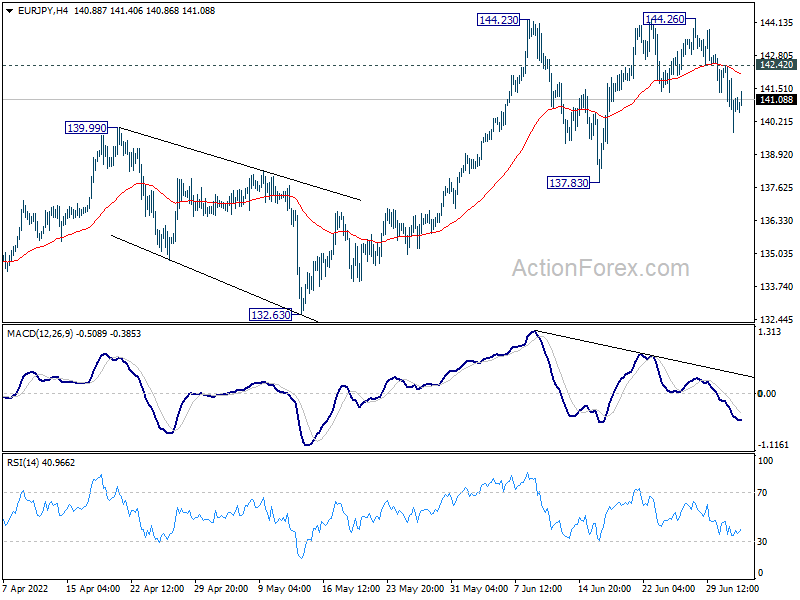
In the bigger picture, up trend from 114.42 (2020 low) is in progress. Such rise is seen as the third leg of the pattern from 109.30 (2016 low). Sustained trading above 100% projection of 114.42 to 134.11 from 124.37 at 144.06 will indicate upside acceleration and target 149.76 long term resistance (2014 high). In any case, outlook will remain bullish as long as 132.63 support holds, in case of deep pull back.
EUR/AUD Daily Outlook
Daily Pivots: (S1) 1.5181; (P) 1.5290; (R1) 1.5406; More...
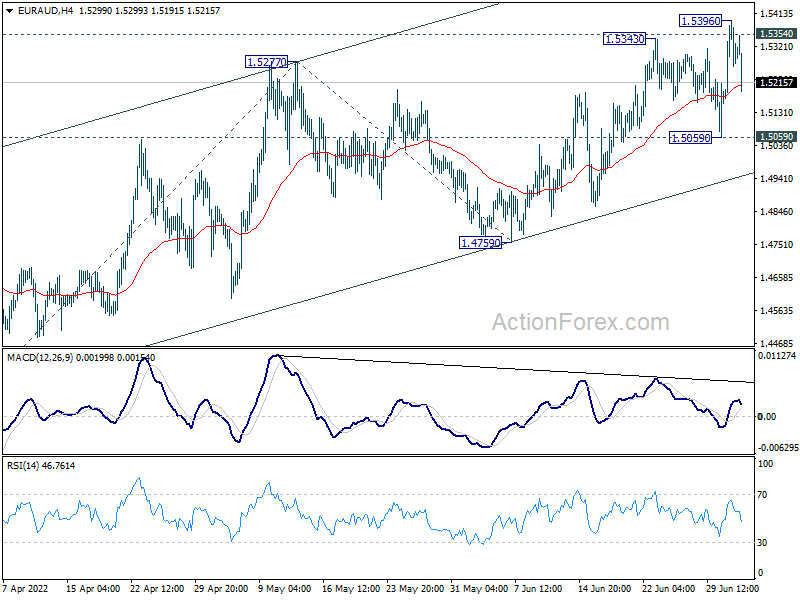
Intraday bias in EUR/AUD is turned neutral with current retreat. Further rise is expected with 1.5059 support intact. Sustained trading above 1.5343 resistance should indicate medium term bottoming at 1.4318. Stronger rally would be seen back to 100% projection of 1.4318 to 1.5277 from 1.4759 at 1.5718. However, firm break of 1.5059 support will indicate rejection of 1.5354, and revive medium term bearishness, and turn bias back to the downside.
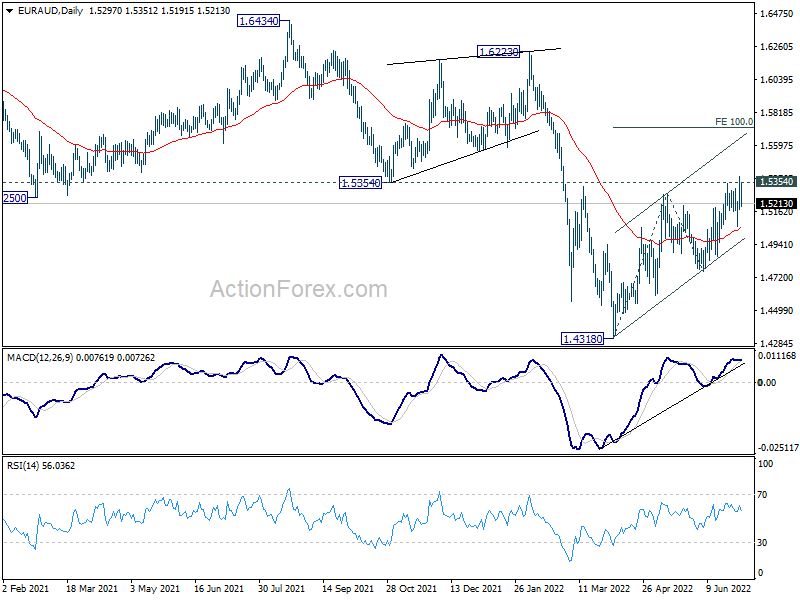
In the bigger picture, sustained break of 1.5354 support turned resistance will argue that a medium term bottom was formed at 1.4318 already. It would still be too early to call for long term trend reversal. But further rise would then be seen back towards 1.6434 resistance (2021 high). However, rejection by 1.5354 will retain bearishness for extending the down trend from 1.9799 (2020 high) through 1.4318 at a later stage.
EUR/GBP Daily Outlook
Daily Pivots: (S1) 0.8592; (P) 0.8635; (R1) 0.8665; More...
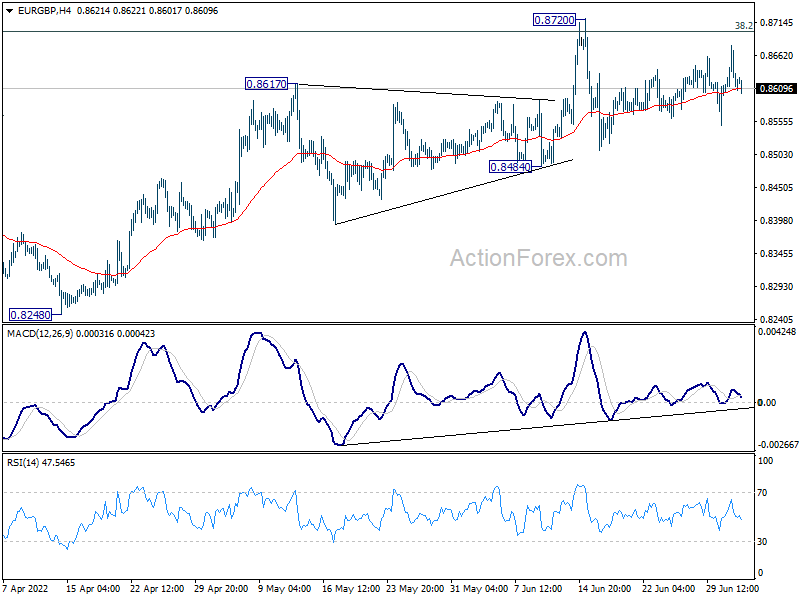
Intraday bias in EUR/GBP remains neutral for the moment. As long as 0.8484 support holds, further rise is in favor. Break of 0.8720 and sustained trading above 0.8697 medium term fibonacci level will carry larger bullish implication. Next target is 0.9003 fibonacci level. However, break of 0.8484 will indicate rejection by 0.8697 and turn near term outlook bearish.
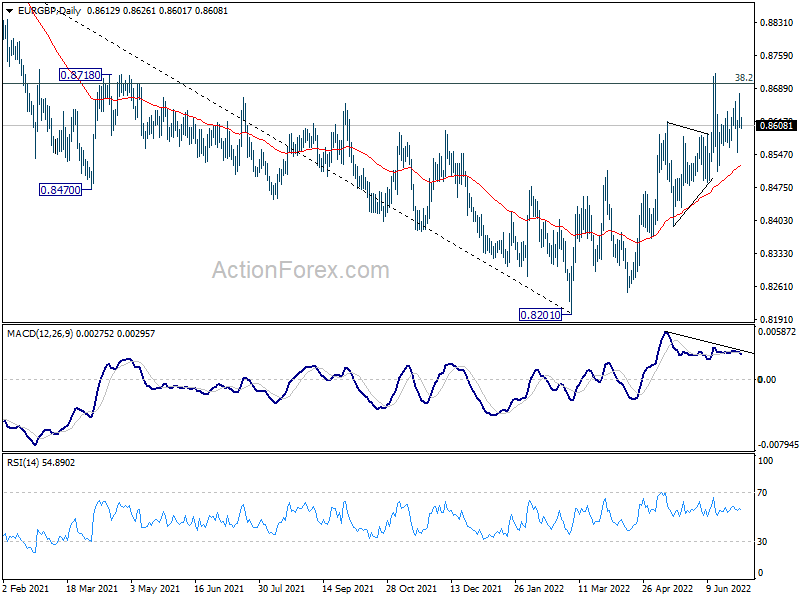
In the bigger picture, rise from 0.8201 medium term bottom could could either be a correction to the down trend from 0.9499 (2020 high), or a medium term up trend itself. Sustained break of 38.2% retracement of 0.9499 to 0.8201 at 0.8697 will affirm the latter case, and pave the way to 61.8% retracement at 0.9003. However, rejection by 0.8697 will maintain medium term bearishness.
EUR/CHF Daily Outlook
Daily Pivots: (S1) 0.9975; (P) 1.0009; (R1) 1.0039; More....
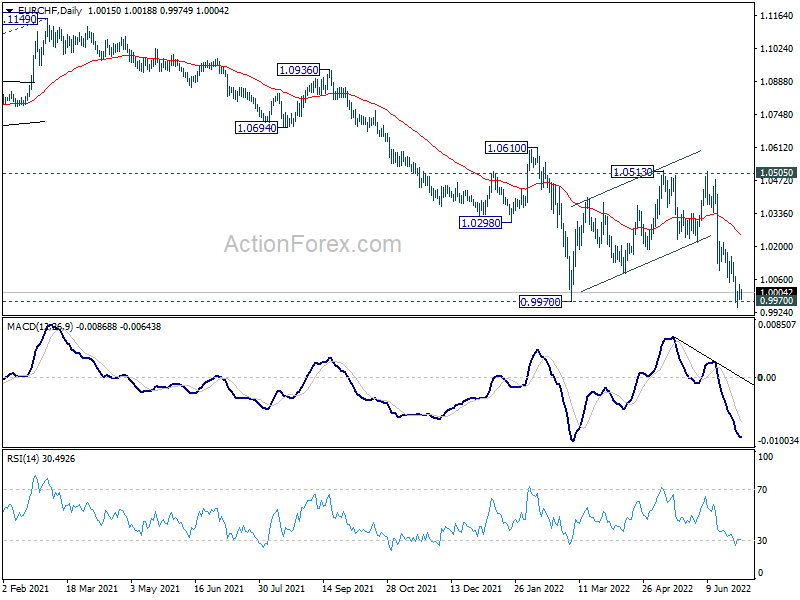
Intraday bias in EUR/CHF remains neutral for consolidation above 0.9943 temporary low. On the downside, sustained trading below 0.9970 will resume larger down trend for 0.9650 long term projection level. For now, outlook will stay bearish as long as 1.0155 resistance holds, in case of stronger recovery.
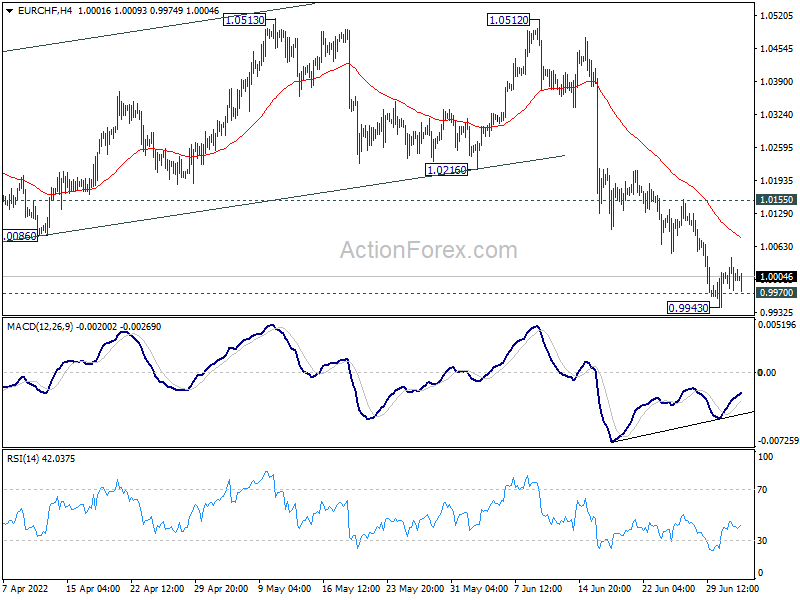
In the bigger picture, as long as 1.0505 support turned resistance (2020 low) holds, long term down trend from 1.2004 (2018 high) is expected to continue. Next target is 100% projection of 1.2004 to 1.0505 to 1.1149 at 0.9650. However, firm break of 1.0505 will suggest medium term bottoming, and bring stronger rebound towards 1.1149 structural resistance.
USD/CAD Daily Outlook
Daily Pivots: (S1) 1.2845; (P) 1.2906; (R1) 1.2945; More...
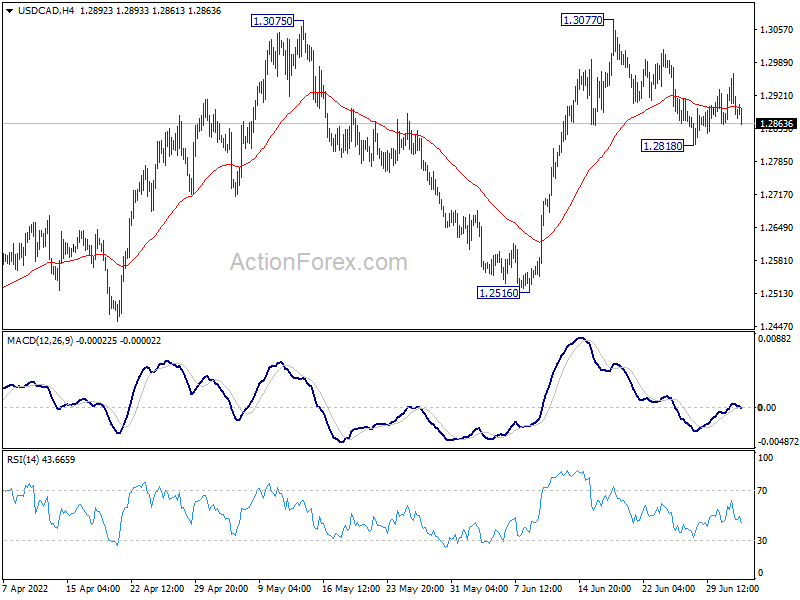
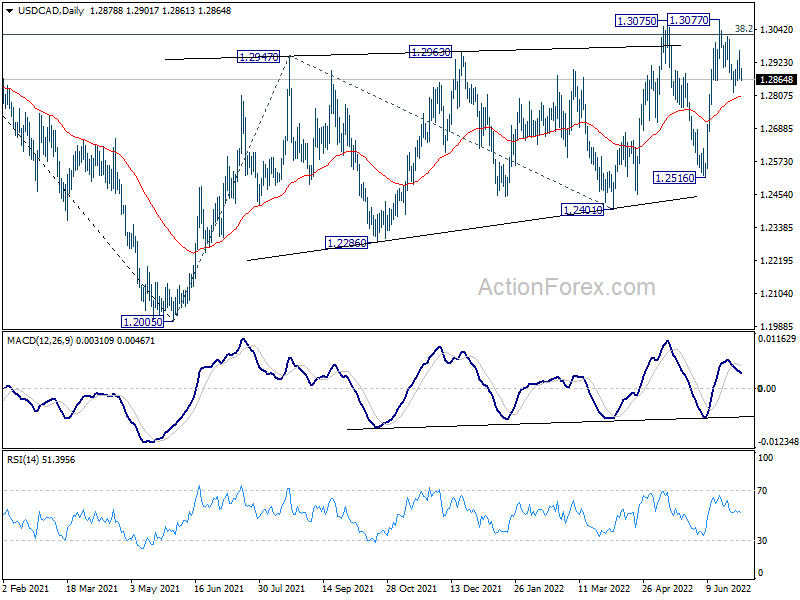
Intraday bias in USD/CAD remains neutral for the moment. On the downside, break of 1.2818 minor support will resume the fall from 1.3077 towards 1.2516 support next. On the upside, break of 1.3077 and sustained trading above 1.3022 fibonacci level will carry larger bullish implications, and bring up trend resumption.
In the bigger picture, focus stays on 38.2% retracement of 1.4667 (2020 high) to 1.2005 (2021 low) at 1.3022. Sustained break there should confirm that the down trend from 1.4667 has completed after defending 1.2061 long term cluster support. Further rise would then be seen towards 61.8% retracement at 1.3650. However, rejection by 1.3022 will maintain medium term bearishness.
AUD/USD Daily Report
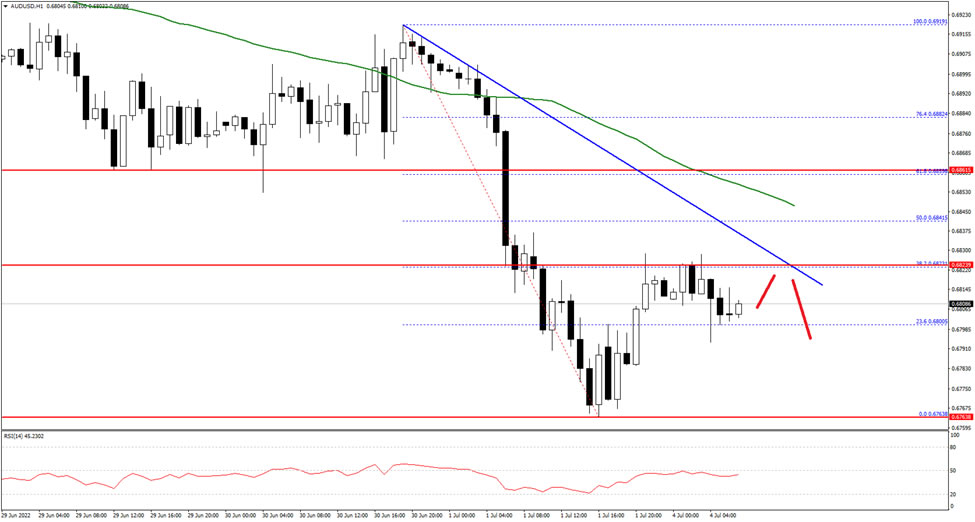
Daily Pivots: (S1) 0.6752; (P) 0.6829; (R1) 0.6894; More...
Intraday bias in AUD/USD remains neutral a this point. Strong support could still be seen from 0.6756/60 cluster support to bring rebound. On the upside, above 0.6918 resistance will indicate short term bottoming, and turn bias back to the upside for 0.7282 resistance. However, sustained break of 0.6756/60 will carry larger bearish implication and target 0.6461 fibonacci level next.
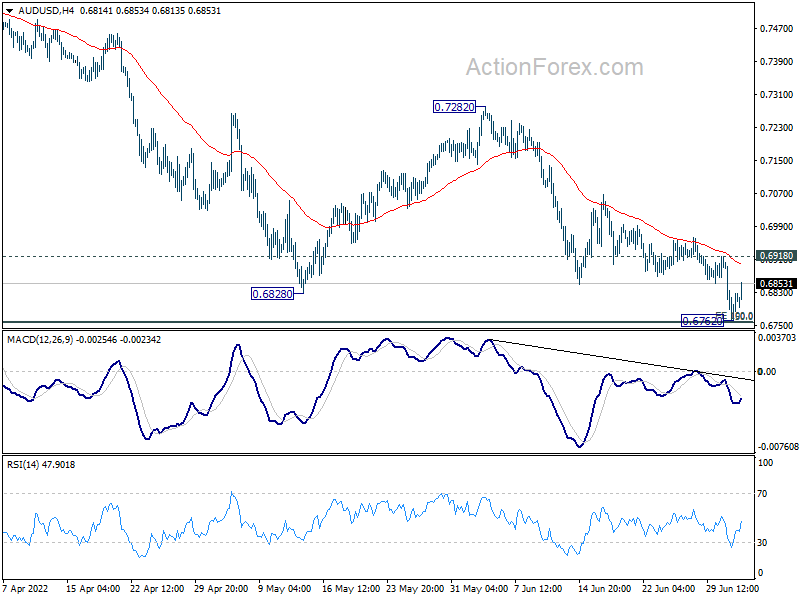
In the bigger picture, price actions from 0.8006 are seen as a corrective pattern to rise from 0.5506 (2020 low). Strong support is expected from 50% retracement of 0.5506 to 0.8006 at 0.6756 to complete the pattern. This coincides with 100% projection of 0.8006 to 0.7105 from 0.7660 at 0.6760. However firm break of 0.6756/60 will raise the chance of bearish reversal and target 61.8% retracement at 0.6461.