Sample Category Title
NZD/USD: Sending Mixed Signals
NZD/USD has formed what may be construed as bearish flag formation. But after Wednesday’s more hawkish than expected RNBNZ, traders should be prepared for a reversal as much as they are primed for any continuation in the recent downtrend. Also, keep in mind that the Kiwi has found support from the recent paring back in Fed interest rate hike expectations, which may not prove temporary.
Wednesday’s high of 0.65144, was in striking distance of the prior 5 May swing high of 0.65686. Should the latter be breached, that could act as a signal to buyers that the downward trend in NZD/USD may about to be reversed. Likewise, price breezed past the 50% and 61.8% Fibonacci retracement level between the prior swing high and the 12 May swing low of 0.62166. In other words, there is enough reason for bears to be cautious at current levels.
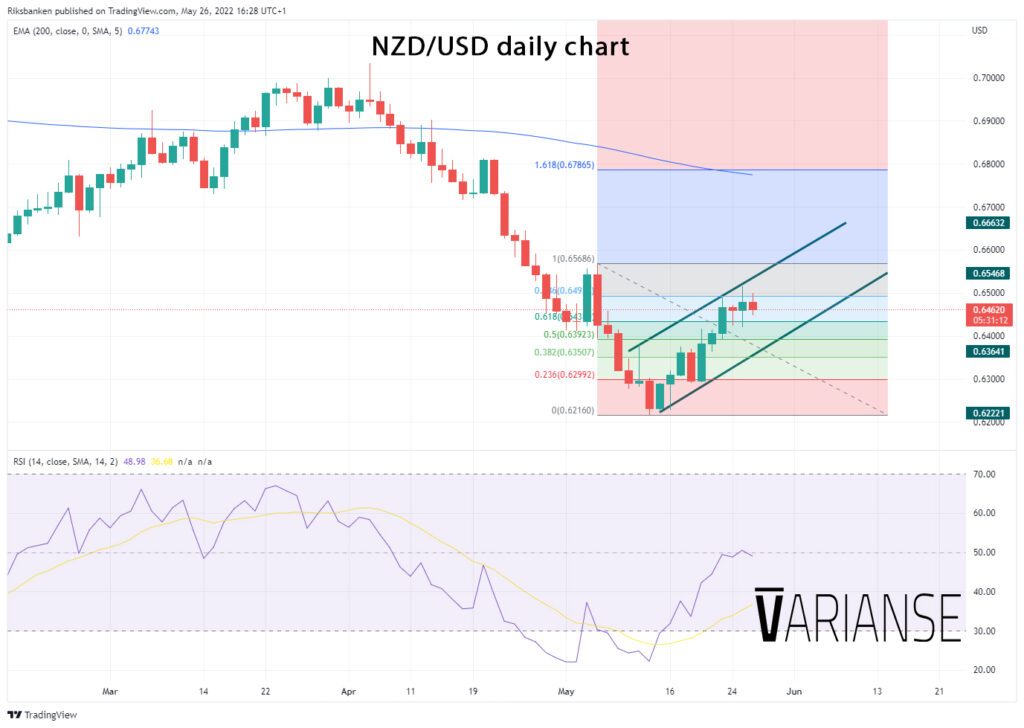
That said, with price well below its 200-day exponential moving average and given the prevailing uncertainly in financial markets more broadly, bulls may be less apt to push the currency pair higher. Similarly, single Japanese candlesticks in recent days haven’t told much of a story in terms of momentum in either direction. A daily RSI sitting near the 50 mark provide and equally ambiguous signal.
For traders with strong bearish convictions about NZD/USD at these levels, the conservative approach may be to wait for a breach of the lower diagonal support of the flag formation and subsequent successful retest before deciding on sizing and entry of positions. The Kiwi’s sensitivity to global growth and risk appetite, two prevailing market themes at the moment, leave the Kiwi prone to high volatility.
AUD Drifting Ahead of Retail Sales
The Australian dollar started the week with gains of close to one percent, but has been mostly drifting since then. AUD/USD is trading quietly, just below the 0.71 line.
It hasn’t been a very good week on the Australian release front, raising concerns that the economy may be slowing down. Manufacturing and Services PMIs both slowed in May, while Construction Work Done and Private New Capital Expenditure both recorded declines in the first quarter. The week winds up with April Retail Sales on Friday, which is projected to slow to 0.9%, after a 1.6% in March. Australia releases GDP next week, and an underperforming release would likely dampen sentiment towards the Australian dollar.
The new Labour government is rolling up its sleeves after its election victory and getting to work. Both Labour and the defeated Liberal party made campaign promises to review RBA operations, including how it targets inflation. The new Treasurer, Jim Chalmers, says he will announce his findings shortly. Chalmers said on Wednesday that he had inherited “very tricky” economic conditions, including rising inflation and interest rates, and a massive trillion-dollar debt.
FOMC signals more 50-bps hikes
The FOMC minutes didn’t contain any surprises, which actually soothed nervous markets. Investors have become increasingly concerned that the US economy might tip into recession. Recent data, such as housing, has been weak, while at the same time that the Federal Reserve has embarked on an aggressive rate-hike cycle aimed at slowing the economy and containing inflation.
With inflation still not showing signs of peaking, there have been calls from some Fed officials to deliver a super-super-size 75 bps hike. To the relief of the markets, the minutes appeared to put to rest such a drastic move, as the Fed signalled that it will hike by 50 bps in June and July, followed by a pause in September. This would allow the Fed to monitor the effects of the June and July hikes on the economy and on inflation levels.
AUD/USD Technical
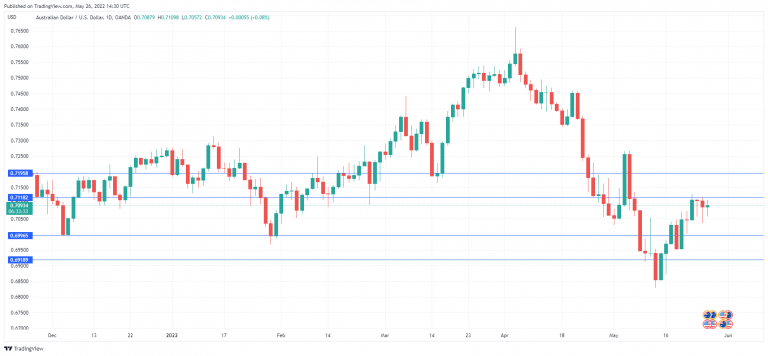
- 0.7118 is a weak resistance line. Above, there is resistance at 0.7196
- There is support at 0.6996 and 0.6918
BTCUSD Extends Sideways Move But Downside Risks Linger
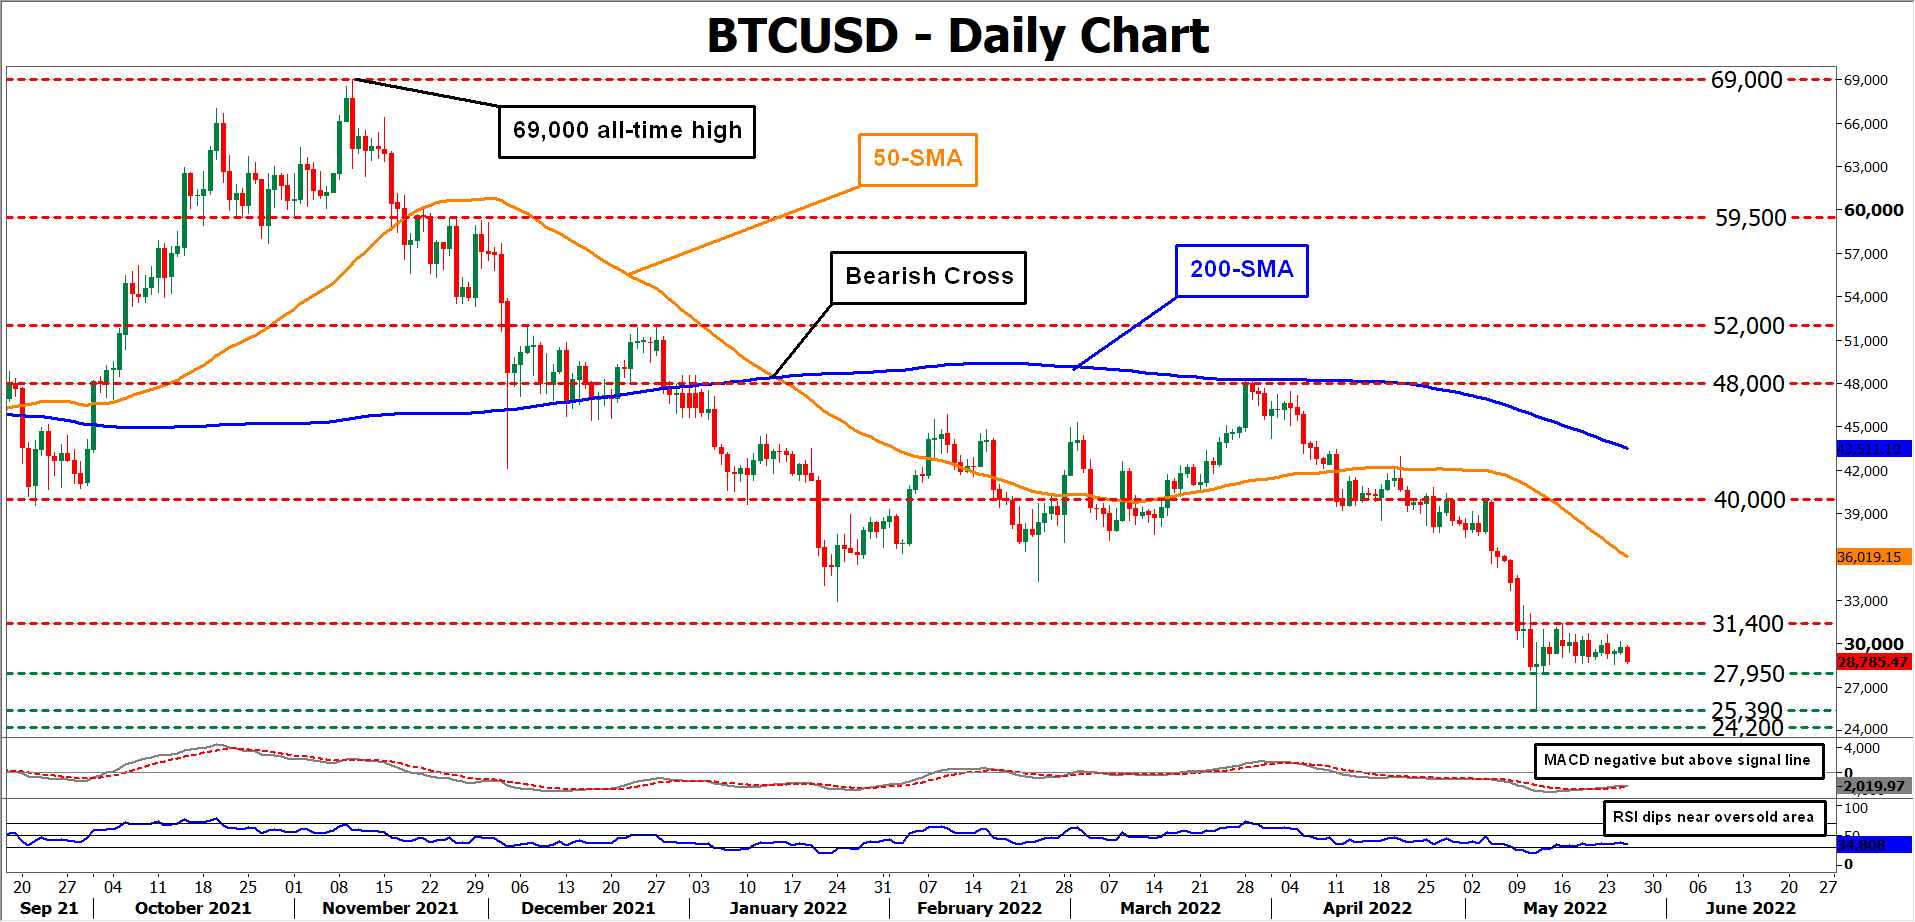
BTCUSD has been trading within a tight range during the past week, with the decline in volatility probably hinting that traders are scrutinizing the current market conditions to decide the future price direction. Nevertheless, the short-term oscillators indicate a bearish near-term bias.
Specifically, the RSI is dipping near the oversold zone, while the MACD histogram has crossed above its red signal line but remains in the negative territory.
Should selling interest intensify, the price could descend towards 27,950, which is the lower boundary of its recent rangebound pattern. Diving beneath that region, the 2022 low of 25,390 may act as a strong obstacle for the cryptocurrency. If that floor collapses, the spotlight could turn to the December 2022 resistance of 24,200.
Alternatively, bullish actions could propel the price towards the 31,400 hurdle. Conquering this barricade, the bulls might aim at the 40,000 psychological mark before 48,000 appears on the radar. Piercing through these levels, the December 2021 peak of 52,000 may cease any further advances.
Overall, BTCUSD seems to be consolidating between the 29,000-31,000 range, while near-term risks are tilted to the downside. Therefore, a break beneath the 25,390 floor could signal the resumption of its long-term downtrend.
US: Second Estimate of Q1 Growth Shows US Economy Having Contracted by 1.5%
According to the second estimate of real GDP, first quarter growth declined by 1.5% quarter-over-quarter (q/q, annualized). This was a slight downgrade from the -1.4% suggested in the advance estimate released last month. The reading came in slightly below the consensus forecast which called for a decline of 1.3%.
Consumer spending rose by 3.1%, up from the 2.7% suggested in the advance estimated. Spending on services (4.8%) were higher, while goods expenditures were flat in the first quarter. In terms of the composition of goods spending, gains in durables (6.8%) were completely offset by a pullback in non-durables (-3.7%). Revisions were positive for both services (previously reported at 4.4%) and durable expenditures (previously reported at 4.1%), while non-durables (previously reported at -2.5%) were revised lower.
Business investment rose 9.2%, unchanged from the advance estimate. Capital expenditures on equipment (13.2%) and intellectual property products (11.6%) accounted for all the gains, while investment in structures (-3.6%) continued to slide – now recording declines in each of the last four quarters. Revisions added to the gains in intellectual property products, while equipment and structures were both revised lower.
Residential investment was up a modest 0.4%, lower than what was previously reported at 2.1%.
Government spending (-2.7%) fell for the second consecutive quarter, as spending at both the federal (-6.1%) and state & local (-0.6%) levels were lower. In terms of federal spending, both defense (-8.5%) and non-defense (-2.6%) recorded declines last quarter.
Imports surged by 18.3% – up from the 17.7% previously reported. Gains were primarily concentrated in goods (20.9%), though imports of services (5.4%) were also higher. Meanwhile, exports fell by 5.4% as gains in service exports (3.6%) were more than offset by a pullback in the export of goods (-8.9%). This led to a significant widening in the trade deficit, resulting in net trade subtracting 3.2 percentage points (pp) from headline growth – unchanged from what was suggested in the advance estimate.
Inventory investment was revised lower, now subtracting 1.1pp (previously -0.8pp) from headline growth.
Key Implications
The second estimate of first quarter growth did nothing to remove the tarnish suggested by the advanced estimate released last month. Even after including a more complete source of data than are available at the time the first estimate was made, growth still registered a decline through the first three months of 2022. However, the details continue to show that underlying demand was far stronger than the headline suggests. Domestic demand rose by a healthy 2.7%, while the combination of weaker inventory investment and a widening trade deficit shaved 4.3 percentage points from headline growth.
While growth is expected to rebound above 2% in the second quarter, we do anticipate some cooling in demand in the latter half of the year. The combined effects of higher interest rates and eroding purchasing power emanating from the persistent inflationary pressures will start to exert a more meaningful drag on both consumer spending and business investment, pushing growth to a sub-trend pace towards year-end and into 2023. This will help to ease demand-side pressures in the economy, allowing inflation to move back towards the Fed's 2% target.
Canada: Motor Vehicle Sales Weigh on March Retail Spending
Retail sales were flat in March, well below Statistics Canada's preliminary estimate of a 1.4% gain. Making the story softer was the fact that volumes pulled back by 1.0% month-over-month (m/m).
Statistics Canada's flash estimate for April points to a 0.8% monthly gain, but note that consumer prices were also up significantly in the month.
Sales were down in 6 of 10 provinces, with notable declines in Quebec (-0.8% m/m), B.C. (-0.5%) and Saskatchewan (-1.6%). On the flipside, sales rose in Alberta (+1.8%) and Ontario (+0.3%).
Looking at the individual categories, receipts at gasoline stations jumped 7.4% m/m in March, with volumes up 3.1%. Meanwhile, sales at motor vehicle and parts dealers fell 6.4% - the largest drop since April 2020. On-going input shortages likely weighed on sales during the month. Notably, motor vehicles and parts dealers was the only category where sales declined during the month.
Core sales, which exclude autos and gasoline, were up a solid 1.5% m/m:
- Robust gains were recorded in building material and garden equipment suppliers (+3.7%), miscellaneous store retailers (+5.9%), and clothing and accessories stores (+2.2%).
- E-commerce sales declined 1.9% m/m in March and were down 24.6% year-over-year. They accounted for 4.9% of total retail trade.
Key Implications
Although retail spending came in well shy of the preliminary estimate, sales at motor vehicles and parts dealers were entirely responsible for the soft nominal print. In volume terms, the story was similar with spending up in nearly all categories. This narrowly based drop takes some of the sting of away from the report and points to a healthy job market and excess savings continuing to support goods spending outside of the auto sector – which is being plagued by input shortages.
We think consumer spending will hold up reasonably well in the second quarter, reflecting the lingering tailwind of easing public health restrictions, significant pent-up demand, and a healthy labour market. However, higher prices and interest rates will begin to weigh on household budgets in the second half of the year, prompting consumers to tighten their purse strings. Retail sales may also see some weakening as consumption continues to shift away from goods and toward services, such as travel and hospitality. Indeed, recent earnings reports from large retailers reflect some anticipated softness ahead due to inflation pressures and a substitution to services spending.
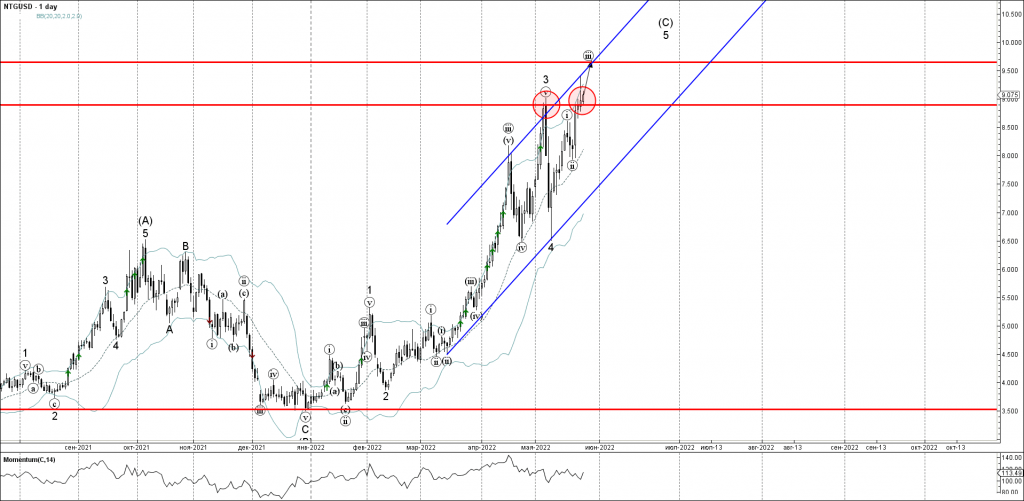
Natural Gas Wave Analysis
- Natural gas broke round resistance level 9.0000
- Likely to rise to resistance level 9.65
Natural gas recently broke above the round resistance level 9.0000 (which stopped the earlier minor impulse wave 3 at the start of May, as can be seen below).
The breakout of the resistance level 9.0000 continues the active short-term impulse wave 5 of the multi-month upward impulse wave (C) from December.
Given the strong daily uptrend, Natural gas can be expected to rise further toward the next resistance level 9.65 (target for the end of the active sub-impulse (iii)).
S&P 500 Wave Analysis
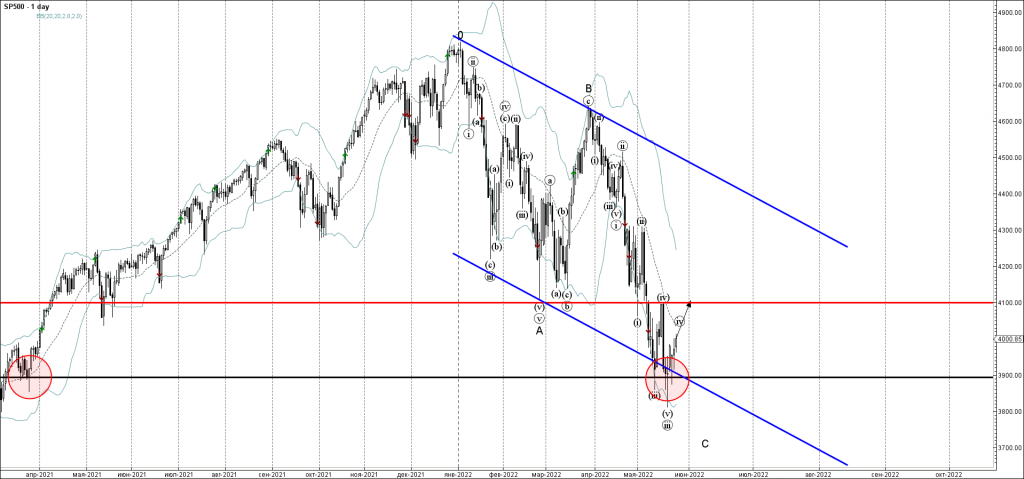
- S&P 500 rising inside wave (iv)
- Likely to reach resistance level 4100.00
S&P 500 index earlier reversed up from the key support level 3900.00, standing near the lower daily Bollinger Band and the support trendline of the daily down channel from January.
The upward reversal from the support level 3900.00 started the active short-term correction (iv).
S&P 500 index can be expected to rise further toward the next resistance level 4100.00 (top of the earlier minor correction (iv)).
GBPAUD Wave Analysis
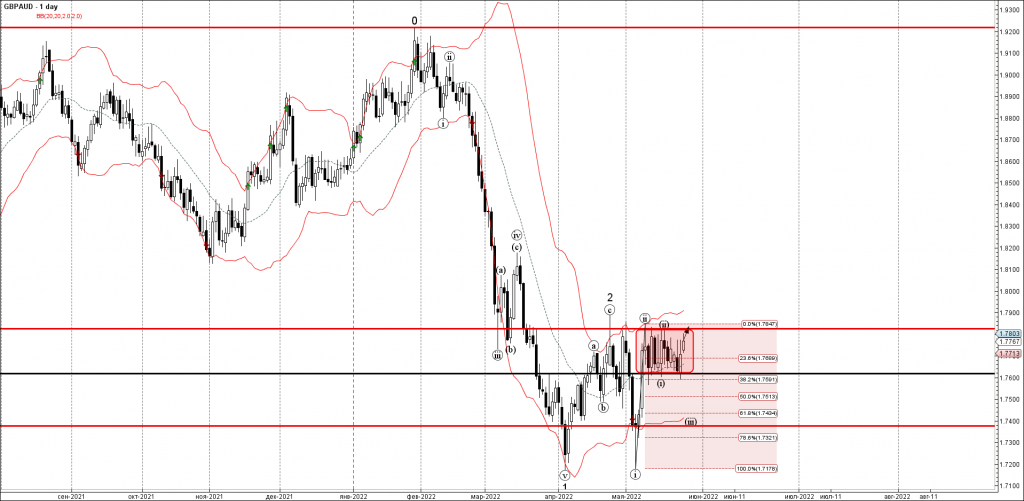
- GBPAUD reversed from support level 1.7620
- Likely to rise to resistance level 1.7825
GBPAUD recently reversed up from the support level 1.7620, which is the lower boundary of the tight sideways price range inside which the pair has been moving from the start of May.
The support level 1.7620 was further strengthened by the 20-day moving average and by the 38.2% Fibonacci correction of the earlier upward correction (ii).
GBPAUD can be expected to rise further toward the next resistance level 1.7825 (upper boundary of the active sideways price range).
EUR/USD Daily Outlook
Daily Pivots: (S1) 1.0633; (P) 1.0688 (R1) 1.0732; More...
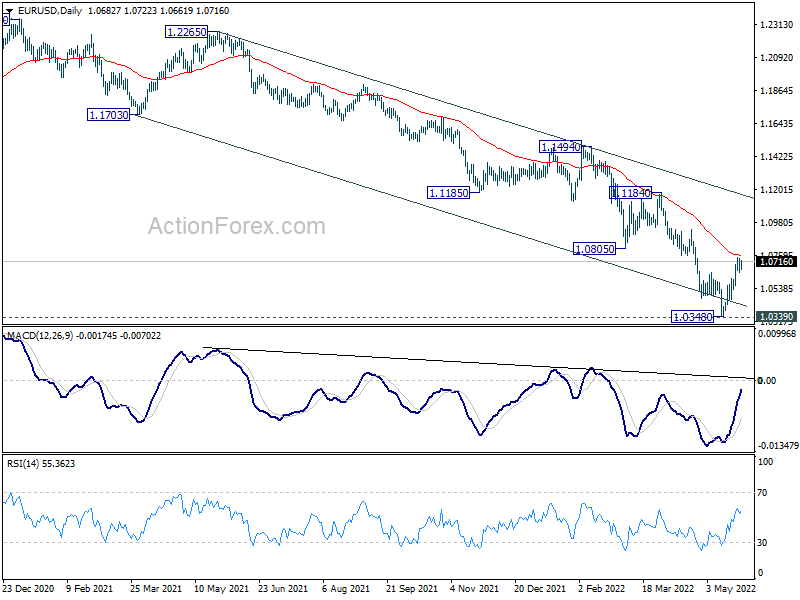
Intraday bias in EUR/USD stays neutral at this point. Another rise is still mildly in favor with 1.0563 minor support intact. Above 1.0748 will resume the rebound from 1.0348. Firm break of 55 day EMA (now at 1.0757) will target 1.0935 resistance next. However, below 1.0563 minor support will turn intraday bias back to the downside for retesting 1.0348 low instead.
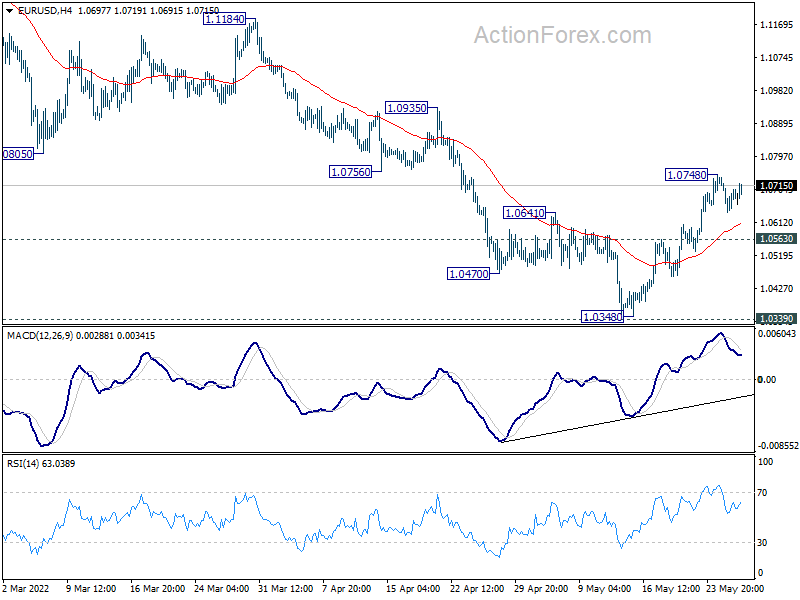
In the bigger picture, focus stays on 1.0339 long term support (2017 low). Decisive break there will resume whole down trend from 1.6039 (2008 high). Next target is 61.8% projection of 1.3993 to 1.0339 from 1.2348 at 1.0090. However, firm break of 1.0805 support turned resistance will delay this bearish case and bring medium term corrective rebound first.
GBP/USD Mid-Day Outlook
Daily Pivots: (S1) 1.2510; (P) 1.2551; (R1) 1.2620; More..
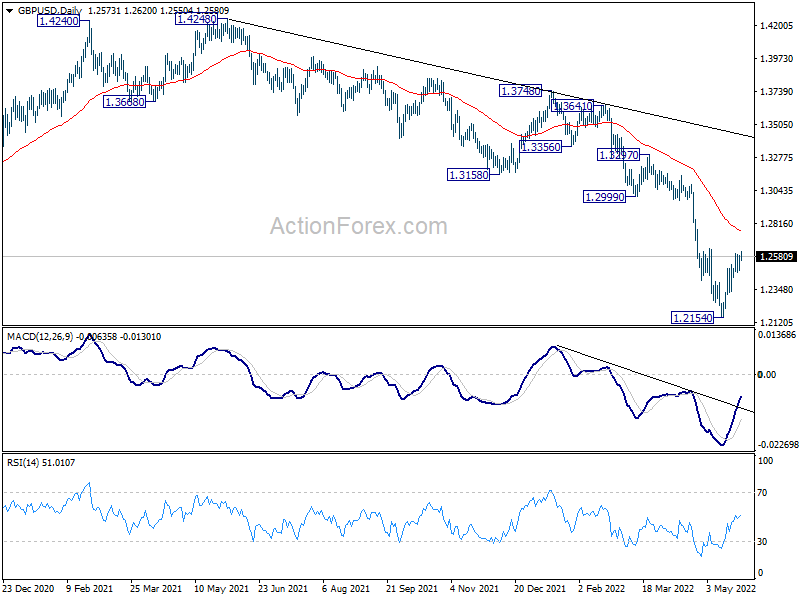
Intraday bias in GBP/USD remains neutral for the moment. On the upside, firm break of 1.2637 resistance will bring stronger rebound to 55 day EMA (now at 1.2759). On the downside, below 1.2329 minor support will retain near term bearishness and bring retest of 1.2154 first. Break there will resume larger down trend from 1.4248.
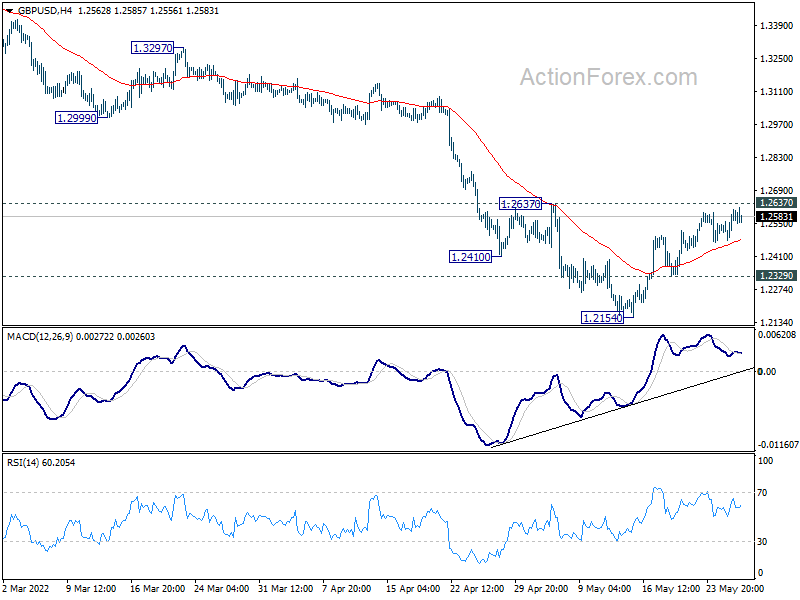
In the bigger picture, based on current momentum, fall from 1.4248 (2018 high) at least at the same degree as the rise from 1.1409 (2020 low). That is, fall from 1.4248 could be a leg inside the pattern from 1.1409, or resuming the longer term down trend. In either case, deeper decline is expected as long as 1.2999 support turned resistance holds. Next target is 1.1409 low.