

Sample Category Title
USD/CHF Mid-Day Outlook
Daily Pivots: (S1) 0.9675; (P) 0.9763; (R1) 0.9808; More....
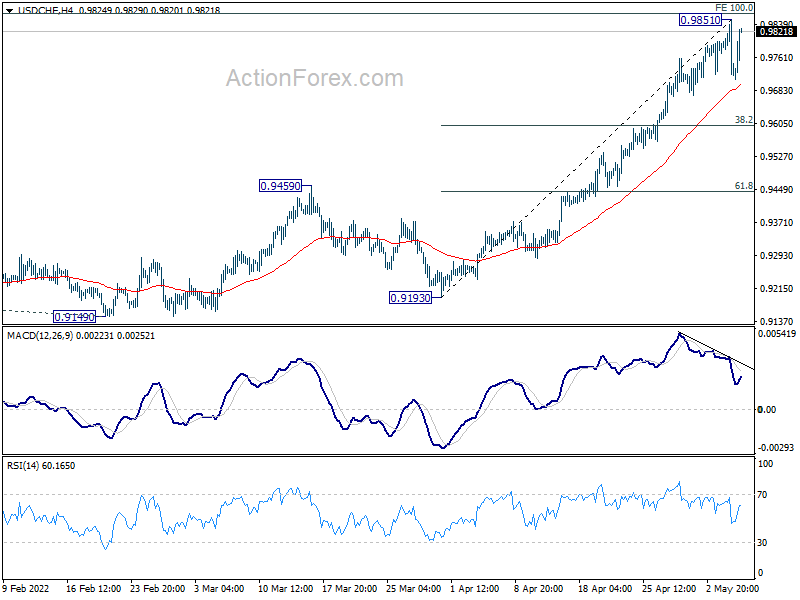
Intraday bias in USD/CHF remains neutral for consolidation below 0.9851. In case of another fall, downside should be contained by 38.2% retracement of 0.9193 to 0.9851 at 0.9600. On the upside, firm break of 0.9851 will bring up trend resumption.
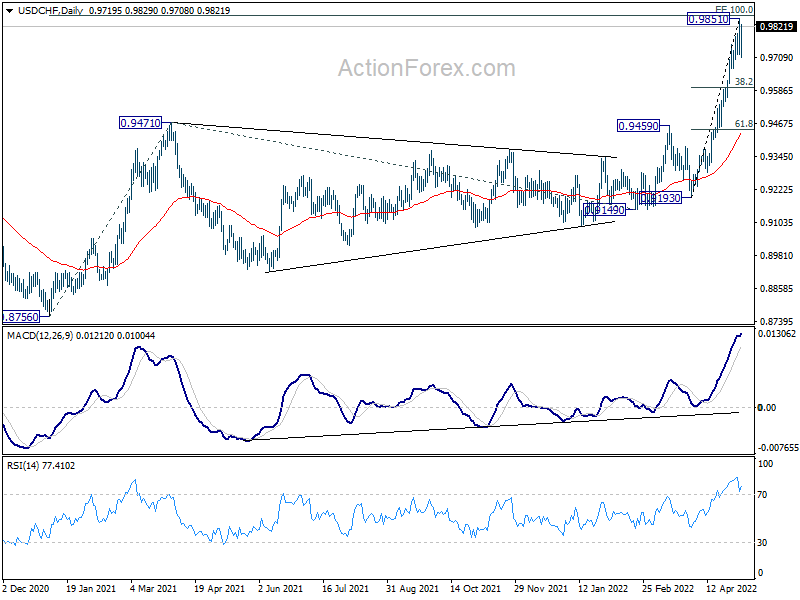
In the bigger picture, down trend from 1.0342 (2016 high) should have completed with three waves down to 0.8756 (2021 low) already. Rise from 0.8756 is likely a medium term up trend of its own. Next target is 100% projection of 0.8756 to 0.9471 from 0.9149 at 0.9864. Sustained break there will pave the way back to 1.0342 high. This will now remain the favored case as long as 0.9459 resistance turned support holds.
EUR/USD Mid-Day Outlook
Daily Pivots: (S1) 1.0544; (P) 1.0587 (R1) 1.0669; More...
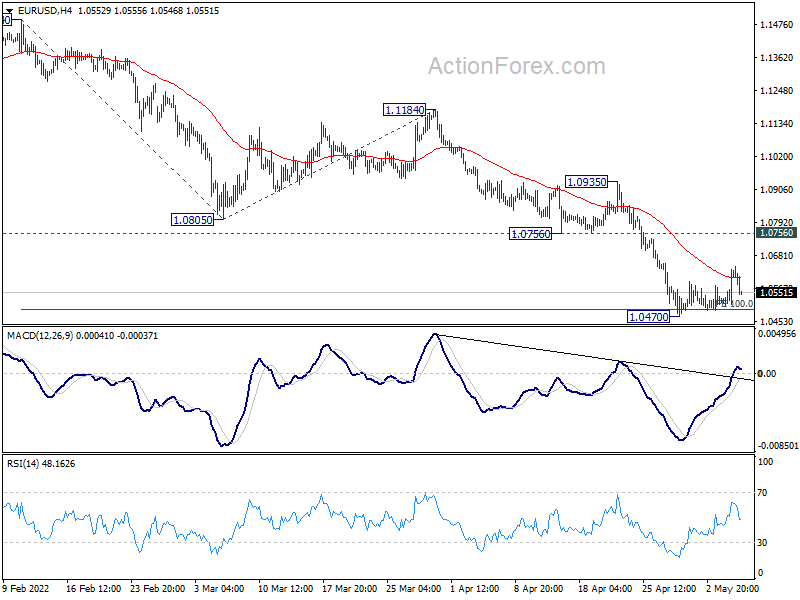
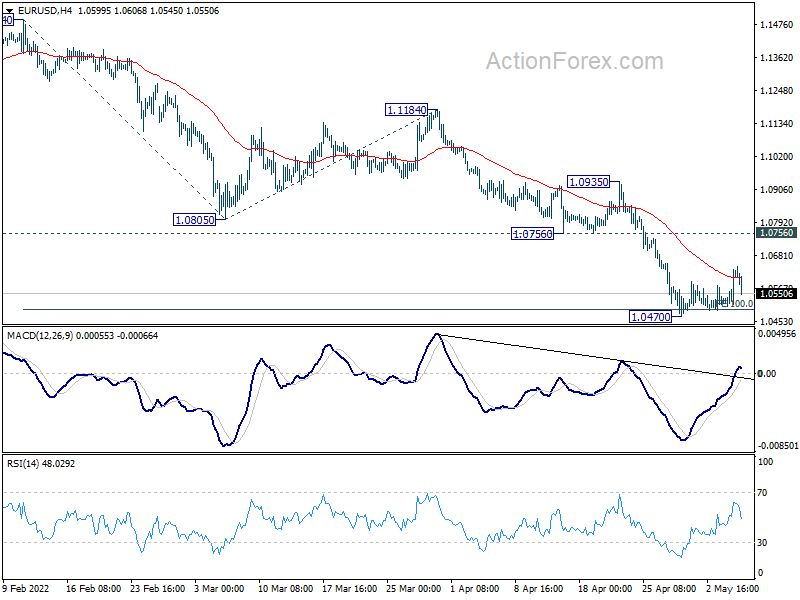
EUR/USD is still bounded in consolidation from 1.0470 and intraday bias remains neutral. Another recovery could still be seen. But upside should be limited by 1.0756 support turned resistance to bring fall resumption. Break of 1.0470 will resume larger down trend and target 161.8% projection of 1.1494 to 1.0805 from 1.1184 at 1.0069.
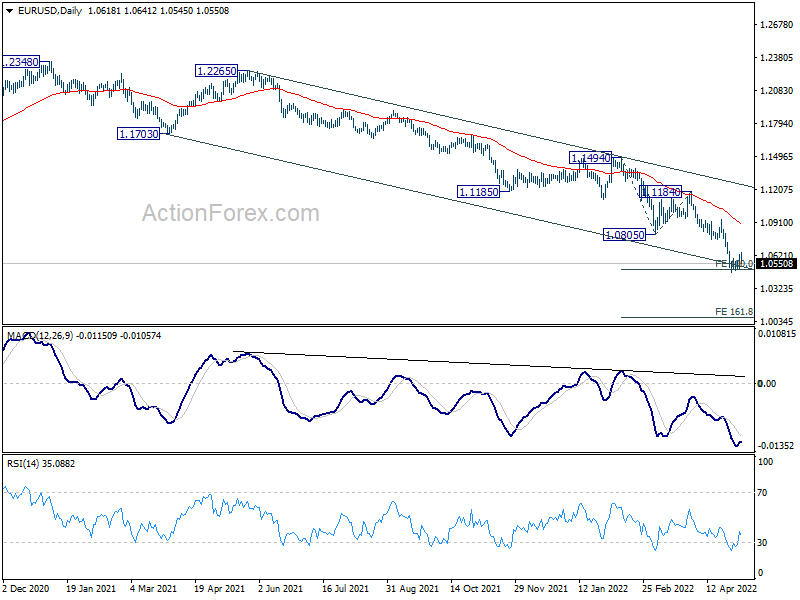
In the bigger picture, the decline from 1.2348 (2021 high) is expected to continue as long as 1.1185 support turned resistance holds. The break of 1.0635 (2020 low) now raises the chance that it's resuming long term down trend from 1.6039 (2008 high). Retest of 1.0339 (2017 low) low should be seen next. Decisive break there will confirm this bearish case.
GBP/USD Mid-Day Outlook
Daily Pivots: (S1) 1.2513; (P) 1.2575; (R1) 1.2699; More...
GBP/USD's down trend resumes by breaking through 1.2410 support. Intraday bias is back on the downside for 161.8% projection of 1.3641 to 1.2999 from 1.3297 at 1.2258. Break will target 200% projection at 1.2013 next. On the upside, break of 1.2637 resistance is needed to indicate short term bottoming. Otherwise, outlook will remain bearish in case of recovery.
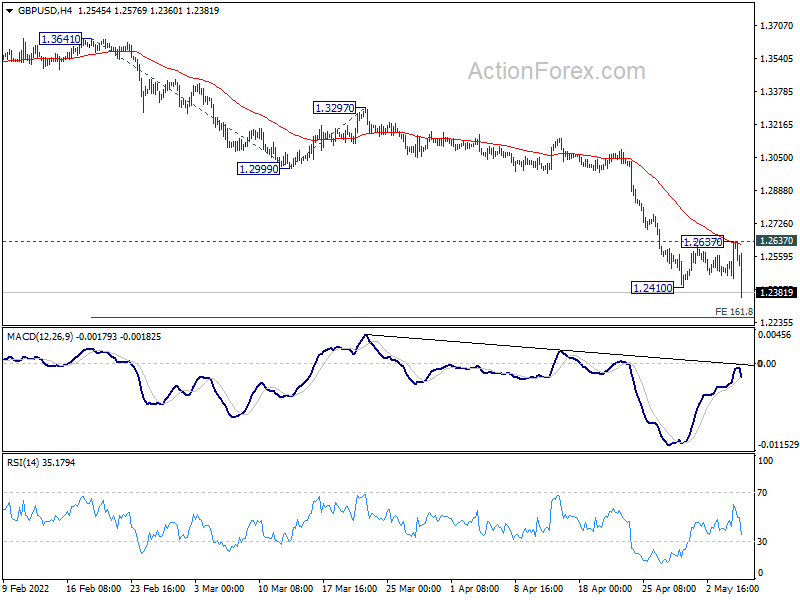
In the bigger picture, rise from 1.1409 (2020 low) has completed at 1.4248, ahead of 1.4376 long term resistance (2018 high). Based on current momentum, fall from 1.4248 is probably the start of a long term down trend. The break of 61.8% retracement of 2.1161 to 1.1409 at 1.2493 is affirming this bearish case too. For now, deeper decline would be seen as long as 1.3158 support turned resistance holds. Next target is 1.1409 low.

Sterling Collapses after Dovish BoE Hike, Dollar Regains Ground
Sterling drops sharply today even after BoE raised interest rate as expected. The trigger was the warning that of recession as high inflation hurts real incomes of household and profits of businesses. Aussie and Kiwi are also trading lower as yesterday's risk-on rally fades. Dollar, on the other hand, is regaining some of the post FOMC losses. As for the week, though, Sterling is the worst so far, followed by Franc. Aussie is still the strongest, followed by Loonie.
Technically, the development in Sterling is rather bad, with GBP/USD breaking through 1.2410 support to resume medium term down trend. EUR/GBP's strong break of 0.8511 resistance reaffirms that it's in medium term rebound. A focus now is indeed on whether Euro will also follow. Hence, attention will be back on 1.0470 support in EUR/USD.
In Europe, at the time of writing, FTSE is up 1.58%. DAX is up 1.56%. CAC is up 1.90%. Germany 10-year yield is down -0.0045 at 0.928. Earlier in Asia, Japan was on holiday. Hong Kong HSI dropped -0.36%. China Shanghai SSE rose 0.68%. Singapore Strait Times dropped -0.17%.
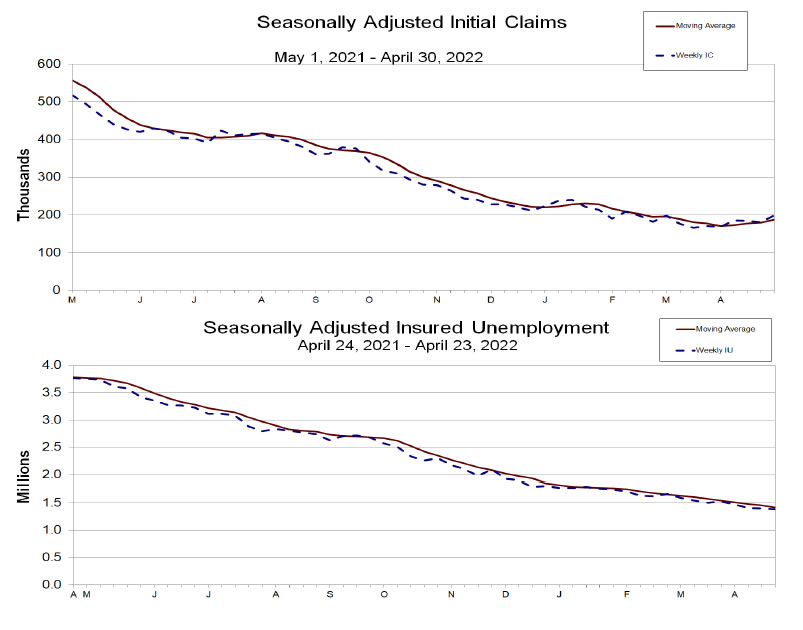
US initial jobless claims rose to 176k, continuing claims dropped to 1.384m
US initial jobless claims rose 19k in the week ending April 30, above expectation of 176k. Four-week moving average of initial claims rose 8k to 188k.
Continuing claims dropped -19k to 1384k in the week ending April 23, lowest since January 17, 1970. Four-week moving average of continuing claims dropped -36k to 1417k, lowest since February 21, 1970.
BoE hikes by 25bps, three MPC members wanted 50bps
BoE raises Bank Rate by 25bps to 1.00% as widely expected. The decision was made by 6-3 vote, with three members voted for 50bps hike, including Jonathan Haskel, Catherine Mann and Michael Saunders.
In the accompany statement, BoE reaffirmed its preference that the Bank Rate will be used as the active policy tool in adjusting monetary policy stance. It will "consider" beginning the process of selling the assets purchased., but the decision will depend on economic circumstances. The strategy on offloading the assets will be provided at the August meeting.
BoE also updated the economic projections conditions on a market-implied path for Bank Rate that rises to around 2.50% by mid-2023, before falling to 2.00% at the end of the forecast period. CPI is expected to rise further over the remainder of the year, averaging slightly over 10% at its peak in 2022 Q4, then falls back to 2% target in around two years. GDP is projected to fall in 2022 Q4 and calendar year GDP growth is broadly flat in 2023.
UK PMI services finalized at 58.9, twin headwinds of costs and war
UK PMI Services was finalized at 58.9 in April, down from March's 62.6. S&P Global noted that input cost inflation hit fresh record high. Activity and new business continued to rise, but a reduced rates. Business confidence was lowest in a year-and-a-half. PMI Composite was finalized at 58.2, down from March's 60.9.
Andrew Harker, Economics Director at S&P Global: "The twin headwinds of the cost of living crisis and the war in Ukraine started to bite on the UK service sector during April, as evidenced by a sharp slowdown in new order growth to the lowest in the year so far. Worryingly, companies seem to be expecting impacts to be prolonged, with business confidence dropping to the lowest in a year-and-a-half."
ECB Lane: Gradualism is an important consideration in thinking about normalization
ECB Chief Economist Philip Lane said in a speech, "in thinking about the normalization process, gradualism is an important consideration." There are two basic reasons that make the timeline of completing normalization "intrinsically uncertain".
Firstly, "the feedback loop between various steps in the policy normalisation process and inflation dynamics needs to be incorporated into the monetary policy decision process".
Secondly, "high uncertainty about the economic impact of the war in Ukraine, the energy shock and the post-pandemic recovery suggests that it is unlikely that the economy will quickly settle into a new steady-state equilibrium."
Lane reiterated that the calibration of policies will "will remain data-dependent and reflect our evolving assessment of the outlook".
Released in European session, Germany factory orders dropped -4.7% in March versus expectation of -0.5%. France industrial output dropped -0.5% mom in March versus expectation of 0.0% mom. Swiss CPI came in at 0.4% mom, 2.5% yoy in April, versus expectation of 0.2% mom, 2.5% yoy.
China Caixin PMI services dropped to 36.2 in Apr, PMI composite down to 37.2
China Caixin PMI Services dropped from 42.0 to 36.2 in April, below expectation of 40.9. That's the second straight month of steep decline, and the worst reading since February 2020. Caixin said decline in new business gathered pace but employment fell only slightly. PMI Composite dropped from 43.9 to 37.2, also the worst since the onset of the pandemic.
Wang Zhe, Senior Economist at Caixin Insight Group said: "Overall, in April, local Covid outbreaks continued and activity in the manufacturing and service sectors continued to contract, with services shrinking more. Demand was under pressure, external demand deteriorated, supply shrank, supply chains were disrupted, delivery times were prolonged, backlogs of work grew, workers found it difficult to return to their jobs, inflationary pressures lingered, and market confidence remained below the long-term average."
GBP/USD Mid-Day Outlook
Daily Pivots: (S1) 1.2513; (P) 1.2575; (R1) 1.2699; More...
GBP/USD's down trend resumes by breaking through 1.2410 support. Intraday bias is back on the downside for 161.8% projection of 1.3641 to 1.2999 from 1.3297 at 1.2258. Break will target 200% projection at 1.2013 next. On the upside, break of 1.2637 resistance is needed to indicate short term bottoming. Otherwise, outlook will remain bearish in case of recovery.
In the bigger picture, rise from 1.1409 (2020 low) has completed at 1.4248, ahead of 1.4376 long term resistance (2018 high). Based on current momentum, fall from 1.4248 is probably the start of a long term down trend. The break of 61.8% retracement of 2.1161 to 1.1409 at 1.2493 is affirming this bearish case too. For now, deeper decline would be seen as long as 1.3158 support turned resistance holds. Next target is 1.1409 low.
Economic Indicators Update
| GMT | Ccy | Events | Actual | Forecast | Previous | Revised |
|---|---|---|---|---|---|---|
| 01:30 | AUD | Building Permits M/M Mar | -18.50% | -12.00% | 43.50% | 42.00% |
| 01:30 | AUD | Trade Balance (AUD) Mar | 9.31B | 7.80B | 7.46B | 7.44B |
| 01:45 | CNY | Caixin Services PMI Apr | 36.2 | 40.9 | 42 | |
| 06:00 | EUR | Germany Factory Orders Mar | -4.70% | -0.50% | -2.20% | -0.80% |
| 06:30 | CHF | CPI M/M Apr | 0.40% | 0.20% | 0.60% | |
| 06:30 | CHF | CPI Y/Y Apr | 2.50% | 2.50% | 2.40% | |
| 06:45 | EUR | France Industrial Output M/M Mar | -0.50% | 0.00% | -0.90% | |
| 08:30 | GBP | Services PMI Apr F | 58.9 | 58.3 | 58.3 | |
| 11:00 | GBP | BoE Interest Rate Decision | 1.00% | 1.00% | 0.75% | |
| 11:00 | GBP | MPC Official Bank Rate Votes | 9--0--0 | 8--0--1 | 8--0--1 | |
| 11:30 | USD | Challenger Job Cuts Y/Y Apr | 6.00% | -30.10% | ||
| 12:30 | USD | Initial Jobless Claims (Apr 29) | 200K | 176K | 180K | 181K |
| 12:30 | USD | Nonfarm Productivity Q1 P | -7.50% | -5.10% | 6.60% | |
| 12:30 | USD | Unit Labor Costs Q1 P | 11.60% | 7.40% | 0.90% | |
| 14:30 | USD | Natural Gas Storage | 69B | 40B |
US initial jobless claims rose to 176k, continuing claims dropped to 1.384m
US initial jobless claims rose 19k in the week ending April 30, above expectation of 176k. Four-week moving average of initial claims rose 8k to 188k.
Continuing claims dropped -19k to 1384k in the week ending April 23, lowest since January 17, 1970. Four-week moving average of continuing claims dropped -36k to 1417k, lowest since February 21, 1970.
USDCHF Bullish Bias Intact Despite Pullback to 23.6% Fibonacci
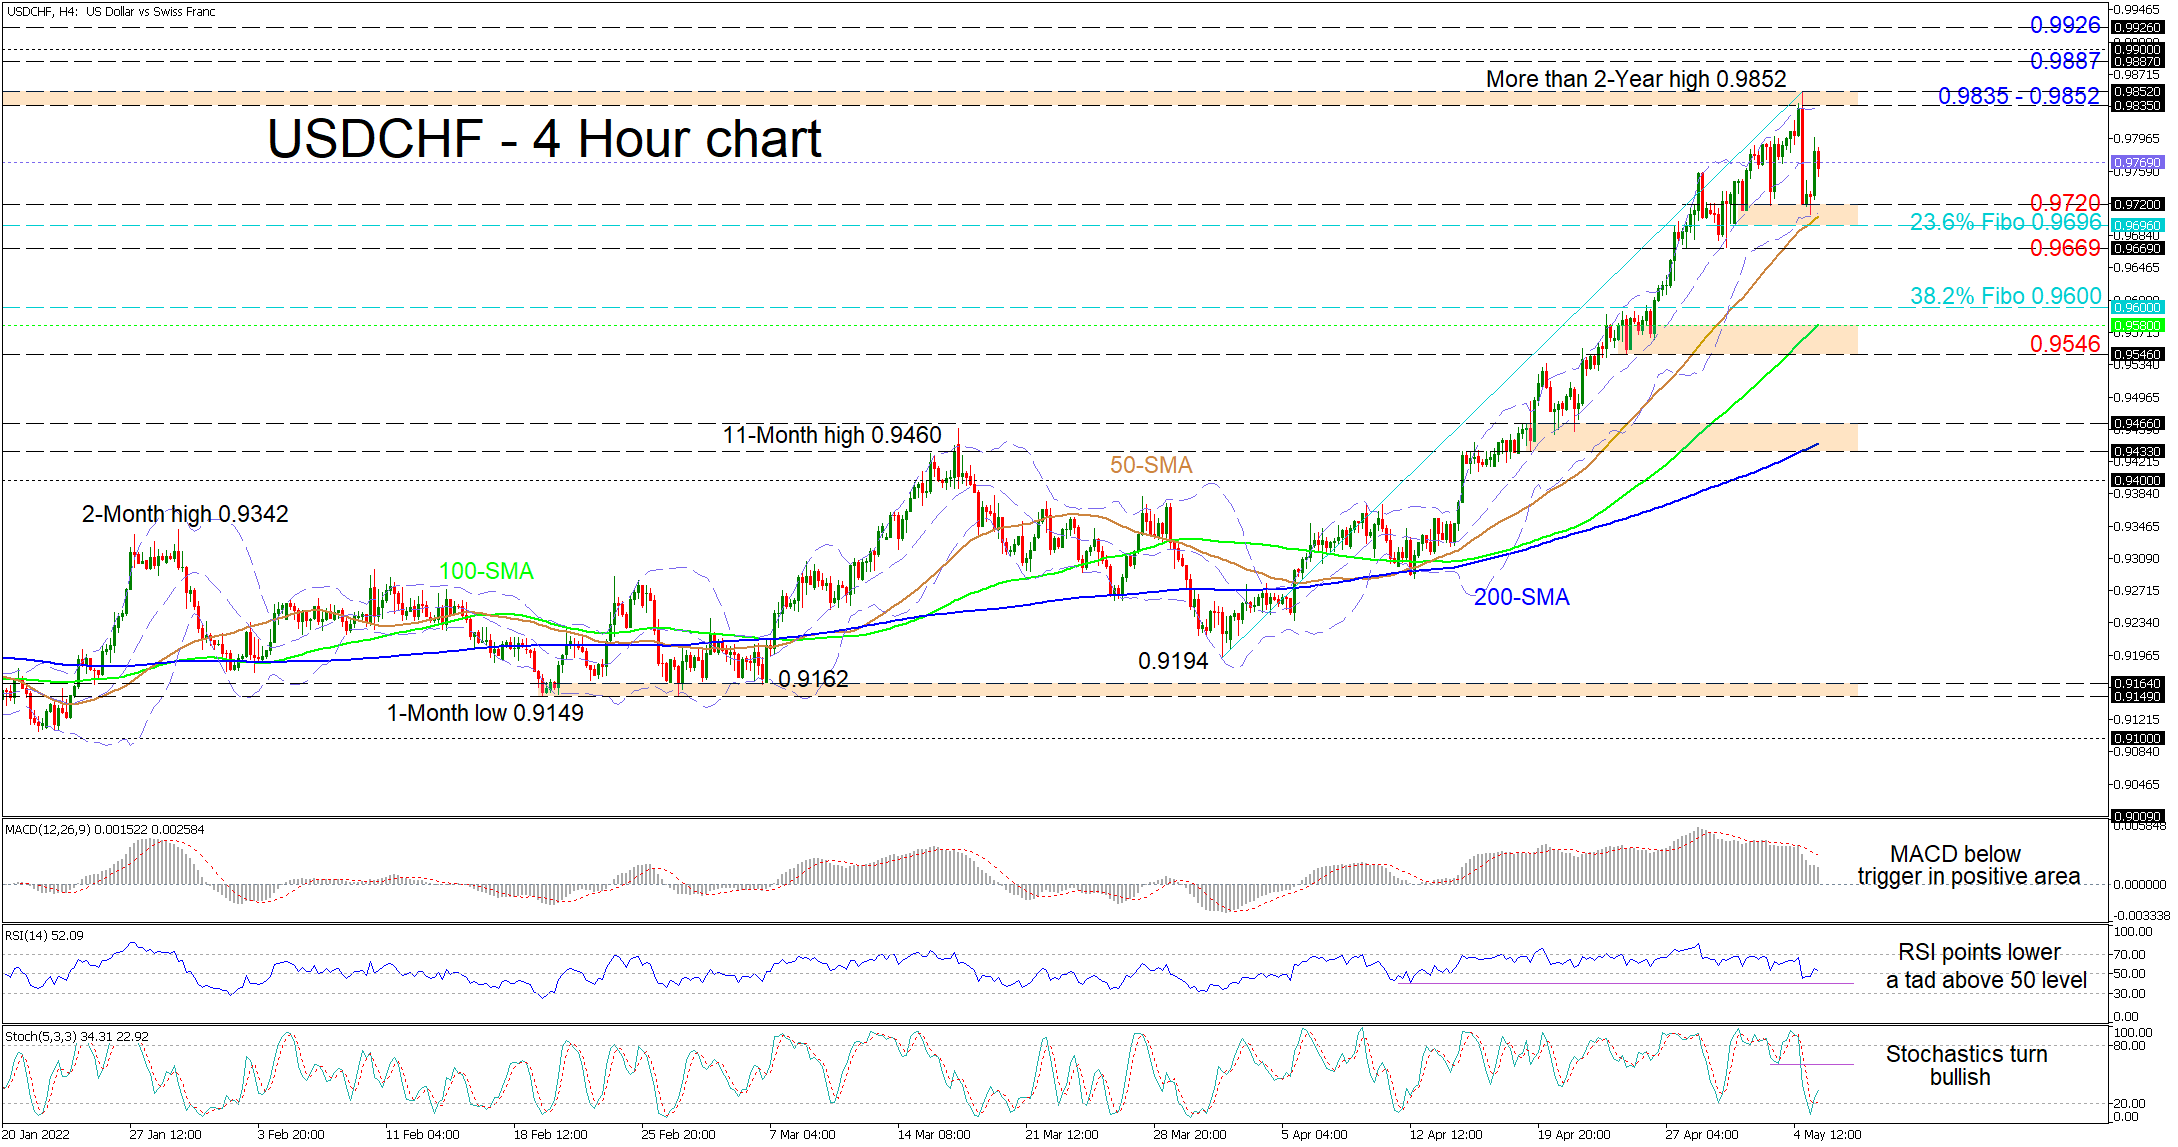
USDCHF has bounced toward the mid-Bollinger band after testing the 50-period simple moving average (SMA) currently around the 0.9700 mark. The soaring simple moving averages (SMAs) are defending the more than one-month uptrend in the pair despite the retreat in the pair that came short of the 0.9696 level, which is the 23.6% Fibonacci retracement of the up leg from 0.9194 until 0.9852.
The short-term oscillators are indicating conflicting messages in directional momentum. The MACD, in the positive region, has detached from its red trigger line and is heading towards the zero line, while the stochastic oscillator continues to promote upside impetus in the pair. Meanwhile, the RSI, in bullish territory, is directing lower and is about to flirt with the 50 threshold.
As things stand, for negative pressures to gain an advantage, an increase in selling interest from the mid-Bollinger band would need to overwhelm the 0.9696-0.9720 critical support section, the former being the 23.6% Fibo and the latter the recent troughs. A successful break of this fortified base, which includes the lower Bollinger band and the ascending 50-period SMA, could intensify downside forces with the bears promptly testing the April 29 low of 0.9669. Should a deeper correction unfold, the sellers may then aim for the 38.2% Fibo of 0.9600 before challenging the support region linking the 100-period SMA at 0.9580 and the 0.9546 trough.
However, if the pair lifts back above the mid-Bollinger band at 0.9769, the bulls could then eye the upper Bollinger band and adjoining 0.9835-0.9852 resistance band that stretches back more than two-years. Rekindling the uptrend, buyers may attempt to reel in the 0.9887 and the 0.9900 resistance barriers, recorded back in March 2020. If buying interest persists, the pair could then seek out the December 2019 high of 0.9926.
Summarizing, USDCHF is sustaining a bullish bias above the 0.9696-0.9720 support foundation, the SMAs and the 0.9669 trough. That said, a retracement past the 0.9600 handle could weigh on the 0.9546-0.9580 support, throwing some doubt about the resilience of the uptrend.
AUDUSD Posts Losses after Impressive Bullish Day the Day Before
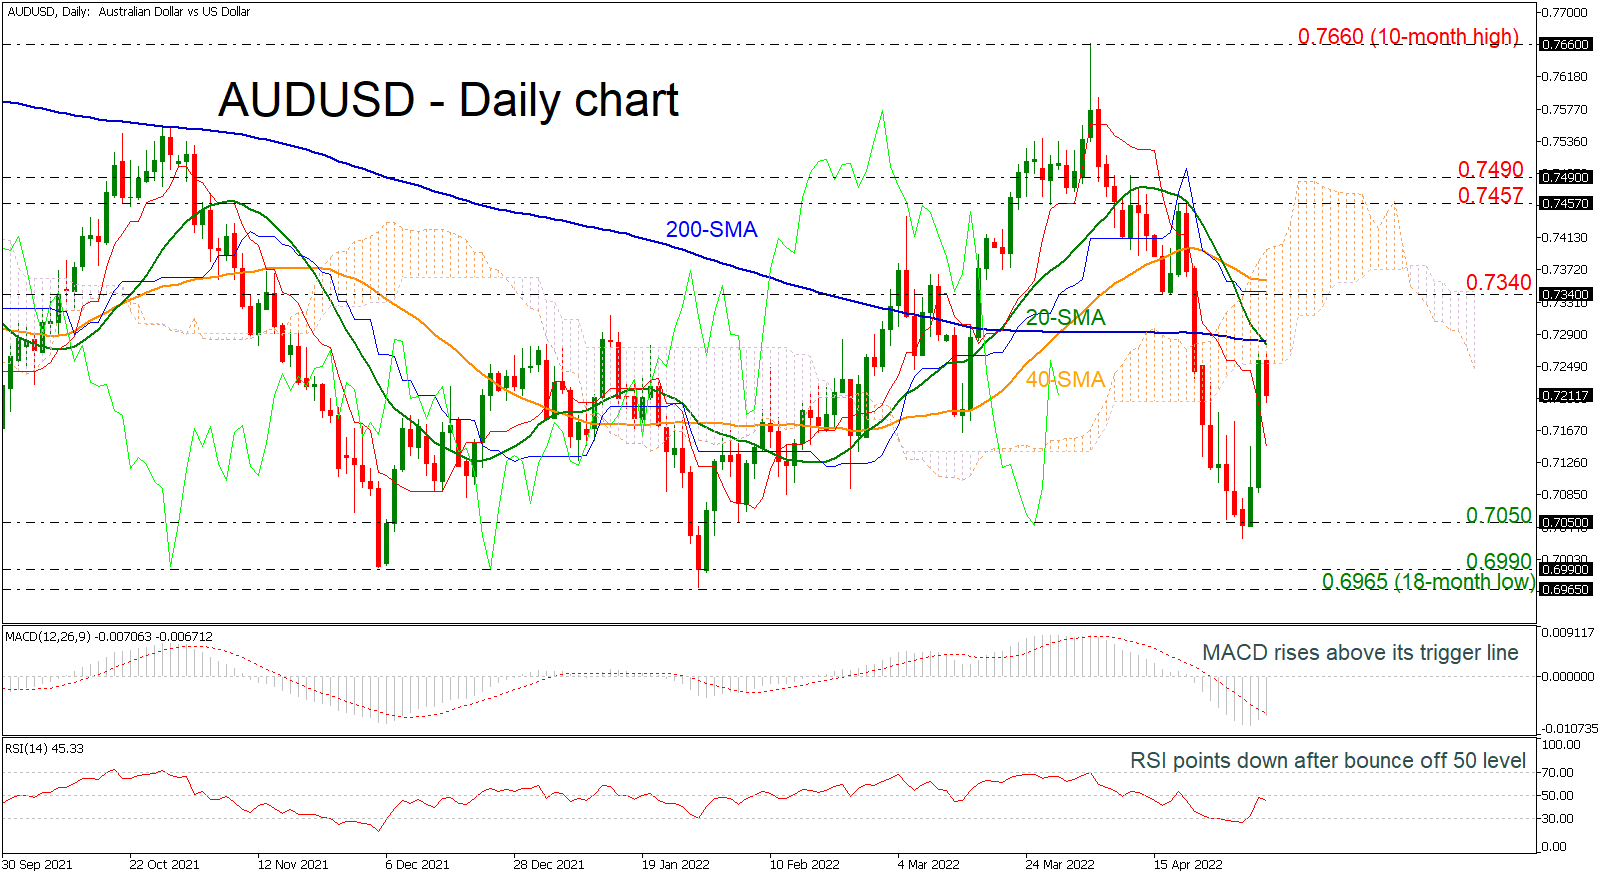
AUDUSD is extending today’s losses and is currently trading below the two-week high of 0.7265 hit on Wednesday.
The RSI turned lower after the pullback off the 50 level. At the moment, it continues to head lower in support of a negative short-term picture. However, the MACD oscillator is climbing above its trigger line, remaining in the negative region. The 20-day simple moving average (SMA) is crossing the 200-day SMA to the downside, indicating more losses.
Further declines may meet support around the 0.7050 level, this being a congested area between early February to early May that also halted declines. Not far below, support could occur around the 0.6990 barrier and the 18-month low of 0.6965.
On the upside, resistance could come around the bearish crossover of the SMAs at 0.7280. Higher still, the 0.7340 level would increasingly come into scope and not far above this point lies the 40-day SMA at 0.7360.
The medium-term picture continues to look predominantly bearish, with trading activity taking place below the SMAs.
EUR/USD: Life after the May FOMC
The Fed raised interest rates by 50 bps and announced the start of QT on Wednesday as largely expected. Less anticipated were Fed Chair Powell’s comments discounting the near-term prospects of hikes greater than 50 bps at future meetings. US 2yr and 10yr yields fell as a result and EUR/USD eventually rose to an eventual high of 1.06420 in early morning trading before pairing back some of its gains. How does this shift in Fed calculus change the prospects for the euro?
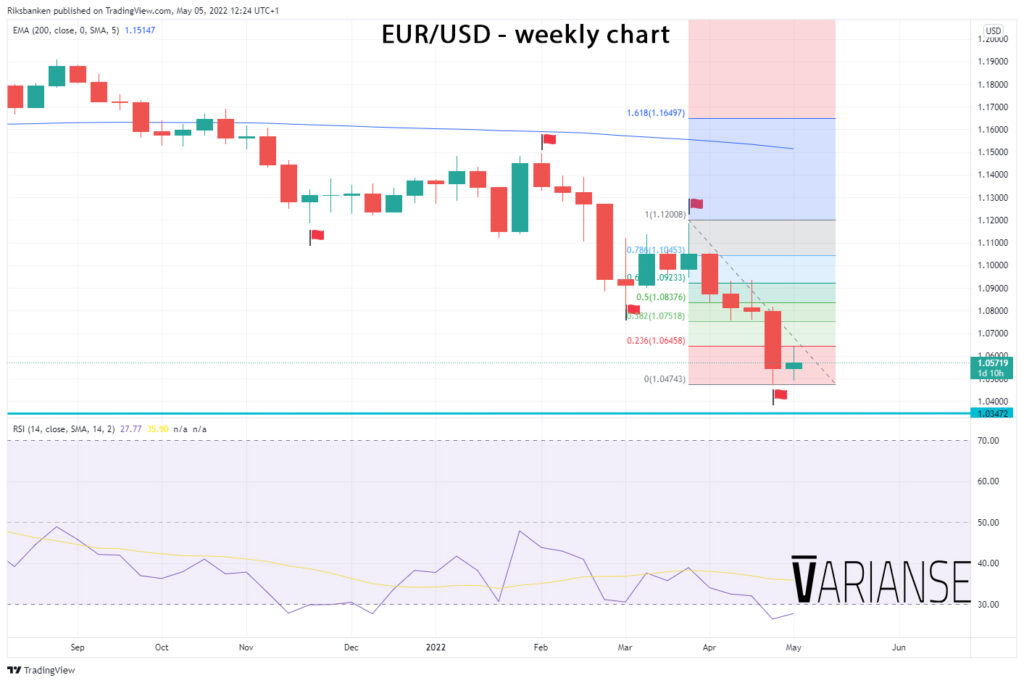
From a technical perspective, one could argue by not much for the time being. EUR/USD, viewed on a weekly timeframe, is still very much locked in a downtrend with scope for an orderly retracement. More precisely, a sustained break above the last March swing high of 1.11849 would be required to signal an uptrend shift in price. Until then, swing traders are likely to be eyeing the 50% Fibonacci level of 1.08376 and 61.8% of 1.09233 as areas of resistance before considering potential for a bigger reversal.
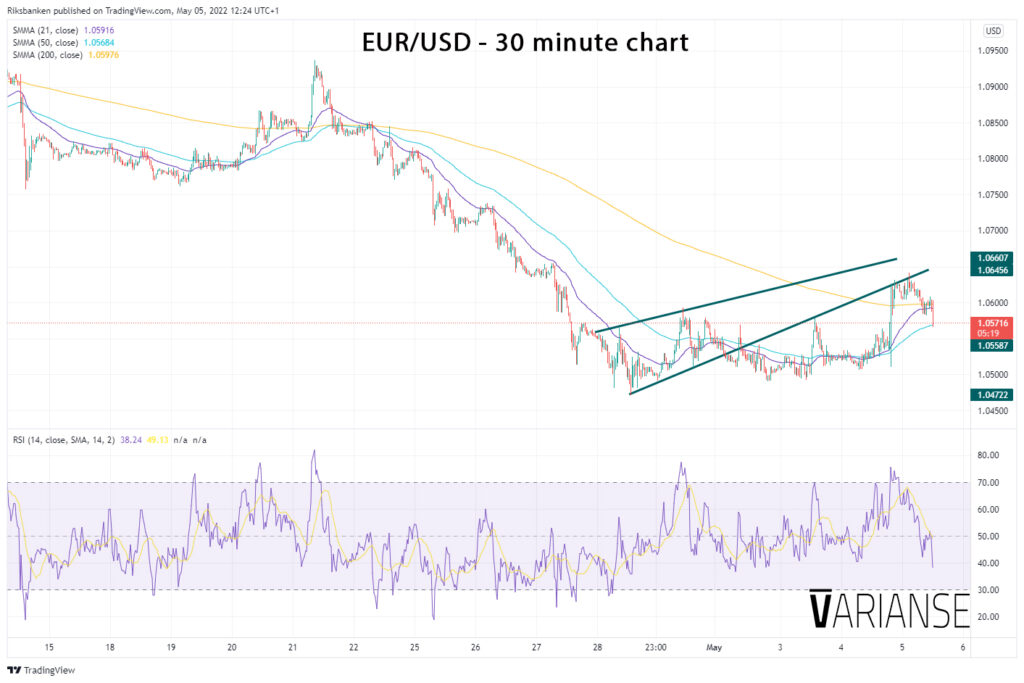
Price action on lower time frames also suggest a bit of caution about the potential for substantial EUR/USD gains. In particular, the thirty-minute timeframe points to a rejection of the lower bound of the prior broken rising wedge, which suggests that buyer’s ability to push price higher at this junction may be limited. Eyes are now on whether the 3 May swing high of 1.05776 now turned support holds for confirmation of direction. That said, it may take a fall below the 1.05216 level, which represents the prior closing price of the break of the wedge pattern, to really entice sellers in a big way.
Euro Slips after Soft German Data
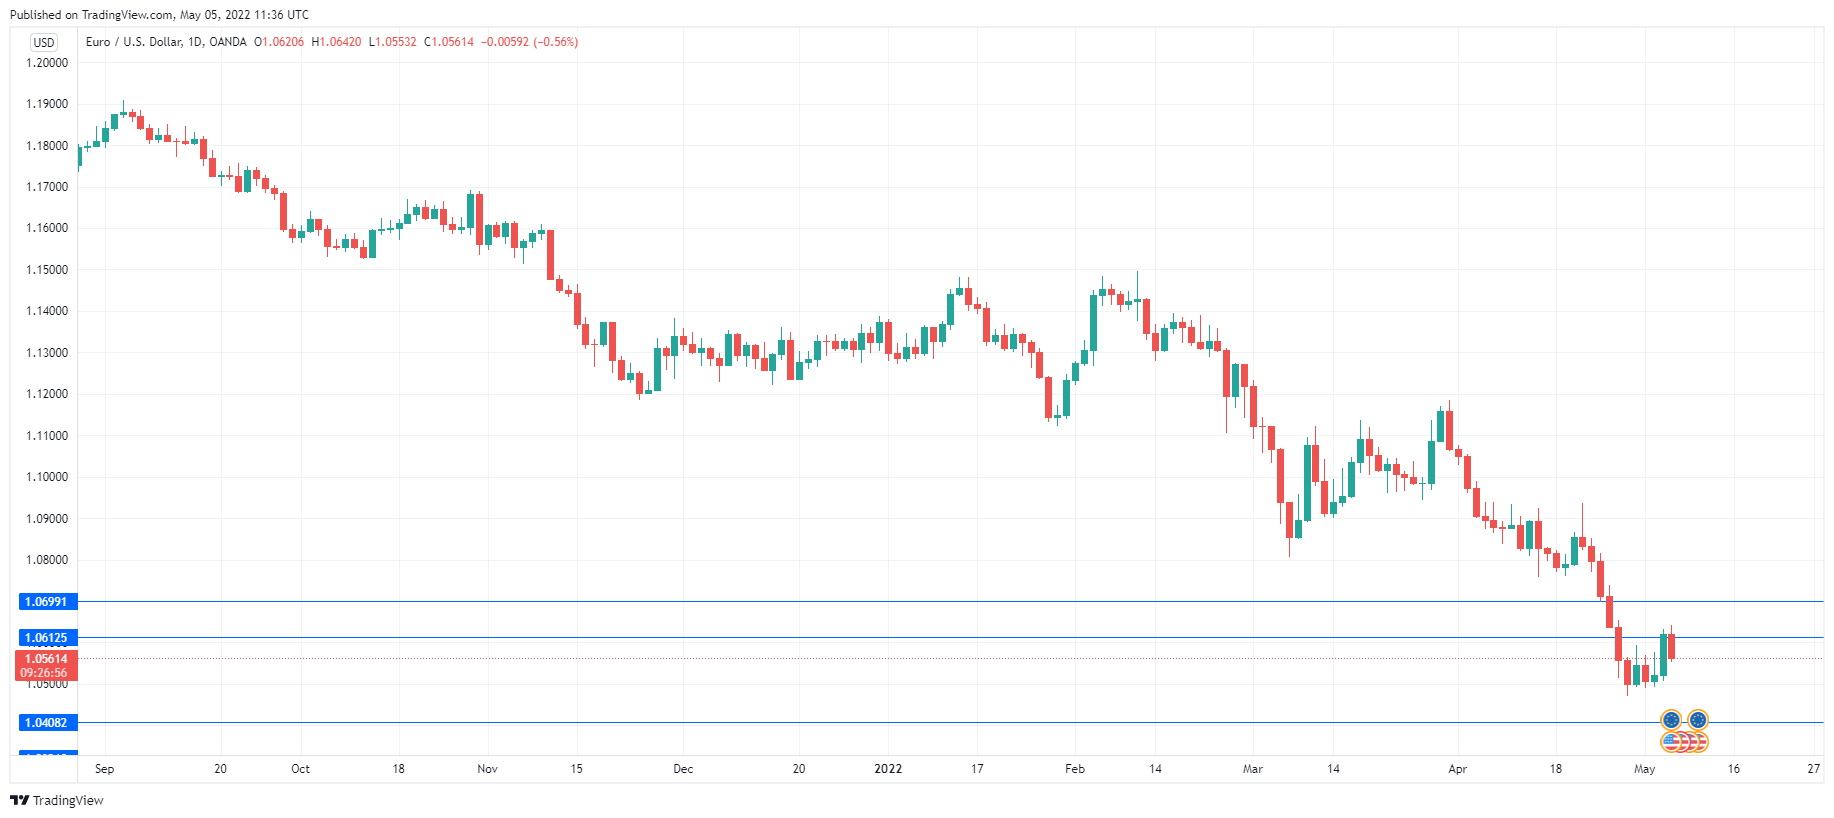
The euro is under pressure and is trading at 1.0557, down 0.58% on the day. This follows a spectacular session on Wednesday, when EUR/USD jumped 0.94%, its best one-day showing since March.
German Factory Orders slide
German factory orders plunged 4.7% MoM in March, after a decline of 0.8% in February. The sharp drop caught the markets off guard, as the consensus estimate stood at -1.1%. The weak release reflects ongoing difficulties for the manufacturing sector, which is grappling with supply chain disruptions and higher costs. The harsh Covid lockdowns in China are likely to exacerbate the situation, as almost half of German companies rely on imports from China, according to an Ifo survey.
Germany’s economy will have another headache to deal with, as the EU has confirmed that it will terminate all imports of Russian oil by the end of the year. Germany had originally opposed this move, since it imports 25% of its oil requirements from Russia. The German government is now saying that it can manage without Russian oil, but it’s clear that the move will boost inflation, dampen growth and could even push the economy into a recession.
There were no surprises from the Federal Reserve meeting, as the central bank raised rates by a half-point, the largest increase in 20 years. The Fed signalled that it will deliver additional half-point hikes in June and July, with Fed Chair Powell stating that the FOMC was not “actively considering” a 0.75% increase. This news sent the US dollar broadly lower, although I expect the greenback to resume its upswing without much difficulty.
The Fed is also implementing quantitative tightening with a reduction in the balance sheet. Starting in June, the Fed will sell USD 45 billion/mth in assets, which will climb to USD 95 billion/mth in September. The financial markets reacted positively to the Fed’s moves, as investors believe that the Fed’s rate hikes can curb inflation while ensuring a soft landing for the economy and avoiding a recession.
EUR/USD Technical
- There is resistance at 1.0612 and 1.0699
- 1.0408 is providing support, followed by 1.0321
BoE hikes by 25bps, three MPC members wanted 50bps
BoE raises Bank Rate by 25bps to 1.00% as widely expected. The decision was made by 6-3 vote, with three members voted for 50bps hike, including Jonathan Haskel, Catherine Mann and Michael Saunders.
In the accompany statement, BoE reaffirmed its preference that the Bank Rate will be used as the active policy tool in adjusting monetary policy stance. It will "consider" beginning the process of selling the assets purchased., but the decision will depend on economic circumstances. The strategy on offloading the assets will be provided at the August meeting.
BoE also updated the economic projections conditions on a market-implied path for Bank Rate that rises to around 2.50% by mid-2023, before falling to 2.00% at the end of the forecast period. CPI is expected to rise further over the remainder of the year, averaging slightly over 10% at its peak in 2022 Q4, then falls back to 2% target in around two years. GDP is projected to fall in 2022 Q4 and calendar year GDP growth is broadly flat in 2023.