Sample Category Title
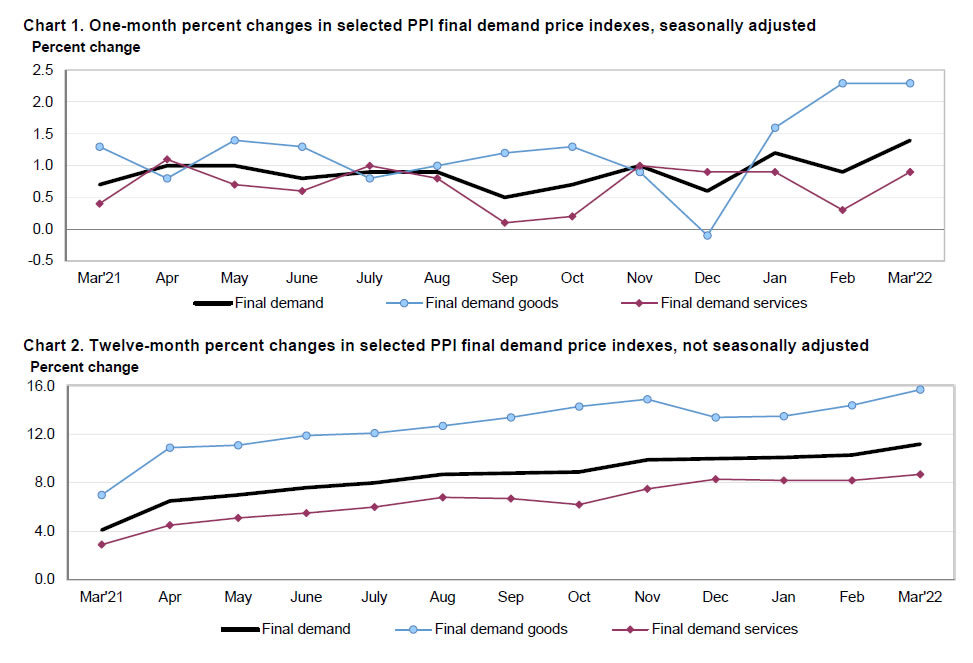
US PPI rose 1.4% mom, 11.2% yoy in Mar, record 12-month increase
US PPI for final demand rose 1.4% mom in March, above expectation of 1.1% mom. For the 12-month period, PPI accelerated to 11.2% yoy, up from 10.2% yoy, above expectation of 10.5% yoy. That's also the largest increase since the 12-month data were first calculated in November 2010.
PPI for final demand goods rose 2.3% mom while PPI for final demand services rose 0.9% mom. PPI final demand less goods, energy and trade services rose 0.9% mom, fastest since January 2021. For the 12 months, PPI for final demand less foods, energy and trade services rose 7.0% yoy.
Pound Reacts to Rising Inflation Like EM Currency
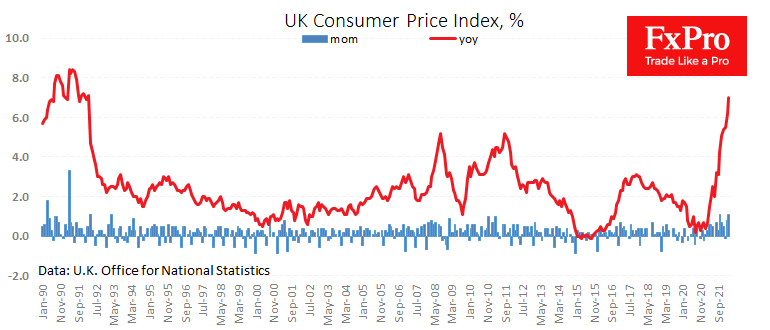
Inflation in the UK is developing an acceleration stronger than expected. Estimates for March marked a 1.1% CPI gain for the month, above the 0.8% a month earlier and rebutting analysts’ hopes that the monthly price growth would slow to 0.7%. The year-over-year inflation rate has accelerated from 6.2% to 7.0%.
As in most of Europe, leading inflation indicators show that pressure will only increase in the coming months. Output producer prices rose by 2% in March, the most significant jump since May 2008. Producer input prices jumped by 5.2% in just one month. In the more than 40-year history of this indicator, there has only been one such jump – in November 1979. At that time, we also saw a comparable annual increase of 19.2% for Input and 11.9% for Output Producer Price Indices.
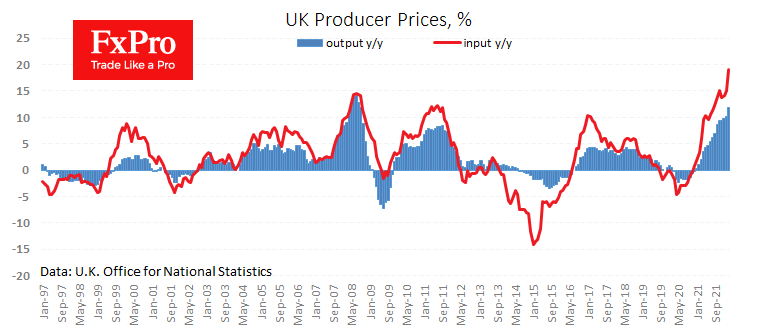
Such a jump in producer prices sets up that the pressure on consumer prices will not abruptly ease in April and May.
Just like an emerging market currency, the British pound reacted to the above-expected price hike by falling. In response to inflation, the weakening of the currency shows concern about whether the central bank can get prices under control before their rise destroys a sizable chunk of the pound’s purchasing power.
In recent days, Fed officials have been increasingly open to promoting that FOMC can suppress inflation only via pressing growth. This approach is helping the dollar locally.
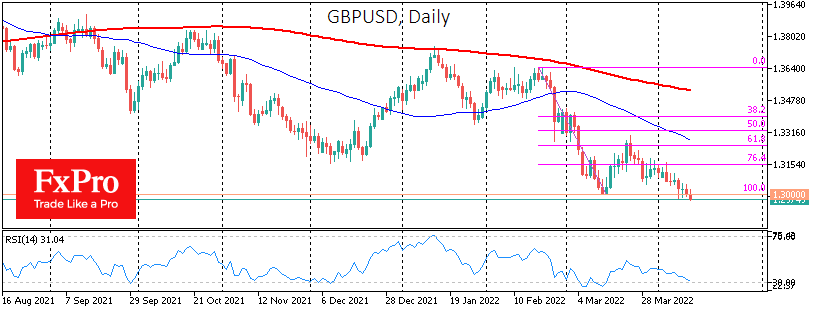
If the Bank of England adopts this rhetoric, the pound may be able to swim against the current. But until then, a systematic sell-off in the GBPUSD from the peaks near 1.4270, reached exactly three weeks ago, is conspicuous. The cable has fallen below 1.3000, renewing 17-month lows and consolidating below the psychologically crucial circular level.
Gold Sustains One-Week Bullish Bearing Despite Minor Recoil
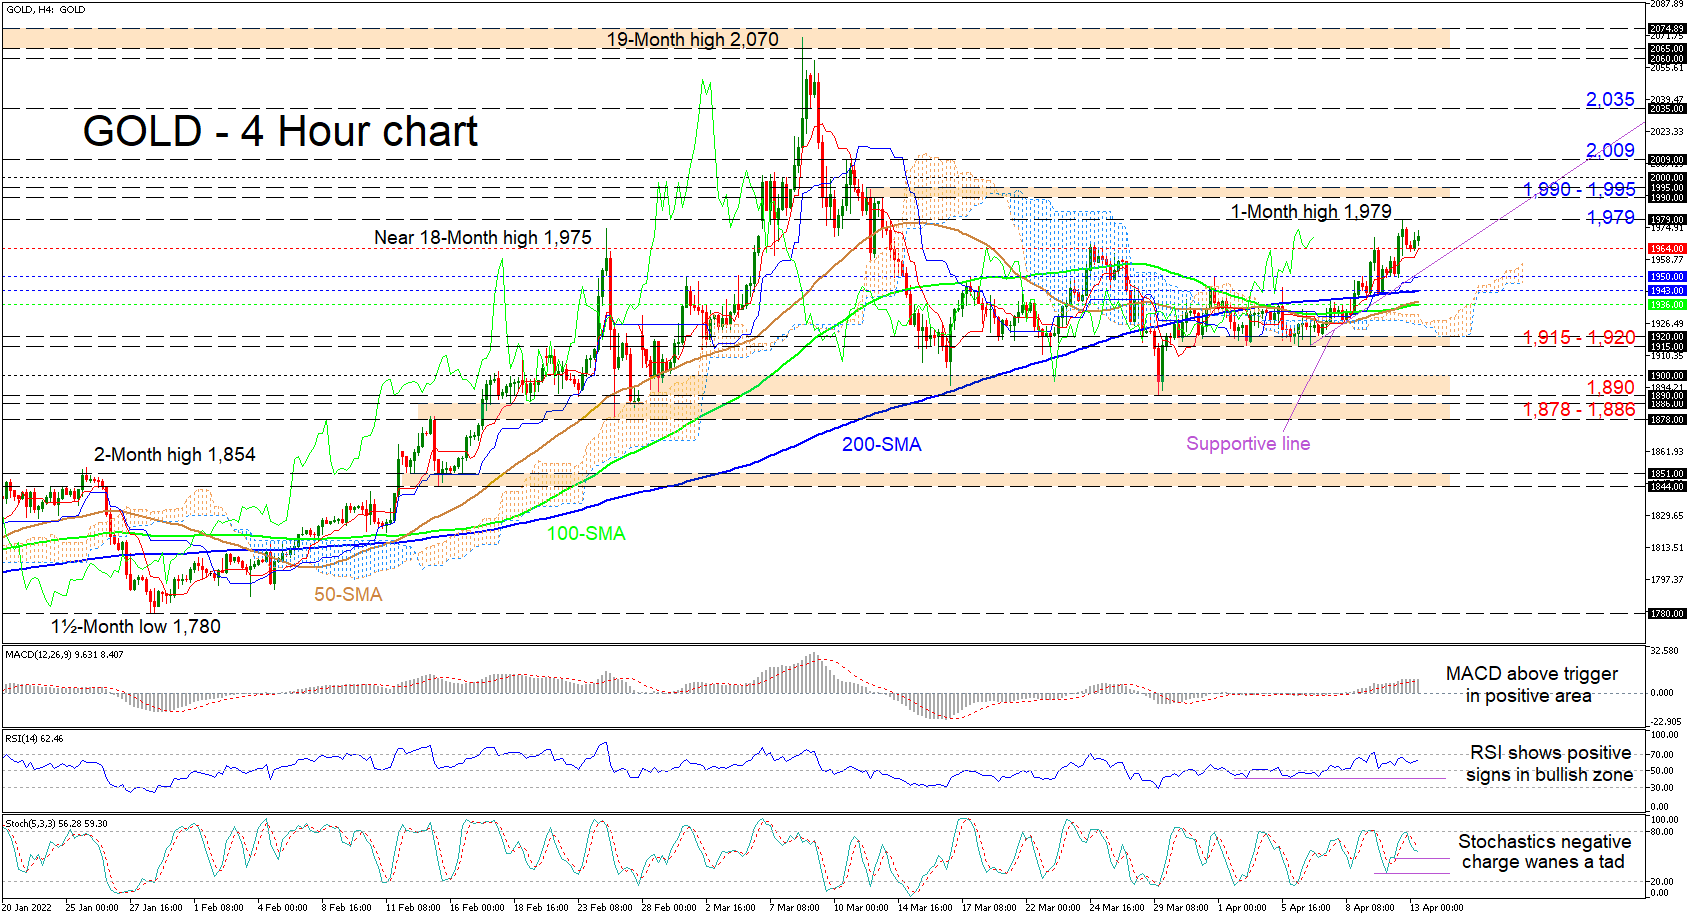
Gold’s latest positive incline is finding assistance from the climbing Ichimoku lines after finally being able to shake off the one-month sideways market, which the commodity adopted from the second half of March. The recent upturn in the slopes of the 50-and 100-period simple moving averages (SMAs) has now aligned with the 200-period SMA that continues to sponsor the broader uptrend.
The ascending Ichimoku lines are indicating positive forces are intact, while the short-term oscillators are conveying mixed messages in directional momentum. The MACD has stabilized above its red trigger line in the positive region, while the RSI is regaining ground in the bullish zone. The stochastic oscillator is now reflecting some fading in its negative charge and may start to promote upside price action.
If the Ichimoku lines continue to keep the price buoyed, bullish friction could originate from the nearby 1,979 barrier. If persistent upside pressures conquer the 1,990-1,995 resistance band too, which was formed by the highs from the first half of March, and overrun the adjacent 2,000 psychological mark, buyers could then gain confidence to challenge the March 10 peak of 2,009. Additional progress in the precious metal may subsequently pilot the price towards the 2,035 resistance.
Otherwise, if positive impetus fades, initial support could arise from the red Tenkan-sen line at 1,964. Further ebbing in the price of the yellow metal may test a potential supportive trendline pulled from the 1,915 low ahead of the blue Kijun-sen line at 1,950. From here, should the support region between the 200-period SMA at 1,943 and the 100-period SMA at 1,936 fail to defend positive developments, sellers may begin to enhance their advantage. Moreover, a dive in the price past the cloud and the 1,915-1,920 base could encourage sellers to target the 1,890-1,900 key support foundation.
Summarizing, Gold’s bigger positive structure is being defended by the border of 1,878-1,886 and the 1,890-1,900 support foundation. The commodity could maintain its climb should the Ichimoku lines continue to champion more gains. For the positive outlook to deteriorate, the price would need to sink below the supportive line and the SMAs.
RBNZ Super-Hikes But NZD Slides
The New Zealand dollar is finally in positive territory on Tuesday, after posting five consecutive losing sessions.
RBNZ rate decision looms
The RBNZ is widely expected to increase rates from the current 1.00% at the Wednesday meeting, but by how much? Pundits are calling the rate decision a “coin toss” between a 0.25% and a 0.50% increase. Most analysts expect a 0.25% move, but the markets are clamouring for a super-size 0.50% move, given soaring inflation. If investors don’t get the 0.50% move, we could see the New Zealand dollar take a tumble. With the RBNZ well into its rate-hike cycle, the markets will be combing through the rate statement, with the expectation that the Bank will be hawkish in its forward guidance.
The central bank finds itself caught between a rock and a hard place ahead of this key rate decision. There is strong pressure to contain inflation, which could hit 7%, and the most effective inflation-busting tool is one or more 0.50% rate hikes. At the same time, a sharp rise in interest rates could cause the economy to stall and result in a recession. With the unexpected Ukraine war causing plenty of turbulence in the markets and consumer and business confidence at low levels, the RBNZ has good reasons to avoid a 0.50% hike.
NZIER Business Confidence dropped sharply in Q1, falling from -28 to -40. The retail sector was particularly pessimistic, as the Omicron wave caused many consumers to stay home, even with relaxation in health restrictions. The survey found that businesses are concerned about spiralling inflation and expect the RBNZ to continue raising interest rates. As well, businesses are struggling with continuing labor shortages. It’s not a pretty picture, and the survey found that firms plan to scale back on investment due to the heightened uncertainties facing businesses.
NZD/USD Technical
- There is resistance at 0.6902, followed by 0.6980
- NZD/USD has support at 0.6769 and 0.6691
German economists warn of GDP contraction and record inflation in case of Russian energy ban
In the Joint Economic Forecast, Germany's government advisors warned of a contraction in the economy next year in case of a full halt in Russian natural gas imports. Inflation could also be pushed further the post-war record.
In the baseline scenarios, GDP is estimated to grow 2.7% in 2022 (revised down from fall report's 4.8%), and 3.1% in 2023 (revised up from 1.9%). Inflation is forecast to hit 6.1% in 2022, highest number in 40 years, then slow to 2.8% in 2023.
However, in case of a Russian energy supply stop, GDP would growth only 1.9% in 2022, and then contract -2.2% in 2023. Inflation will rise further to 7.3% in 2022, a record-high in post-war Germany, then slow to 5% in 2023.
"If gas supplies were to be cut off, the German economy would undergo a sharp recession. In terms of economic policy, it would then be important to support marketable production structures without halting structural change. This change will accelerate for gas-intensive industries even without a boycott, as dependence on Russian supplies, which have been available at favorable prices up to now, is to be overcome quickly anyway,"Stefan Kooths, vice president of the Kiel Institute for the World Economy said.
"Policymakers should be careful not to provide poorly targeted transfers to cushion high energy prices. If such support schemes are handed out on a wide front, it will further drive up inflation and undermine the important signaling effect of higher energy prices. This in turn exacerbates the problems of low-income households and increases overall economic costs."
USDCAD Retreats ahead of BOC Interest Rate Decision
US stocks erased earlier gains after the Bureau of Labor Statistics published high inflation data. The Dow Jones fell by 156 points after rising by over 200 points earlier. The tech-heavy Nasdaq 100 index retreated by over 90 points while the CBOE VIX rebounded by over 1%. Data showed that the headline consumer inflation rose by 8.5% in March as oil and gas prices surged. Excluding food and other volatile products, inflation rose by 0.3%, the lowest increase since September last year. It advanced by 6.5% on a year-on-year basis. Stocks and cryptocurrency prices rose as investors anticipated that the Fed will not need to tighten as aggressively as earlier expected.
The price of crude oil rose in the overnight session after OPEC reduced its forecast for global growth. The cartel warned that demand will slow because of the ongoing crisis in Ukraine. It expects that the economic growth for the year will be 3.9% from the previous 4.2%. It slashed its forecast for Russian oil production by 530k barrels to about 10.8 million barrels. It also expects that US production will boost its production by 261k barrels to 17.75 million barrels. The price will react to the upcoming US inventory data by the Energy Information Administration.
The economic calendar will have some important events on Wednesday. Earlier, the Reserve Bank of New Zealand (RBNZ) decided to boost its interest rates from 1.0% to 1.25%. The bank attributed this boost to the need to slow the rising inflation. China published the latest trade numbers while Japan released the most recent core machinery order data. Other important events will be the US consumer and producer inflation numbers and the latest interest rate decision by the Bank of Japan and UK consumer inflation data.
USDCAD
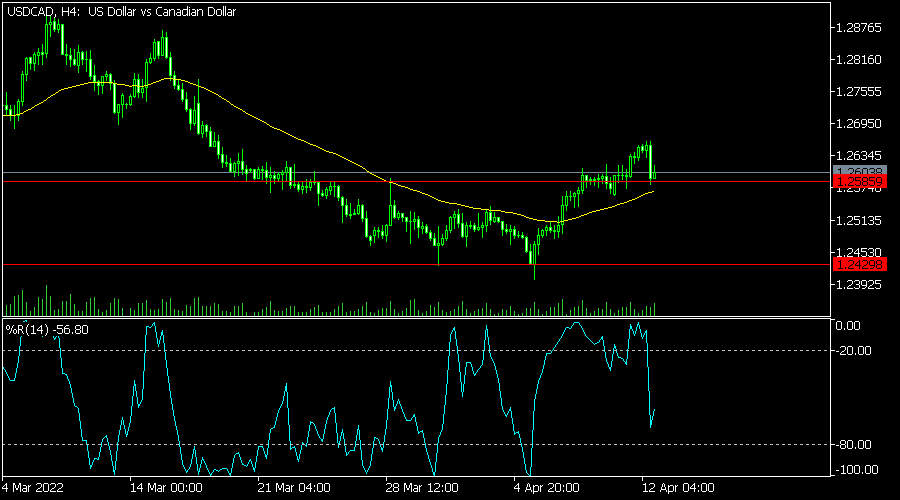
The USDCAD pair declined sharply after the latest US consumer inflation data. It fell to a low of 1.2600, which was lower than this week’s high of 1.2662. On the four-hour chart, the pair retested the important support level at 1.2585, which was the highest level on March 28. It has moved slightly above the 25-day moving average while the Williams %R has moved from the overbought level. Therefore, the pair will likely keep falling ahead of the BOC decision.
EURUSD
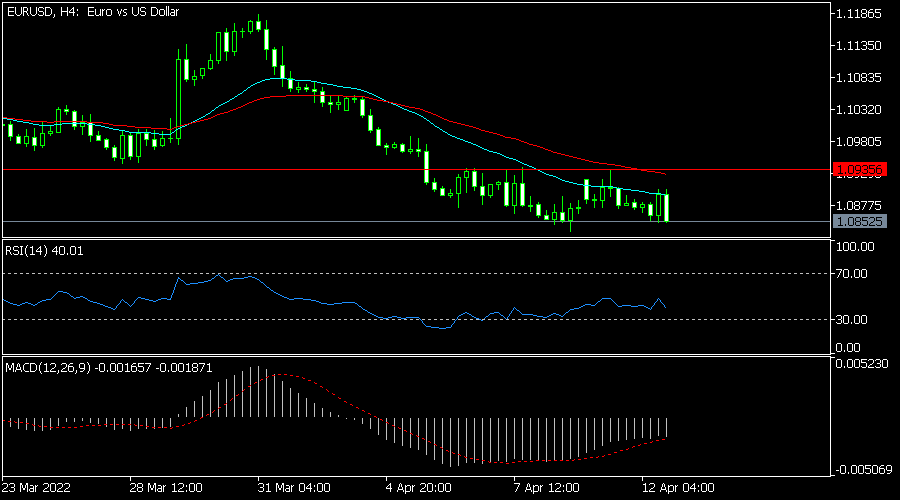
The EURUSD pair initially rose after the latest US inflation data and then erased some of those gains. It is trading at 1.0853, which was slightly below this week’s high of 1.0935. The pair is slightly below the 25-day moving average while the MACD is slightly below the neutral level. The Relative Strength Index has moved to the neutral point of 45. The pair will likely keep falling today as focus shifts to the upcoming ECB decision.
XBRUSD
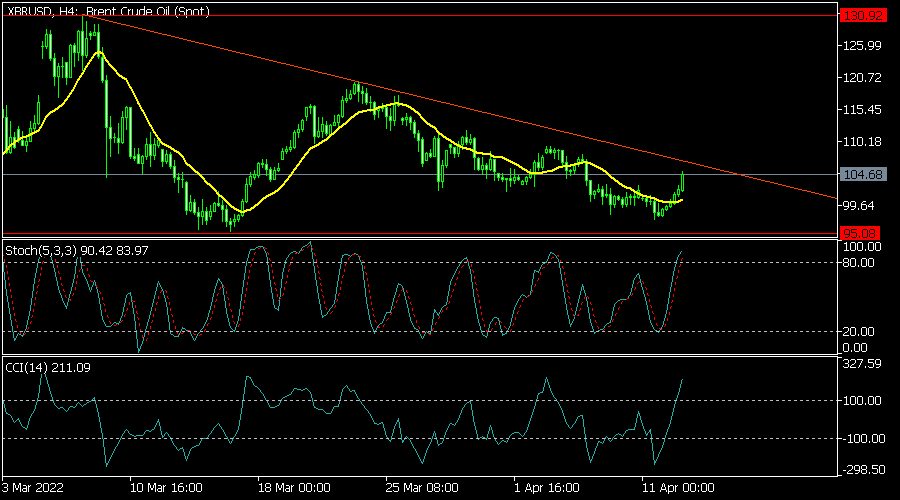
The XBRUSD pair rose even after OPEC announced a slowdown in demand. The pair is trading at 104.93, which is slightly below the descending trendline shown in red. It has also formed a descending triangle pattern while the Stochastic Oscillator and CCI have moved upwards. Therefore, the pair will likely resume the downward trend as bears target the lower side of the triangle at 95.08.
Bitcoin is the Lame Duck of the Crypto Market
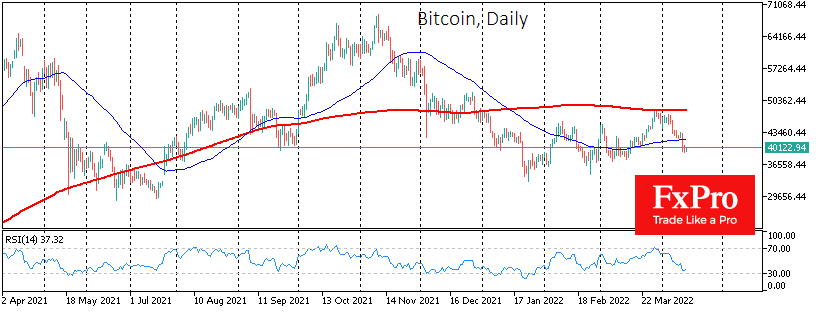
Bitcoin was down 0.8% on Tuesday, ending the day near $39,500. On Wednesday morning, the price stabilized around the $40K level, showing a slight increase of 0.4% over the past 24 hours. Ethereum added 1.8% during the same time. Other leading altcoins from the top ten are showing growth in the range from 0.9% (Avalanche) to 3.7% (Binance Coin). The Shiba Inu Token (SHIB) has also jumped by 15%, becoming the growth leader in the TOP-100.
The total capitalization of the crypto market, according to CoinMarketCap, increased by 1.5% per day to $1.87 trillion. The Bitcoin Dominance Index fell 0.4% to 40.7% on a sharper rebound in altcoins.
Сrypto market attempts to stabilize after the downturn caused the Fear and greed index to strengthen. It added 5 points up to 25 by Wednesday morning and remained in a state of “extreme fear”.
Bitcoin remains the lame duck of the crypto market due to the prevailing price decline in traditional financial sectors. BTC tried to correct upwards on Tuesday after a strong drawdown the day before.
According to CoinShares, institutional investors withdrew $134 million from crypto funds last week, the most in 13 weeks.
In addition, it is still difficult to find confirmation of the hypothesis that cryptocurrencies are a hedge against inflation. The latest US consumer inflation data showed an 8.5% rise in prices in the US. During the same time, the capitalization of the crypto market in dollars decreased by 13%, reducing the purchasing power of the initial capital by more than 20%.
Speaking of Germany, for example, with its 7.6% price increase per year, an 8% depreciation of the euro against the dollar should also be added to the equation, which will further increase the losses. Investments in gold, on the other hand, give real (inflation-adjusted) growth of 8%, and in euros – more than twice as much.
This relationship is critical for retail investors, most of whom make decisions based on rather impulsive estimates and proceed from the foreseeable horizon.
At the same time, the institutional approach still points to the attractiveness of cryptocurrencies. Bank of America believes that Bitcoin and other cryptocurrencies could outperform bonds and stocks in the face of a potential global economic recession.
Investment agency Morningstar believes that cryptocurrencies have no equal in terms of income among assets, although they have too high volatility.
This is similar to the issue of new assets that the US stock market went through about a hundred years ago. By the beginning of the new century: it was the sector of high-tech companies, and now is the turn of cryptocurrencies.
NZD/USD: Kiwi Drops after RBNZ Tempered its Unexpected 0.5% Rate Hike
The New Zealand’s dollar fell to one-month low in early Wednesday’s trading, after the RBNZ surprised markets by 0.5% rate hike, the biggest rate hike in more than twenty years (most of analysts expected a quarter percent increase).
The central bank tempered its strong hawkish stance by keeping its projection for the cash rate to peak at 3.35% at the end of 2023, adding that large rate hike lessens risk of inflation getting out of control that prompted investors to sell Kiwi dollar.
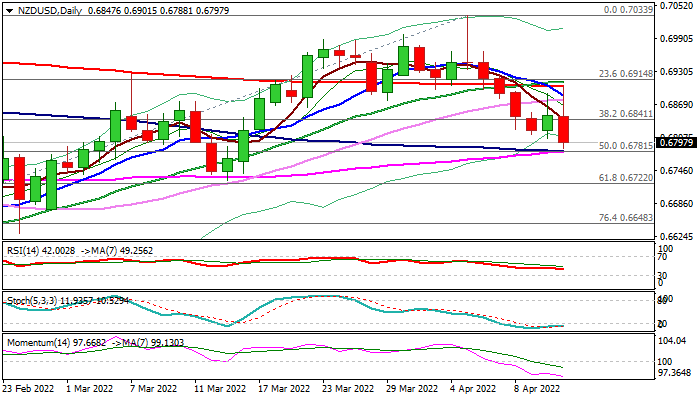
Fresh weakness signal continuation of the bear-leg from 0.7033 (Apr 5 high), with pivotal support at 0.6782 (50% retracement of 0.6529/0.7033 upleg / converged 55/100DMA’s) being under pressure, with break here to add to negative signals and open way for rally through daily Ichimoku cloud (0.6778/0.6727).
Rising bearish momentum and 5/200 and 10/200DMA’s death-crosses on daily chart, support the action, while broken Fibo 38.2% support (0.6841) now marks solid resistance, which should ideally cap and maintain bearish bias.
Res: 0.6841; 0.6876; 0.6901; 0.6920
Sup: 0.6782; 0.6741; 0.6722; 0.6674
 NSD
NSD
NZDUSD Plunges Below 0.6800 and the Uptrend Line
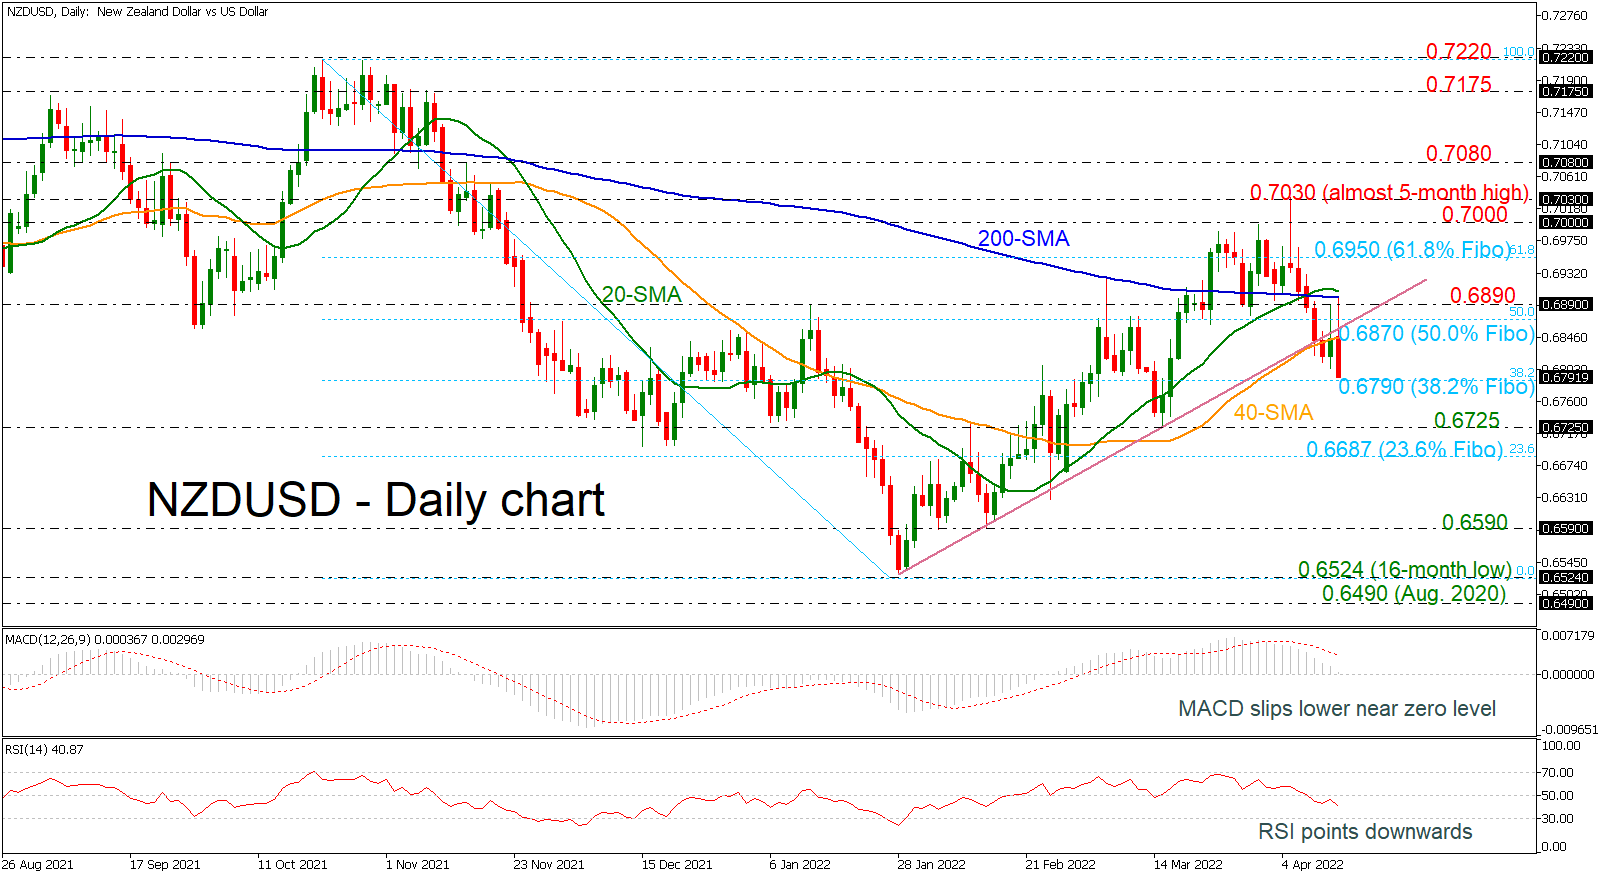
NZDUSD is moving back to a negative ground after it failed to cross above the short-term uptrend line in the preceding days. The MACD oscillator is losing momentum below its trigger line and around the zero level, while the RSI is pointing south in the negative territory, both suggesting that the next move could be to the downside.
In the bearish scenario where the 38.2% Fibonacci retracement level of the down leg from 0.7220 to 0.6524 at 0.6790 halts upside movements, the market could retest this level ahead of touching the 0.6725 barrier. Even lower, investors could shift attention to the 23.6% Fibonacci of 0.6687 before slipping to the 0.6590 barrier.
Should the price close comfortably above the 50.0% Fibonacci of 0.6870, traders could add more value to the pair, pushing the market up to 0.6890 slightly below the 200- and 20-day simple moving averages (SMAs) at 0.6900 and 0.6913 correspondingly. The 61.8% Fibonacci at 0.6950 and the 0.7000 mark have been strictly acting as resistances as well and therefore should be in focus.
In brief, NZDUSD is in a negative mode in the short-term timeframe as it continues the bearish move below the ascending trendline.
USDJPY Advances to a Two-Decade High in Overbought Zone
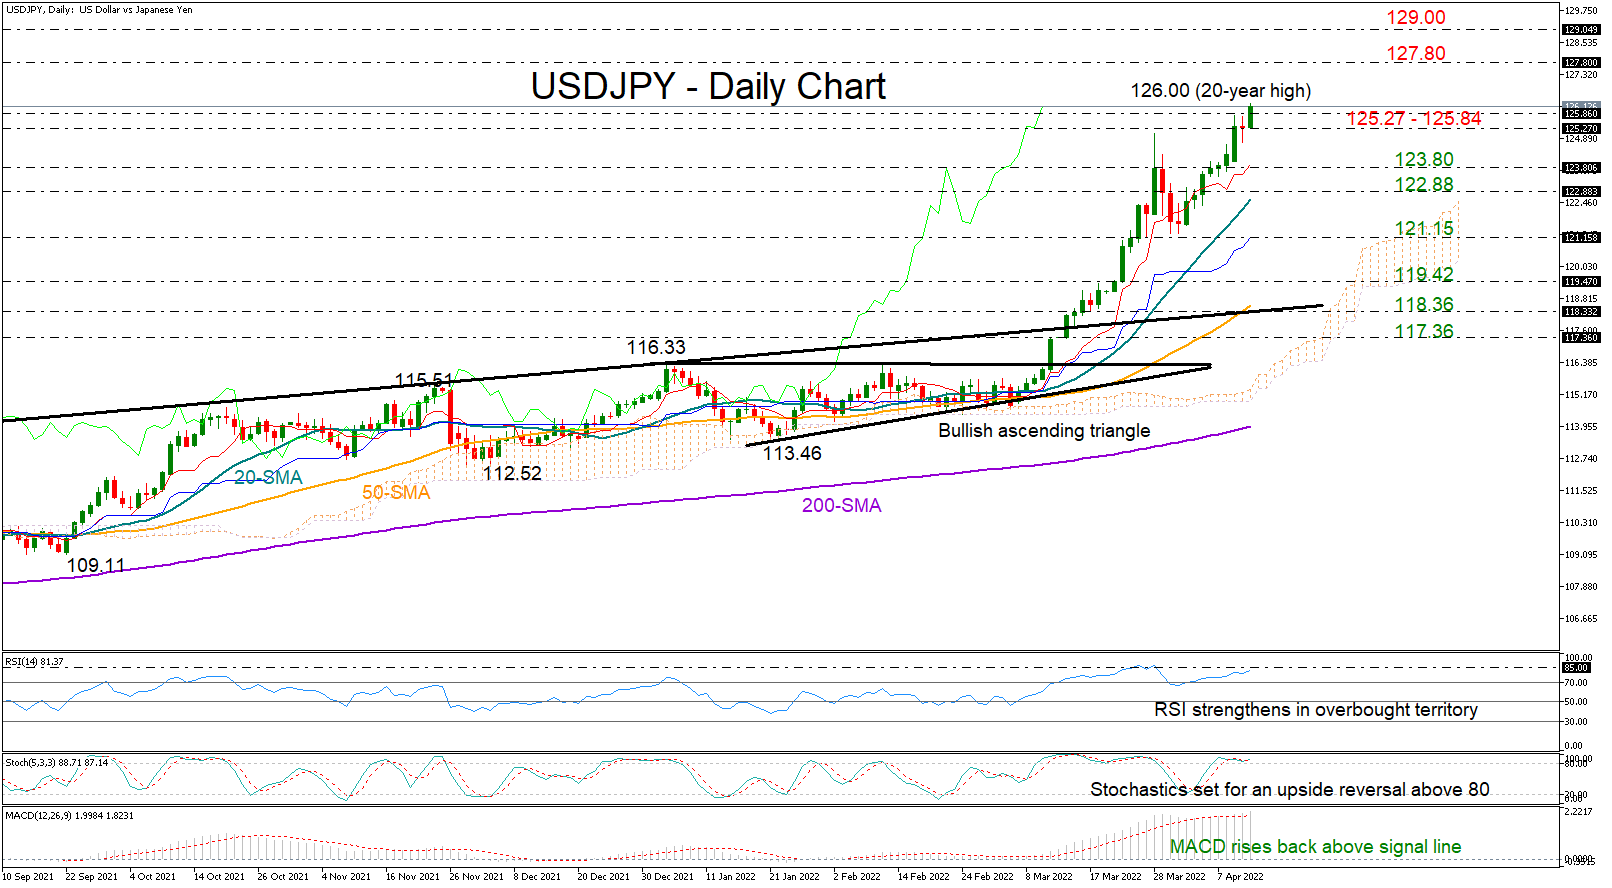
USDJPY bulls returned on Wednesday to fight the key 125.27 – 125.85 region after a neutral day, with the price even touching an almost two-decade high of 126.00.
The positive trajectory in the momentum indicators endorse the bullish action in the market, though with the RSI and the Stochastics hovering in the overbought region for a week now, a downside correction would not be a big surprise in the short term.
Nevertheless, a decisive close above the 125.85 bar could confirm additional buying activity likely towards the 127.80 – 129.00 constraining zone last seen in April 2002. Higher, the next obstacle could pop up around 130.50 taken from the first quarter of 2002.
Alternatively, for the bears to come back into play, the price will need to drift below the 125.27 barrier. In this case support could initially develop within the 123.80 – 122.88 territory, where the 20-day simple moving average (SMA) is converging. Should sellers persist, the limits around 121.15 may attempt to block any sharper declines towards the 119.42 – 118.36 zone. Still, only a continuation below 116.33 would downgrade the broad positive outlook in the market.
All in all, USDJPY may keep attracting buying interest in the coming sessions, especially if the price manages to claim the 125.85 bar, though some caution is warranted as the price is trading in an overbought zone.