Sample Category Title
AUD/USD Daily Report
Daily Pivots: (S1) 0.7232; (P) 0.7261; (R1) 0.7283; More...
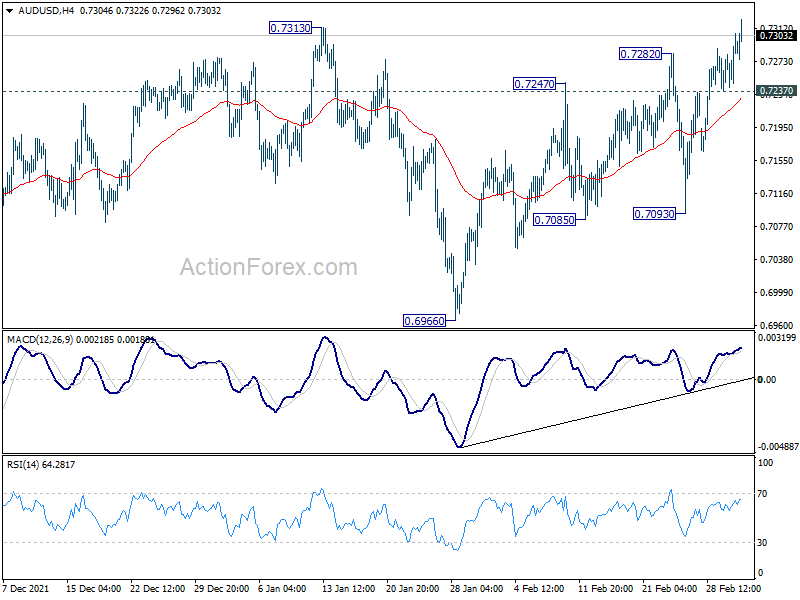
AUD/USD's rally is still in progress and intraday bias remains on the upside. The break of 0.7313 resistance suggests that corrective decline from 0.8006 has completed at 0.6966, after hitting 0.6991 key support. Further rise should be seen to 0.7555 resistance for confirmation. On the downside, break of 0.7237 minor support will turn intraday bias neutral first. But further rally is still in favor as long as 0.7093 support holds.
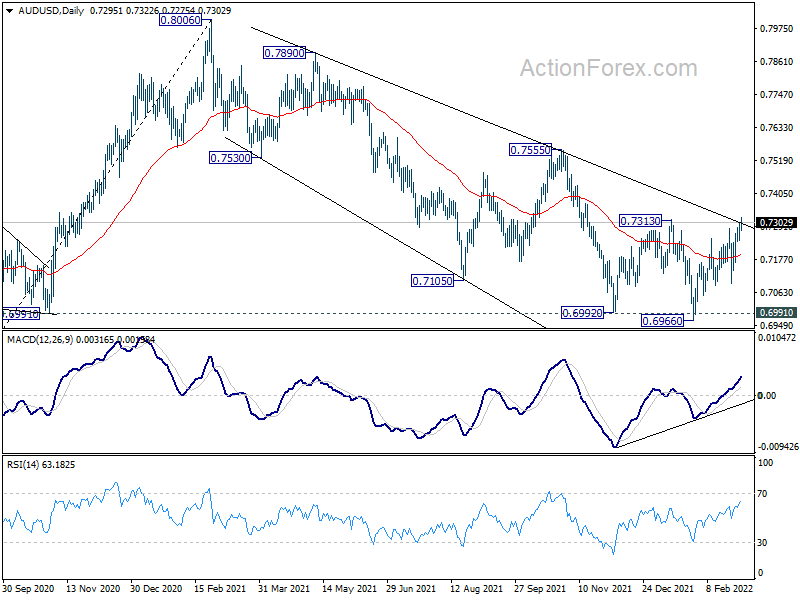
In the bigger picture, focus remains on 0.6991 key structural support. Sustained break there will argue that the whole up trend from 0.5506 might be finished at 0.8006, after rejection by 0.8135 long term resistance. Deeper decline would then be seen back to 61.8% retracement of 0.5506 to 0.8006 at 0.6461. Meanwhile, strong rebound from 0.6991 will retain medium term bullishness. That is, whole up trend from 0.5506 is still in progress.
USD/CAD Daily Outlook
Daily Pivots: (S1) 1.2592; (P) 1.2668; (R1) 1.2709; More...
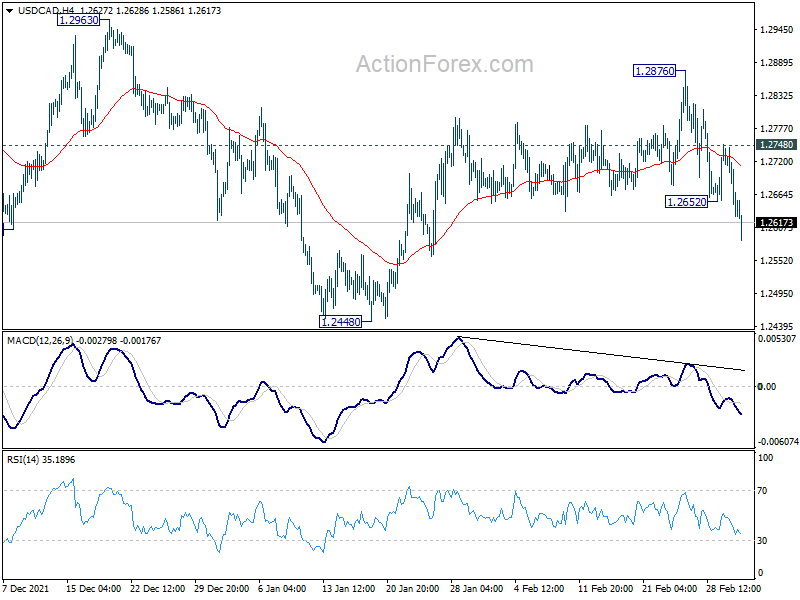
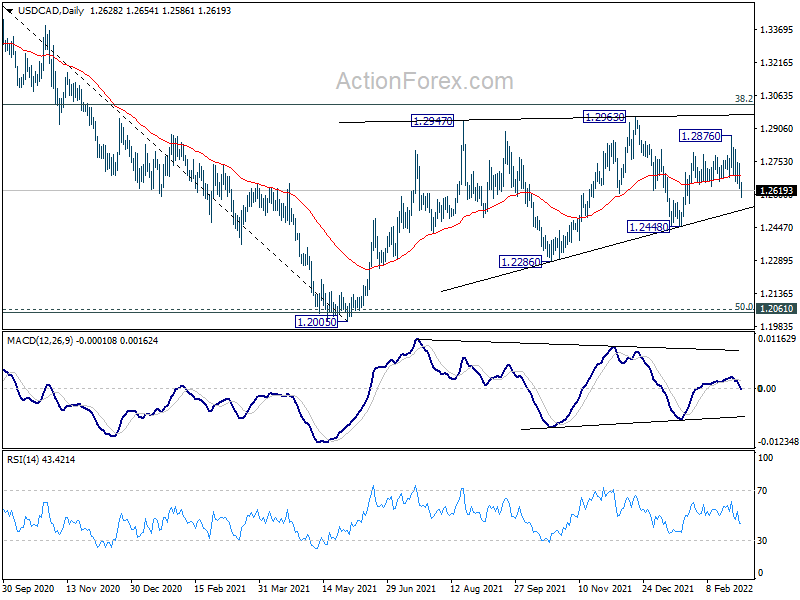
Intraday bias in USD/CAD is back on the downside as fall from 1.2876 resumed. As noted before, rebound from 1.2448 should have completed already. Deeper decline would be seen to retest 1.2448 support. Break there will target 1.2286 next. On the upside, above 1.2748 minor resistance will turn bias back to the upside for 1.2876 resistance instead.
In the bigger picture, focus stays on 38.2% retracement of 1.4667 (2020 high) to 1.2005 (2021 low) at 1.3022. Sustained break there should confirm that the down trend from 1.4667 has completed after defending 1.2061 long term cluster support. Further rise would then be seen towards 61.8% retracement at 1.3650. However, rejection by 1.3022 will maintain medium term bearishness. Break of 1.2005 will resume the down trend from 1.4667 and that carries larger bearish implications too.
GBP/JPY Daily Outlook
Daily Pivots: (S1) 152.28; (P) 153.48; (R1) 154.31; More...
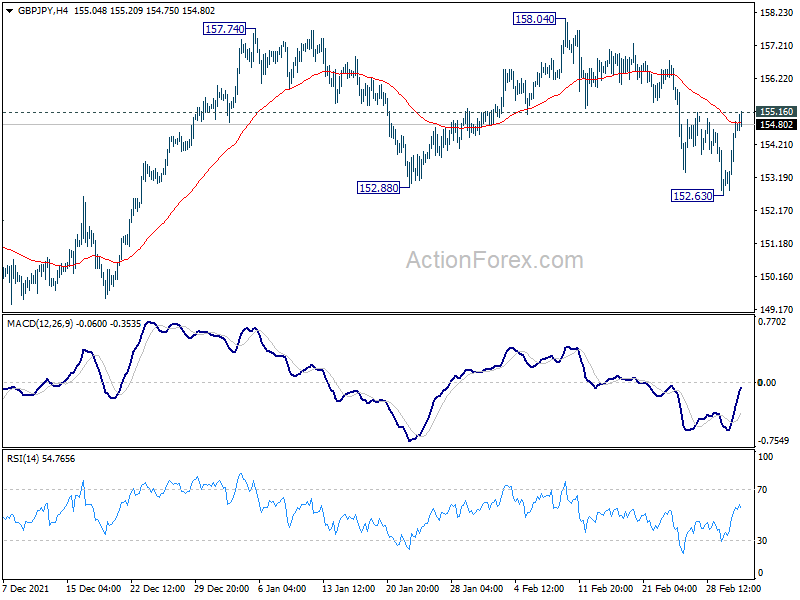
Intraday bias in GBP/JPY is turned neutral at this point. Another fall is expected with 155.16 resistance intact. Break of 152.63 will resume the fall from 158.04 to 148.94 support. However, firm break of 155.16 will argue that fall from 158.04 has completed, and turn bias back to the upside for retesting 158.04/19.
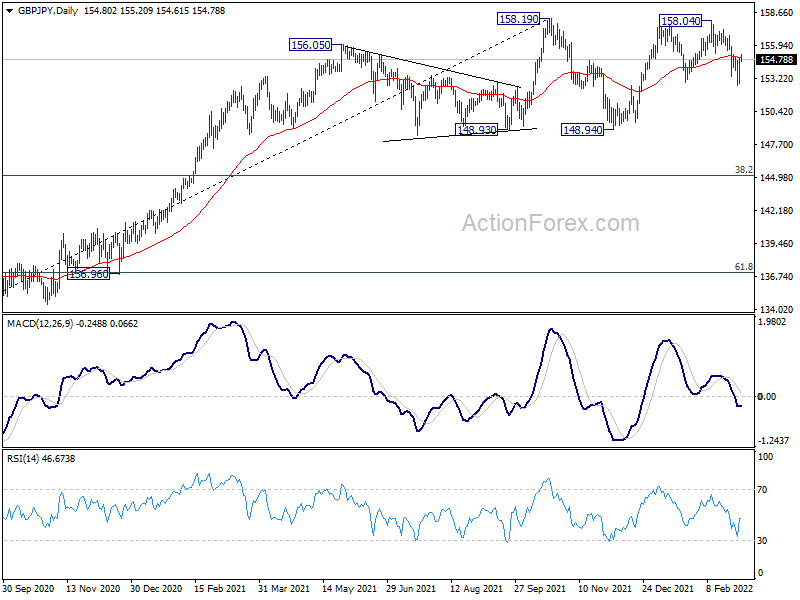
In the bigger picture, price actions from 158.19 are seen as developing into a consolidation pattern to up trend from 123.94 (2020 low). Downside should be contained by 38.2% retracement of 123.94 to 158.19 at 145.10 to bring rebound. Firm break of 158.19 will resume the up trend to long term fibonacci level at 167.93. However, sustained break of 145.10 will raise the chance of trend reversal and target 61.8% retracement at 137.02.
EUR/JPY Daily Outlook
Daily Pivots: (S1) 127.62; (P) 128.19; (R1) 129.08; More....
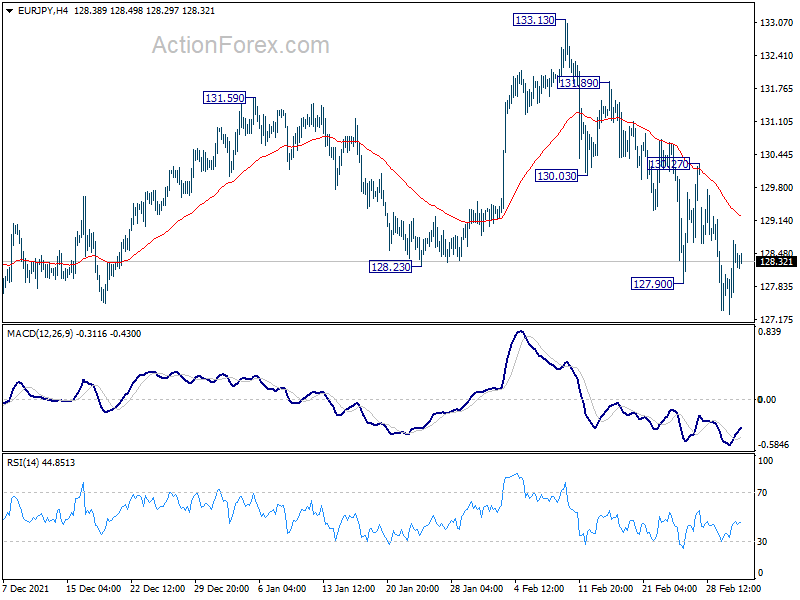
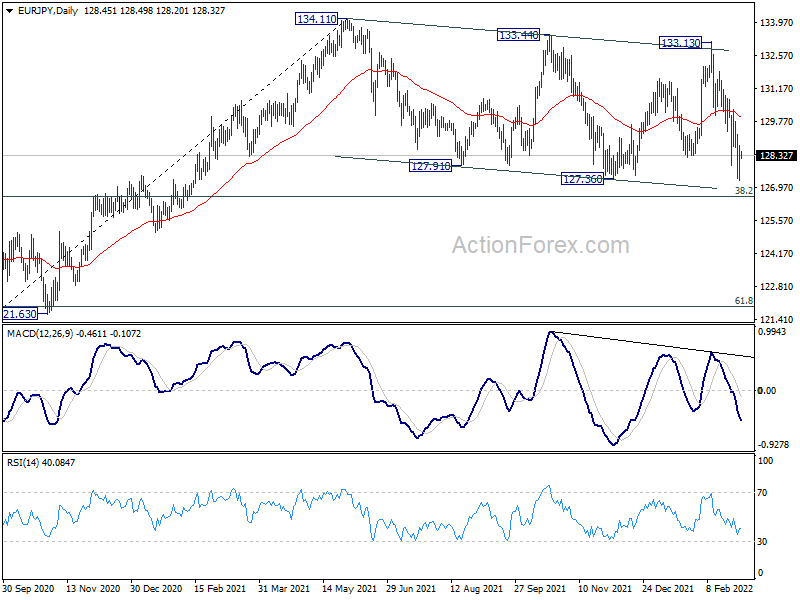
EUR/JPY is losing some downside momentum. But further decline is expected as long as 130.27 resistance holds. Decline from 133.13, as another falling leg of the corrective pattern from 134.11, should target 126.58 fibonacci level next.
In the bigger picture, price actions from 134.11 are currently seen as a consolidation pattern only. As long as 38.2% retracement of 114.42 (2020 low) to 134.11 at 126.58 holds, up trend from 114.42 is still in favor to continue. Break of 134.11 will target long term resistance at 137.49 (2018 high). However, sustained break of 126.58 will raise the chance of bearish reversal. In this case, deeper decline would be seen to 61.8% retracement at 121.94, and possibly below.
EUR/CHF Daily Outlook
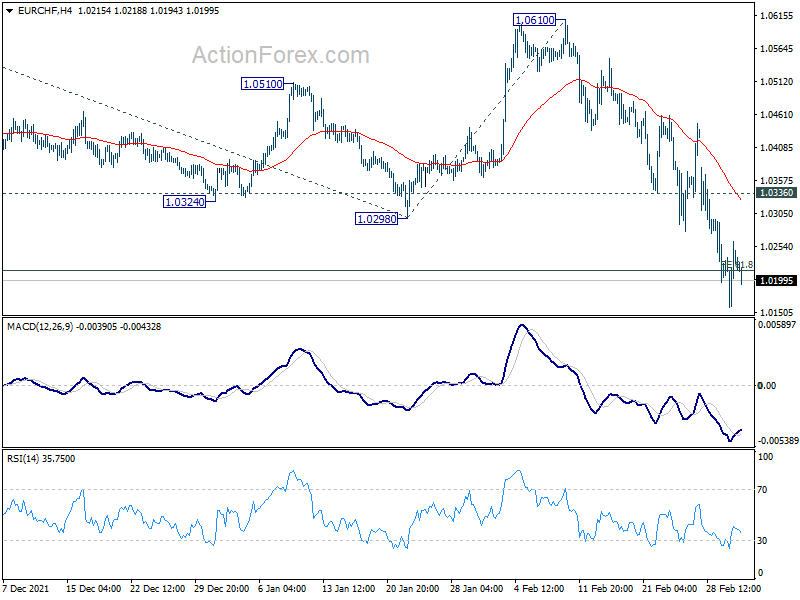
Daily Pivots: (S1) 1.0178; (P) 1.0220; (R1) 1.0281; More....
Intraday bias remains on the downside at this point. Sustained break of 61.8% projection of 1.0936 to 1.0298 from 1.0610 at 1.0216 will pave the way to 100% projection at 0.9972. On the upside, break of 1.0336 resistance is needed to indicate short term bottoming. Otherwise, outlook will stay bearish in case of recovery.
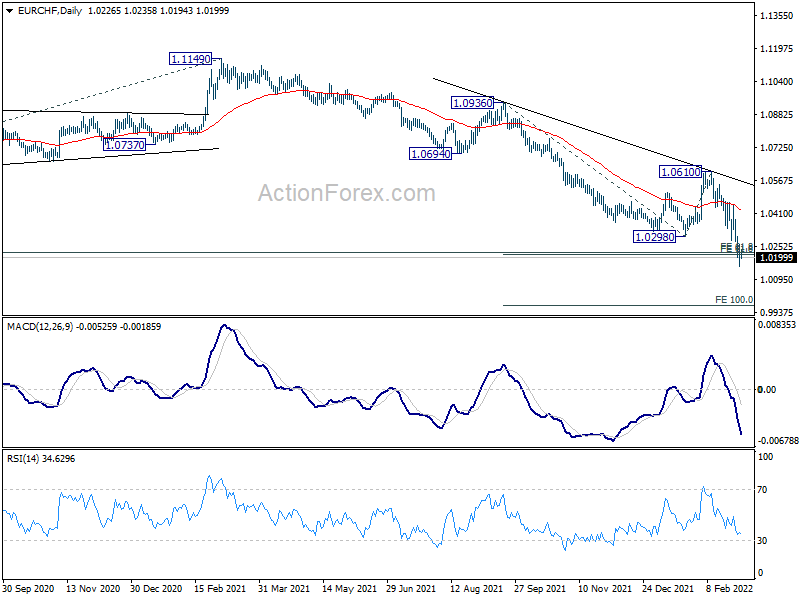
In the bigger picture, long term down trend from 1.2004 (2018 high) is still in progress. Firm break of 61.8% projection of 1.2004 to 1.0505 to 1.1149 at 1.0223 will pave the way to 100% projection at 0.9650. In any case, break of 1.0610 resistance is needed to be the first sign of bottoming. Otherwise, outlook will remain bearish.
EUR/GBP Daily Outlook
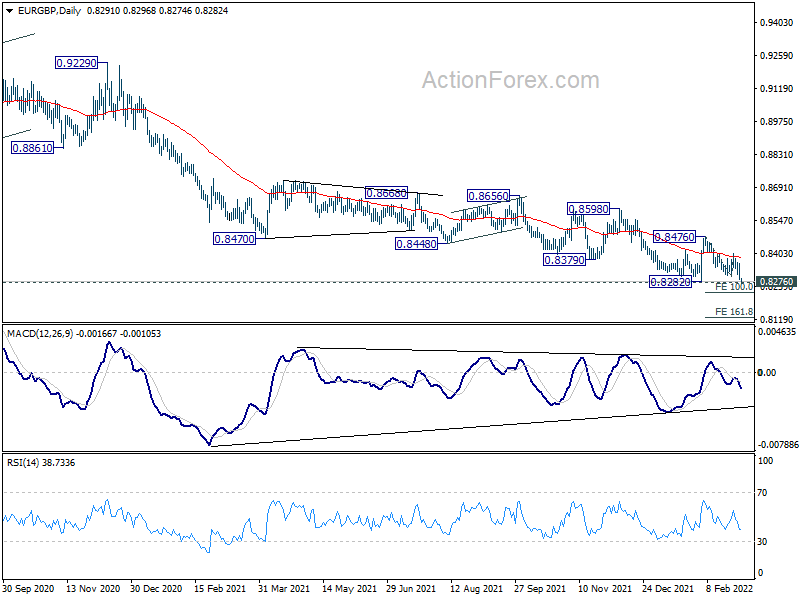
Daily Pivots: (S1) 0.8320; (P) 0.8344; (R1) 0.8372; More...
Intraday bias in EUR/GBP is back on the downside with focus on 0.8726 long term support. Sustained break there will carry larger bearish implications. Next near term target is 100% projection of 0.8476 to 0.8304 from 0.8405 at 0.8233 and then 161.8% projection at 0.8127. On the upside, break of 0.8405 resistance will indicate short term reversal and bring stronger rise to 0.8476 and above.
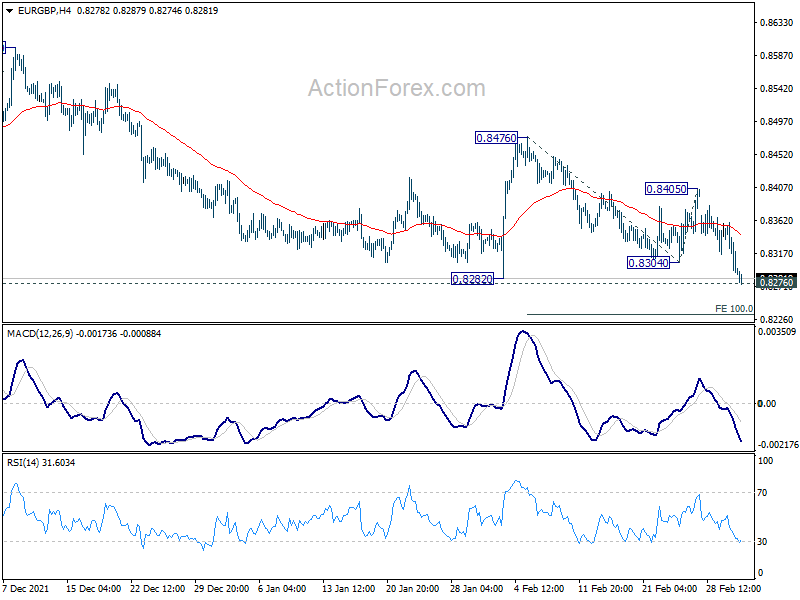
In the bigger picture, focus is now on 0.8276 long term support (2019 low). Sustained break there will argue that the long term trend has reversed. Deeper decline would be seen to 61.8% retracement of 0.6935 to 0.9499 at 0.7917. Nevertheless, break of 0.8476 resistance will indicate medium term bottoming, after drawing support from 0.8276, and bring stronger rally.
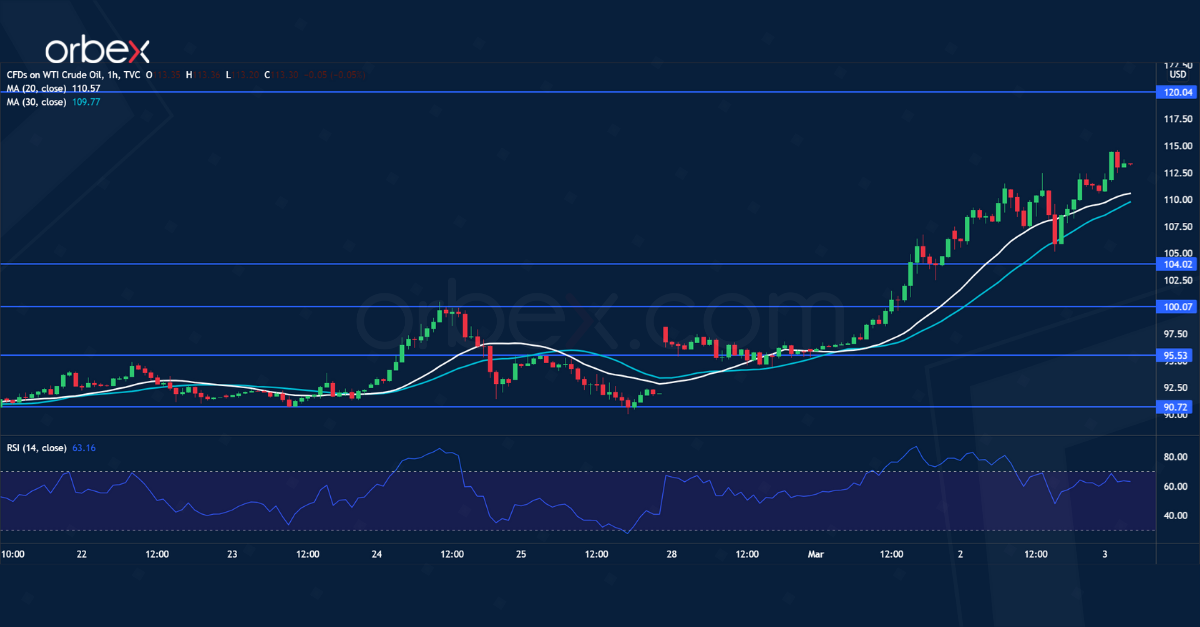
US Oil Bounces Higher
WTI crude skyrocketed as the war in Ukraine could drag on pushing up energy prices. The rally accelerated after it broke above the psychological tag of 100.00.
The RSI’s overbought situation in both hourly and daily charts indicates overextension. Profit-taking may drive the price back down and let the bulls take a breather.
104.00 is the immediate support in this case. Sentiment is overwhelmingly bullish and pullbacks could be limited. 120.00 would be the next stop when volatility comes around again.
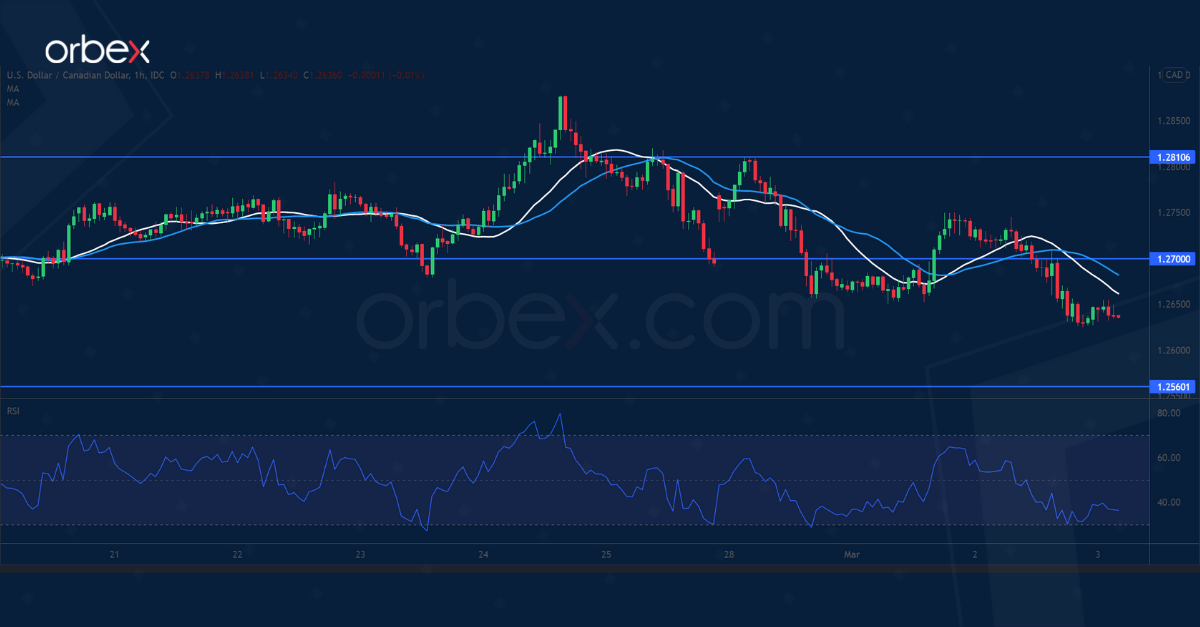
USD/CAD Breaks Support
The Canadian dollar jumped after the Bank of Canada raised its key interest rate to 0.5%. A break below the demand zone, around 1.2680, has put buyers on the defensive.
The daily support at 1.2640 was a major level. And its breach could trigger a sell-off towards 1.2560, threatening the rally from late January. Further south, January’s low at 1.2450 is a key floor to keep the greenback afloat.
An oversold RSI may lead short-term sellers to exit, driving up the price briefly, but a rebound may be capped by 1.2700.
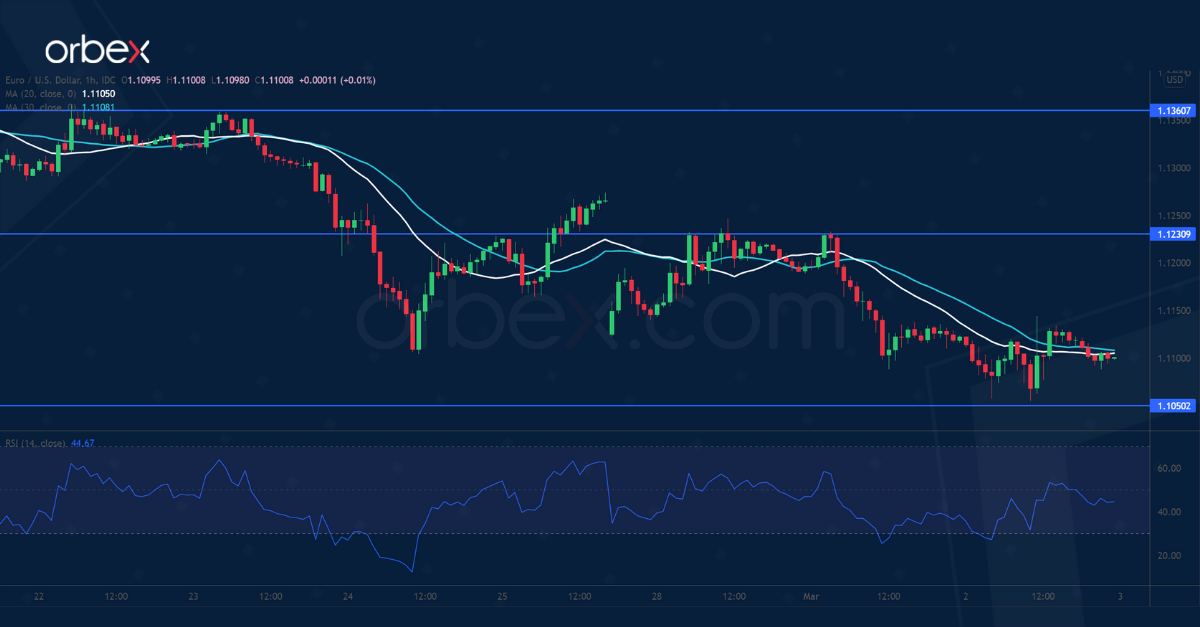
EUR/USD Sees Limited Bounce
The euro retreats as the ECB may dial back normalization amid the Ukraine crisis.
A fall below the daily support at 1.1130 was an invalidation of the February rebound and forced buyers to bail out. The lack of support means that short-term sentiment has turned bearish once again.
An oversold RSI may lift the pair temporarily due to profit-taking, but trend followers could be looking to sell into strength. 1.1230 is the closest resistance. A new round of sell-off may push the euro beyond 1.1050.
Crude Oil and Natural Gas Rally Sees No End
The Canadian dollar was little changed in the overnight session after the Bank of Canada decided to hike interest rates. The bank boosted rates from 0.25% to 0.50% in its bid to battle runaway inflation. In a statement, the BOC chair warned that the rate hike will not prevent inflation considering that there is an ongoing war in Europe. Recent economic numbers have been supportive of the Canadian economy. Retail sales have risen while unemployment is moving in the right direction.
Crude oil prices jumped to the highest level in almost a decade as investors reacted to the ongoing situation. The war has isolated Russia, the third-biggest oil producer in the world. At the same time, OPEC+ members have ignored calls by Joe Biden to boost production in a bid to stabilize prices. They will continue adding 400k barrels of oil in the market every month. According to the Energy Information Administration, American inventories crashed by more than 2.59 million barrels last week after rising by more than 4.5 million barrels in the previous week.
The focus among investors today will be Russia/Ukraine. In addition to these, some key economic numbers will likely have a minimal impact on key assets. For example, Markit will publish the latest services and composite PMI numbers from most developed countries. The expectation is that the sector did well in February. In Europe, the ECB will publish minutes of the last meeting while in the United States, the labor department will release initial jobless claims data. Jerome Powell will also testify in Congress.
XBRUSD
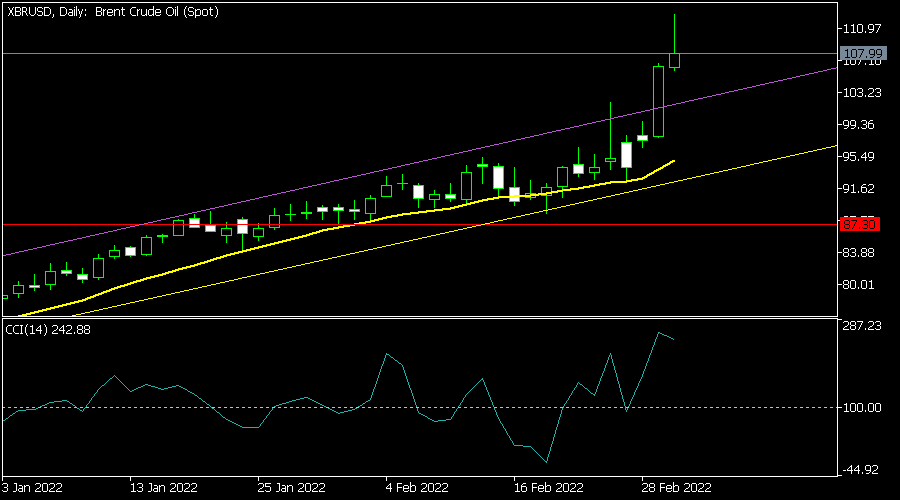
The XBRUSD pair continued its bullish trend in the overnight session. It rose to a multi-year high of 113, which was significantly higher than where it started the year. On the daily chart, the pair remains above the 25-day and 50-day moving averages. The commodity channel index and the RSI have all pointed upwards while the pair is above the ascending channel. Therefore, the pair will likely maintain a bullish trend today.
EURUSD
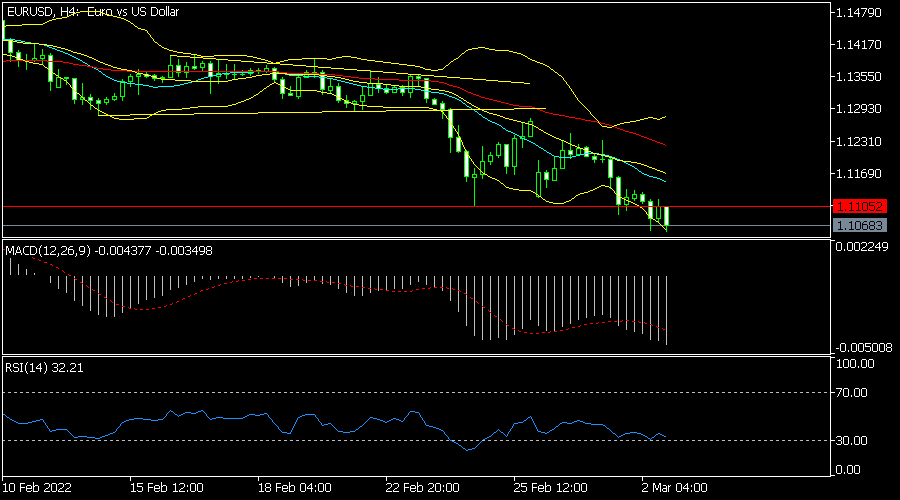
The EURUSD pair continued falling on Thursday morning. It dropped to a low of 1.1063, which was the lowest level since 2020. It has managed to move below the 25-day and 50-day moving averages and is along the lower line of the Bollinger Bands. The MACD has moved below the neutral level. Additionally, the pair moved below the key support level at 1.1100. Therefore, the pair will likely continue falling today.
USDJPY
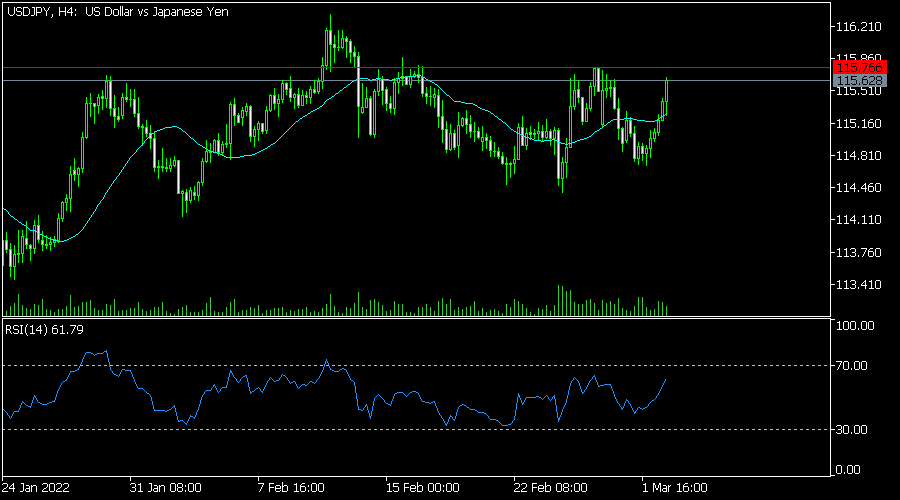
The USDJPY pair rose to a high of 115.62, which was the highest level since Friday last week. The pair has moved above the short and long-term moving averages while the RSI has pointed upwards. It is also slightly below last week’s high of 115.75. Additionally, it is below the 23.6% Fibonacci retracement level. Therefore, the pair will likely continue rising.