Sample Category Title
Gold Report: Geopolitical Uncertainty Captures the Scene
Gold prices spiked to a new yearly high price in the previous week, but ended the full session in red territory breaking the winning streak it had performed in February. We must note that Gold’s price action was impressive and presented opportunities for traders, as was expected and considering the current happenings around the world. In this report we will provide the key fundamentals behind Gold’s price action, adding to it our personal views and conclusions. We will also briefly explain what traders can focus on in the days ahead and close the report with our technical analysis pointing out price levels that are worth keeping in mind.
Market participants continue to carefully follow the developments currently taking place in Ukraine. We must note that the Gold market spiked upon news that Russian military forces officially attacked a number of sites in Ukraine’s territory and the price reached $1975, a level that was last seen back in September 2020. Yet, the price action for the time being has returned to lower grounds possibly implying traders may be waiting for more information on how the matter could play out. It is our opinion that in the scenario of worsening tensions, traders will not hesitate to apply buying pressure to Gold’s price. An example of the situation worsening could be other countries taking sides and carrying out military attacks, or the use of advanced weapons magnifying the matter even further. Some media sites highlight the dangers that the days or weeks ahead may hold. Finally, if sanctions and sanction retaliations deepen, the effects could hit the global economy in different ways which can ultimately increase economic risk. Sanctions even though a peaceful measure against actions of war, can destabilize demand and supply strings and threaten to worsen already very high inflationary pressures felt on an international basis. In this case investors can turn to Gold which tends to act as a safe haven instrument in times of geopolitical uncertainty.
In the days forward, traders and market participants have a number of important economic releases and events from the US to work with. On the 2nd of March, in the US session we get the important semiannual monetary policy testimony of the Federal Reserve Chair Jerome Powell before the House’s Financial Services Committee. On the 3rd of March, we get the weekly Initial Jobless Claims figure, the January Factory Orders rate and the February ISM N-Mfg PMI figure. Later in the US session we have another monetary policy testimony by Federal Reserve Chair Jerome Powell, this time before the Senate Banking Committee. On the 4th of March we get the key event of the week with the US employment report for February. Please note analysts and traders will have their attention fixed to this event as its results can determine a whole lot for Federal Reserve’s future steps in terms of interest rate hikes. As noted very clearly by FOMC Governor Christopher J. Waller in a speech that took place on February the 24th if the PCE inflation report for January, and jobs and CPI reports for February indicate that the economy is still running exceedingly hot, a strong case can be made for a 50-basis-point hike in March. Such a scenario can move Gold prices abruptly. If the NFP report indicates the job market remains strong then the USD could strengthen and subsequently send Gold prices lower. On the other hand, we also allow room for a general positive outlook for the US economy to create optimism among traders that could be expressed with a risk on sentiment. In this case Gold prices could soar along with the US stockmarkets. Finally, with Oil prices persisting nearby multiyear high levels pressure on the largest economies of the world including the US, China, UK, Japan and the Eurozone could be mounting as energy costs could be pushing good prices much higher making Gold very attractive. We could say that at the moment Gold and Oil prices keep a positive correlation between them. Thus traders should be mindful of this relationship and should Oil prices break to new highs Gold may advance further.
XAU/USD H4
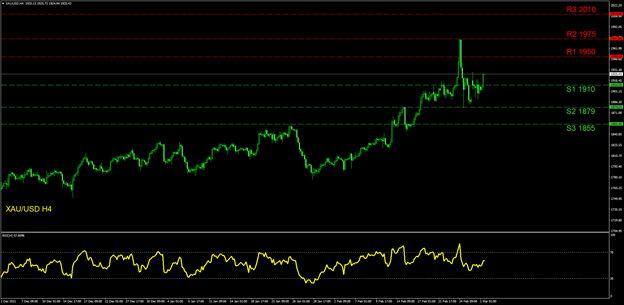
Gold’s price action has stabilized above 1900, a rather bullish sign for the metal in the short term. As Gold is currently moving nearby 1920, we tend to note the next resistance higher to be found at the (R1) 1950 level. If the upward momentum is extended then the (R2) 1975 level can be attended which is also the highest level Gold has reached since September 2020. This is a rather challenging level for Gold to reach and a breach above it will only confirm the bulls continue to be in charge. Under these circumstances, a move to the (R3) 2010 line, our highest resistance for this report could also prevail. In the opposite direction a move downwards can send the price action to the (S1) 1910 level where considerable price action has been carried out in the most recent sessions. Lower, the (S2) 1879 level was visited only once in the past week making it the lowest level Gold has fallen too very recently. In our view the (S2) is of particular importance from a selling perspective and a breach below it can change Gold’s bias to a selling one. We must also note the (S3) 1855 level that was tested various times and withstood its ground from the 11th to the 16th of February. The RSI indicator remains above 50 at the moment implying some bullish appetite is on the move. Our personal outlook for Gold remains sideways with bullish tendencies.
Dollar Awaits Nonfarm Payrolls as Geopolitics Dominate
The US dollar has been trading entirely as a safe haven asset since Putin rolled into Ukraine, but traders could turn their attention back to economics this week. The Fed Chairman will testify before Congress on Wednesday ahead of the all-important US employment report on Friday. Can the dollar continue to bulldoze its way through the FX complex?
Markets trade geopolitics
With the war in Ukraine still raging, global markets have been left hostage to geopolitical headlines. Demand for hedging has turned into the most important variable, overshadowing expectations around Fed policy as investors prioritize protection.
Naturally, the dollar has performed well in this environment. It has benefited both from its status as the world’s reserve currency and from a weaker euro as the Ukraine crisis will inflict much greater damage on Europe, both by crippling the banking sector and by pushing energy prices higher. America has neither problem as its banks aren’t exposed to Russia and it is energy independent.
But there will still be some effects on the US economy. With global energy prices charging higher, the concern is that inflation will remain elevated for longer. Some even speculated that the Fed would be forced to respond with faster rate increases.
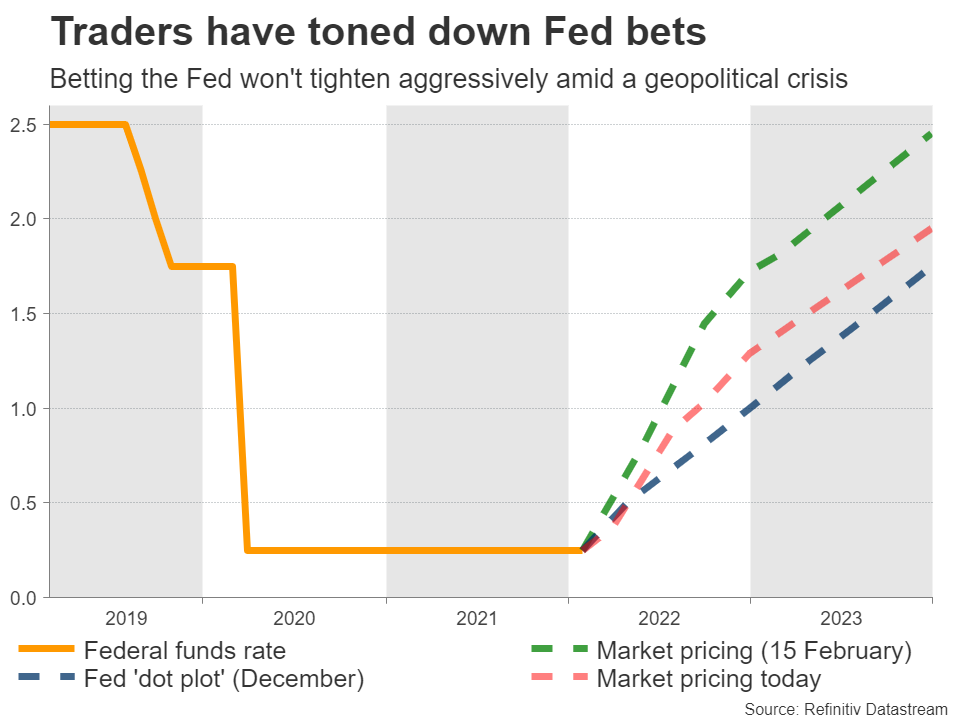
However, traders have been betting on the opposite lately. Market participants have dialed back their bets for rate hikes in recent sessions, now pricing in roughly five rate increases for the year, down from six before the Ukrainian invasion.
Investors are essentially saying the Fed won’t dare to tighten aggressively in the middle of a geopolitical crisis and risk choking economic growth, even if that means a period of higher inflation.
Crucial events
We’ll find out whether the Fed truly believes that when Chairman Powell testifies before Congress on Wednesday. Then on Thursday, the ISM services survey for February will be released. But the main event will probably be on Friday, when the latest US employment report hits the markets.
Nonfarm payrolls are forecast to have risen by 438k in February, roughly as much as the previous month. That’s expected to have pushed the unemployment rate down by one tick to reach 3.9%.
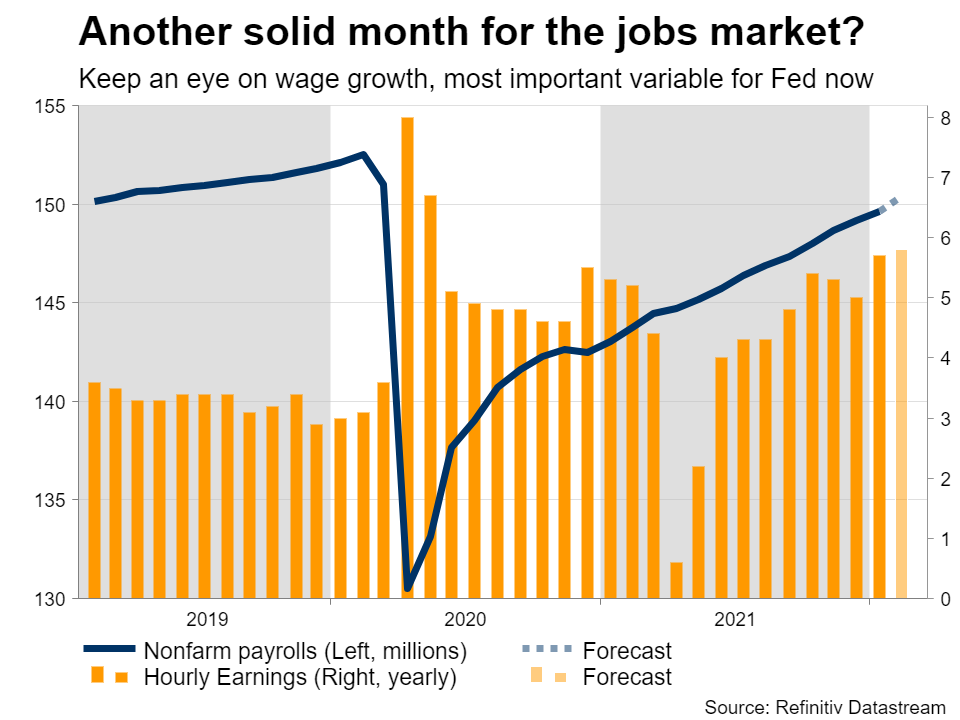
Of course, the metric that markets will focus the most on is wage growth, which is projected to have accelerated a little in yearly terms. The Fed sees wage growth as an early indicator of inflationary pressures, so it is crucial for monetary policy.
As for potential surprises, most labor market indicators that have been released so far point to a solid report. The Markit composite PMI for the month showed that US businesses increased their employment levels at the strongest pace since May, while jobless claims fell during the week the jobs survey was conducted.
Can the dollar keep going?
As for the dollar, with so much demand for safe-haven assets right now and the geopolitical picture turning against the euro, the rally could continue. Technically speaking, euro/dollar is at a crucial crossroads. The pair has been trading sideways since November essentially and it is now testing the lower boundary of that range near 1.1120.
This week’s US events will likely decide whether we see the break. In case of a strong batch of data that forces traders to price in more aggressive Fed rate increases, the pair could pierce below that level and aim for the 1.1020 region afterwards.
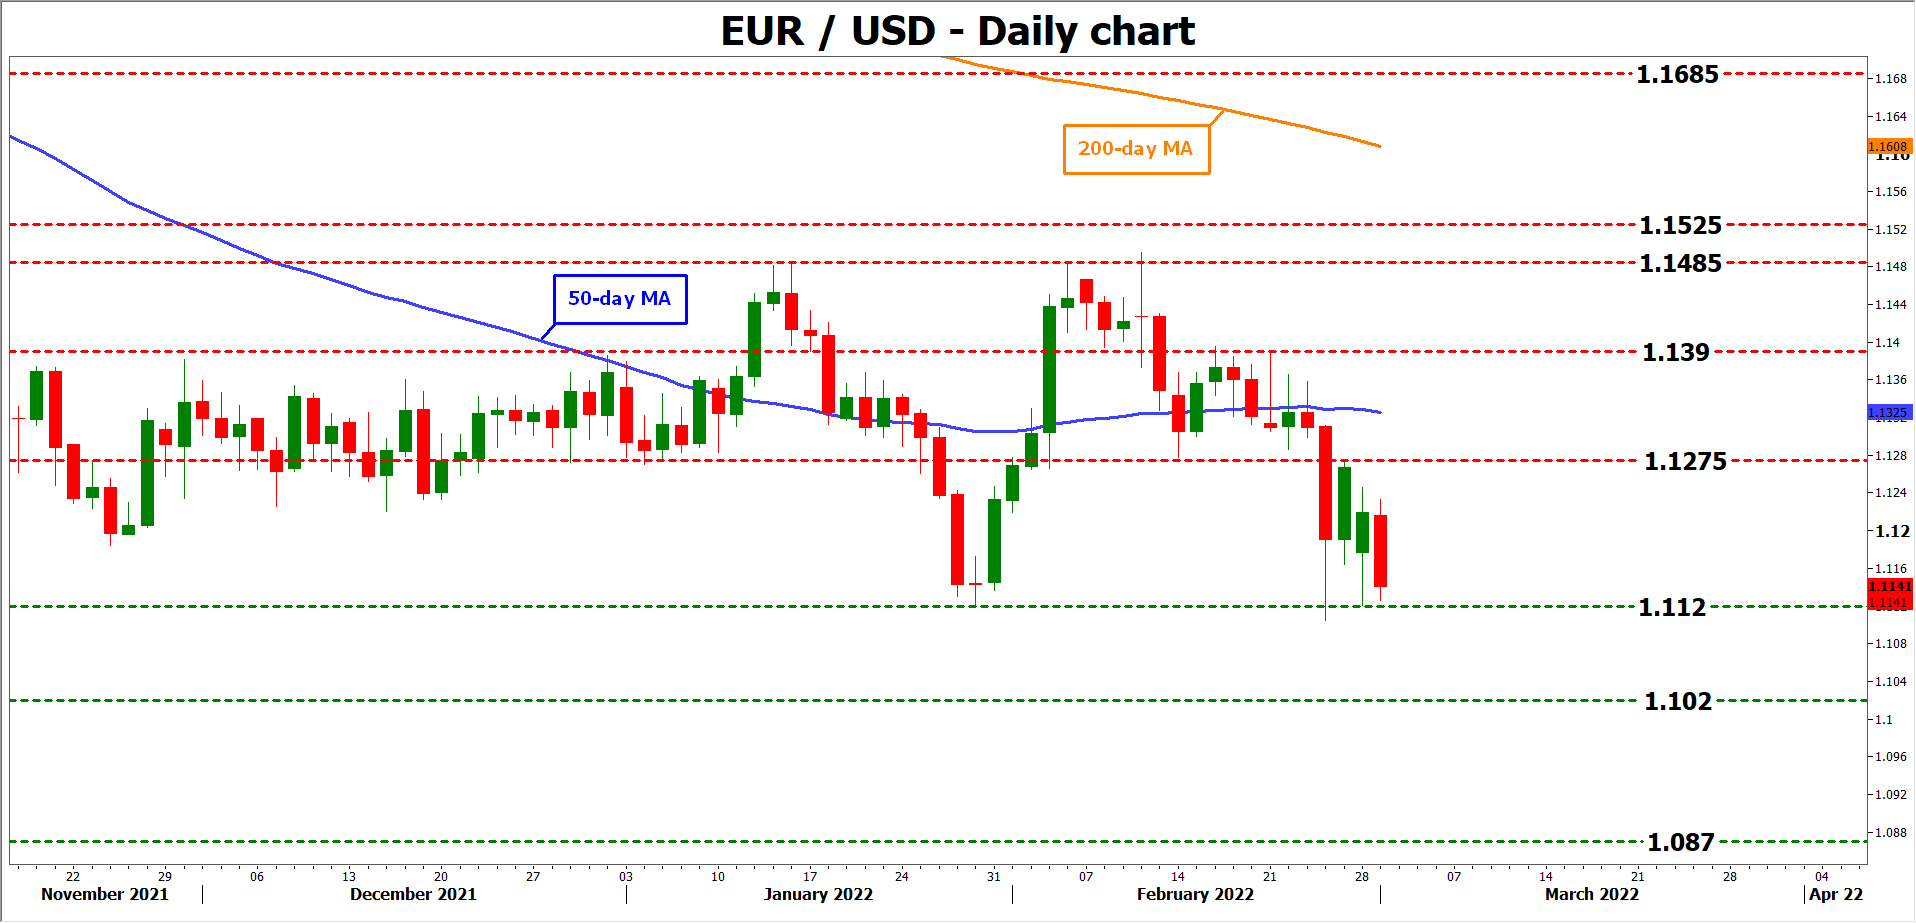
On the other hand, a disappointment could dampen Fed rate hike bets even further, setting the stage for a rebound. If euro/dollar manages to break above 1.1275 again, the next target may be the 50-day moving average currently at 1.1325.
All in all, this is a very volatile market and making long-term predictions seems pointless. For now, everything depends on geopolitics and whether there’s a ceasefire in Ukraine soon. Economics could play a secondary role until then.
Is Bitcoin a New Detour?
Russia may turn to cryptocurrency when it is banned from the SWIFT payment system. Analysts warn that if Russia is able to use crypto to circumvent sanctions, “political support for crypto in the US will fall and regulatory risks will increase.”
What happened with Bitcoin?
Bitcoin defied the stock market plunge on Monday, climbing 9.3% amid what analysts said was increased demand from buyers in Russia and Ukraine. The cryptocurrency is trading at around $43,000, according to CoinDesk data. Ethereum gained about 11% over the past 24 hours, trading at approximately $2,900.
Is Bitcoin a new Detour?
During the last five days, when the Russian invasion began, transactions on centralized Bitcoin exchanges in both the Russian ruble and the Ukrainian hryvnia have surged to their highest levels in months, according to crypto data company Kaiko. Since Sunday, total cryptocurrency donations to the Ukrainian government and non-governmental organizations supporting the military stood was about $16.7 million.
Russians are aware of the volatility of their currency, and the financial system may see Bitcoin as a way to protect their savings. On Monday, Bitcoin traded on some Russian exchanges for $46,000, about $5,000 more than its US price. There is usually no difference between the Russian and US price of bitcoin because there are arbitrage possibilities; it indicates that such a jump in the price of Bitcoin is caused by buying in Russia.
Can crypto exchanges block Russian users?
However, when Ukraine’s vice prime minister Mykhailo Fedorov urged crypto exchanges on Sunday to block Russian users, Binance, KuCoin and other major crypto exchanges refused.
“We are not going to unilaterally freeze millions of innocent users’ accounts,” a spokesperson for Binance told CNBC. “Crypto is meant to provide greater financial freedom for people across the globe. To unilaterally decide to ban people’s access to their crypto would fly in the face of the reason why crypto exists.”
Why can Russia use it?
Now, it’s supposed that Russia can decide to use cryptocurrencies in commodities deals. However, most of the world trading is still dollar-dominated. As a result, it will be difficult for Russia to use crypto to evade SWIFT.
However, if Russia fails to use the cryptocurrency to bypass sanctions, this could increase the viability of the cryptocurrency in the eyes of regulators. Either way, the future looks interesting for Bitcoin and Co because the events can push crypto to occupy a more visible place in the global financial system.
What’s next for Bitcoin price?
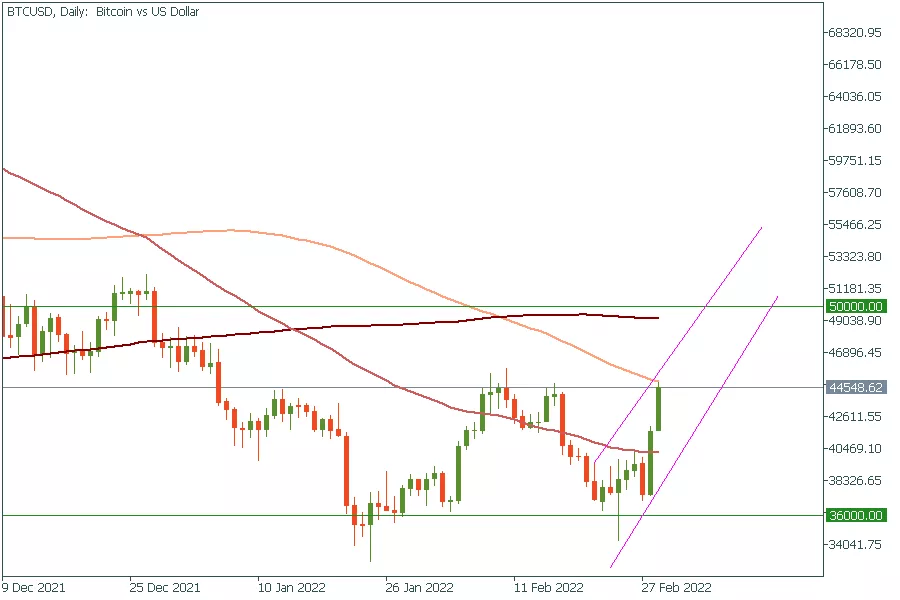
As BTC/USD rebounded from $33,500 and is trying to form a ‘double bottom’, some analysts have started to expect the advance to $50,000 and $51,000. That would be the middle of the range, in which Bitcoin has been trading since the start of 2021. Given the things we’ve outlines in this article, we consider such a scenario quite realistic. Support for BTC/USD is located at $36,000/$35,000.
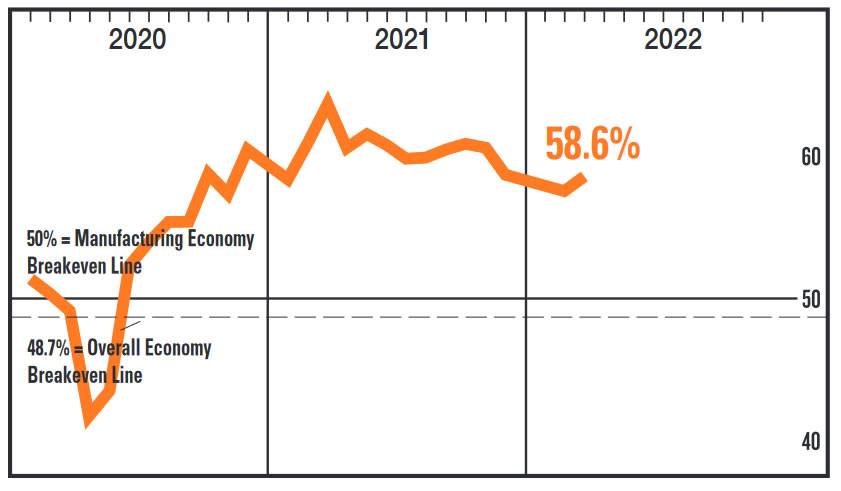
US ISM manufacturing rose to 58.6, corresponds to 3.5% annualized GDP growth
US ISM Manufacturing index rose from 57.6 to 58.6 in February, above expectation of 57.9. Looking at some details, production rose from 57.8 to 58.5. New orders rose from 57.9 to 61.7. Employment dropped from 54.5 to 52.9. Prices dropped from 76.1 to 75.6.
ISM said: "The past relationship between the Manufacturing PMI and the overall economy indicates that the Manufacturing PMI for February (58.6 percent) corresponds to a 3.5-percent increase in real gross domestic product (GDP) on an annualized basis."
Sunset Market Commentary
Markets
Risk aversion this week for the first time really translated in a safe haven bid towards core bonds. Markets decided to take the foot somewhat off the throttle with regards to the early 2022 aggressive repositioning towards fast and bold tightening cycles. It’s not that they completely retrace on their steps, on the contrary. However, especially in Europe the timing of the next ECB meeting comes at an awkward time. The ECB remains in a tough catch-22 position as the Ukrainian conflict aggravates an already worsening inflation problem. Tomorrow, we’ll see another record EMU CPI figure for February (5.6% Y/Y consensus from 5.1% in January). National data beat consensus in France (4.1% Y/Y), Spain (7.5% Y/Y), Belgium (8.04% Y/Y) and today Italy (6.2% Y/Y) and Germany (5.5% Y/Y). On the one hand, the deteriorating inflation situation warrants a continuation of the ECB’s strategic policy U-turn which Lagarde started verbally early February. Back then, she acknowledged upside inflation risks while no longer ruling out the possibility of a 2022 rate hike. On the other hand, it might make sense to delay the official U-turn until April of June for once dust settles in Ukraine. It would still keep the ECB on track to end net asset purchases by the end of Q3 as some ECB governors suggested to enable a Q4 rate hike. Simultaneously, the ECB avoids in the short run to add another layer of uncertainty over already fragile and volatile markets. The jury is still out, but the interest rate action of the past two days at least opens the possibility for some delay. European swap yields since last Friday lost 12 bps (20-yr) to 24 bps (5-yr). Both the EU 2y, 5y and 10y swap rates lost first support at respectively 0.1%, 0.5% and 0.77%. German yields decline by 23 bps (10-yr) to 33 bps (5-yr) over that same time period. The 3-month forward Euribor curve now discounts an end of 2022 rate of -0.15%, down from +0.02% with the end of 2023 market prognosis declining from 0.68% to 0.49%.
The daily recap furthermore shows new losses for European stock markets (2%), rising commodity prices (eg Brent crude > $104/b) and a slightly firmer dollar. EUR/USD relatively easily holds above the important 1.1106/21 support zone. Central-European currencies remain underperformers. EUR/HUF spiked from 370 to new record high of 380 before retracing to 375 after the central bank showed readiness to intervene to ensure stability. EUR/PLN in a similar move spiked to 4.8 before returning lower after MPC Sura said that the NBP would support PLN strengthening. EUR/CZK spiked to 25.50 with the CNB noting that a weaker koruna boosts inflation risks. News Headlines
The reference contract for Wheat on the Chicago Board of trade today jumped about 5.0% to the highest level since March 2008 as investors fear that the conflict between Russia and Ukraine will cause severe and prolonged disruptions in the supplies of the commodity due to the conflict in the region. The disruptions might take the form of a halt of shipments from Ukraine ports over the inability to finish/finance deals with parties in the two countries. The contract trades about 27% higher compared to the start of the year. The war might also complicate planting of crops for the likes of Corn. Corn futures also trade at the highest level since July last year, recording a gain of about 20% for this year.
Growth in Canada in Q4 accelerated from an annualized rate of 5.5% to 6.7% (1.6% Q/Q) according to data published by statistics Canada today. For the 2021 as a whole, real growth posted a strong 4.6% growth after declining 5.2% due to the pandemic in 2020. In Q4, gross fixed capital formation was an important driver for growth (1.9%), both due to residential and non-residential structures. Inventory building also added substantially to growth. Household consumption only rose a modest 0.2% Q/Q. The Bank of Canada will hold a regular policy meeting tomorrow. It is expected to start a rate hike cycle with a 0.25bps hike to 0.50% as the economy is eliminating spare capacity. The loonie today gains a few ticks to trade at USD/CAD 1.267.
Canada’s Economy Closes the Year on a High Note
The Canadian economy expanded by 6.7% q/q annualized in the final quarter of 2021, leaving real GDP for 2021 at a robust 4.6%.
A big driver of growth was the accumulation of business inventories (easing of supply chains), which grew by $11 billion (adding 4.2 percentage points to annualized growth).
International trade also grew at a decent clip, with exports up 13.4% (annualized) and imports rising by 14.4%. This was driven by increased motor vehicle production.
Household consumption came in at a disappointing 1% (annualized), as Canadians reduced spending on goods in favour of services.
Business investment grew at 7.9%, with residential structures up 10.2% and machinery and equipment up 4.7%.
Key Implications
The Canadian economy ended 2021 on a high note, with real GDP sitting just above pre-pandemic levels.
Strong growth at the end of the year provided a solid handoff to the new year, but the start to 2022 has been less than ideal. With the Omicron wave and subsequent lockdowns, we are tracking 2022 Q1 at just above zero growth. That said, the economy is bouncing back as restrictions have been eased. This should set up Canada to outperform over the remainder of 2022.
For the Bank of Canada, this report justifies its view that the economy has fully recovered the slack caused by the pandemic. The Bank will have this report in its back pocket as it prepares to lift the overnight rate tomorrow in spite of ongoing geopolitical risks.
Russia off from SWIFT will have a positive impact on crypto
Bitcoin made a powerful leap up after assurances from the owners of the largest crypto exchanges, Binance, Kraken, KuCoin and AAX, that they do not intend to block the funds of individual Russians. However, the head of Kraken warned that they would abide by the regulator’s decision if it comes.
Overnight, the United States noted that they would stop attempts to use cryptocurrencies to circumvent personal sanctions. So, retail clients of large crypto exchanges are not yet afraid for their funds. This probably explains the latest growth momentum.
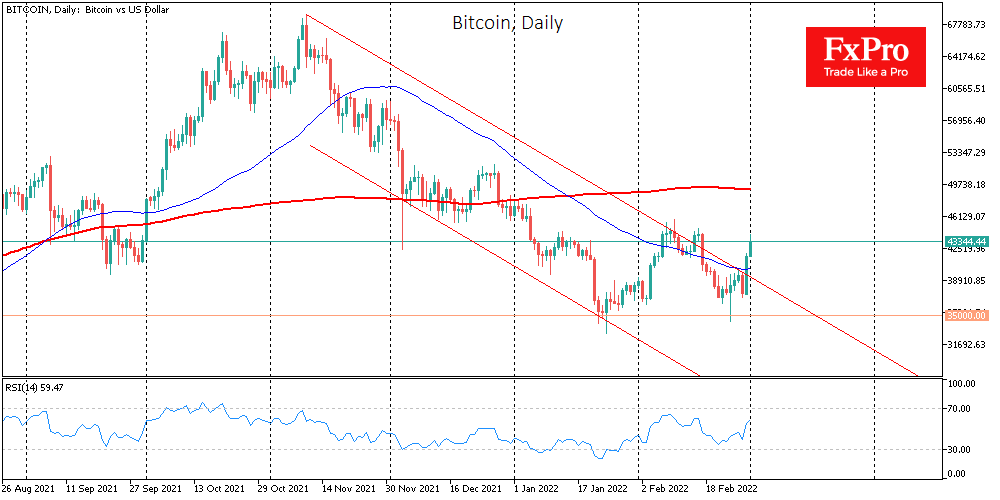
Technically, Bitcoin broke through the upper limit of the four-month descending channel at the close of the month. Moderate optimism of Asian and US indices is also on the side of buyers.
February was confirmed to be a growing month for bitcoin. However, March is not so favourable. Over the past 11 years, BTC ended this month with growth only in two cases.
Disabling Russia from SWIFT will have a positive impact on the cryptocurrency market, says Jiang Zhuer, CEO of the BTC.TOP pool. In his opinion, Russia can use various methods to circumvent restrictions, including digital assets, to make payments.
Bank of America does not see the prerequisites for a large-scale crypto winter, as evidenced by the dynamics of the movement of cryptocurrencies between private and exchange wallets. The level of acceptance of crypto assets by users is also growing, as well as the activity of developers.
Bitcoin jumped 10.8% on Monday to $41,600, the highest gain in five months. On Tuesday morning, the momentum continued with a jump to $44,000 at the start of the day. At the time of writing, prices have stabilized around $43,200. Ethereum added 7.9%, while other top-ten altcoins rose from 6.3% (XRP) to 15.3 % (Terra).
The total capitalization of the crypto market, according to CoinMarketCap, grew by 11% over the day, to $1.9 trillion. The Bitcoin dominance index has risen to 43% due to the smaller strengthening of altcoins.
The crypto-currency fear and greed index soared 31 points to 51 on the day, moving out of fear into neutral territory.
Although Bitcoin showed negative dynamics for most of the month, the shocking growth at the end of it allowed BTC to end February with strengthening (+8.6%) after three months of decline.
Ukraine Resolution Fails, and Putin Intensifies Attacks
Risk-off mood returns, US ISM manufacturing ahead
It seems the next weeks will be pivotal for volatility as Russia declared it would continue its attacks until its goals were met. The retreat in US stock futures is signalling a risk-off mood, and the USD/JPY pair is also expressing some risk-off tendencies, slipping to 114.80.
That said, the dollar index is holding above the 97.00 mark and should risk appetite continue to wane, it appears the way up for the greenback is likely, especially if investors remain drawn to its haven appeal. The euro is testing the $1.1140 level, but the pound is faring better against the greenback, hovering just beneath the $1.3400 mark.
President Putin appears to be unphased by the sanctions from the West and has taken steps of his own in response. The time cycle of these geopolitical risks is unclear, but for now the Russian President has banned all foreign currency transfers abroad, applied capital controls and kept the stock exchange closed.
The latter is feeding the risk that Russia’s stocks and bonds could be kicked out of major investment benchmarks should trading access remain limited.
Nonetheless, US ISM Manufacturing PMI data is due at 15:00 GMT today and is expected to come in at 58.0 versus the January’s figure of 57.6. The ISM employment and prices components could paint a clearer picture, which were at 54.5 and 76.1 in January. Construction spending is also key and is expected at 0.2% m/m.
Commodity price pressures and trade, RBA holds
The Australian Industry Group performance of manufacturing index came in at 53.2, suggesting an industry expansion down under, despite supply chain problems, shipping constraints and surges in freight costs, which are still affecting trade.
Meanwhile, petrol prices are at record highs and the conflict in Ukraine is adding to uncertainty in markets, inflation being one of them, which has further underpinned many commodity prices. Australia’s export earnings are highly reliant on commodity prices.
Nonetheless, with inflation expectations now around 5.3%, the RBA has kept the cash rate target at 10 basis points, commenting that they will not increase the rate until inflation is sustainable within their 2-3% target range. The emphasis was directed to worries about how persistent elevated inflation will be due to changes in global energy markets and supply issues. The aussie has gained strength and is flirting with the February 23 high of 0.7283.
Chinese manufacturing and service PMI data for February showed renewed improvement in business conditions with the gauges for both output and total new orders returning modestly into expansionary territory. Total sales in China rose despite the decline in new export business linked to the pandemic and difficulties in shipping. However, a pickup in demand conditions has aided output in February despite inflationary pressures in both input prices and output charges.
Australia exports heavily to China, and with demand expectations in China improving, there may be some risk in terms of whether the country delays purchase of commodities should prices remain elevated or run higher due to price pressures. This could seem far-fetched, but it may be one aspect to consider for the aussie failing to sustain strength, along with negative developments from Ukraine and further flows into the safe-haven dollar.
Gold is sustaining its shine, currently trading around $1,925/oz and should the Ukraine conflict drag out, the precious metal may reel in the $1,950/oz price zone. If US 10-year yields slip lower again, this could support the move.
Canadian GDP and the black liquid
In January the BoC held off from hiking its interest rate as officials were wary of the Omicron strain, but the bank highlighted that the slack in the economy was overturned and reiterated that this triggered a policy shift towards rates moving higher. Canada’s Q4 GDP data today was essentially unchanged in December 2021, resisting a 0.1% forecast as growth in services-producing industries by 0.1% was nullified by a drop in goods-producing industries by 0.1%. That said, the seasonally adjusted annual rate beat expectations of 6.5%, coming in at 6.7%. Its February Manufacturing PMI is due at 14:45 GMT. However, this is unlikely to alter the expected 25 basis points hike expected in tomorrow’s meeting. The loonie is currently around C$1.2670.
WTI oil futures have creeped back to the $100.00 per barrel mark and the picture for oil seems to remain a bullish one, with consumers looking to feel the brunt of high fuel prices and inflation as the Ukraine crisis prolongs.
UK’s MPC Member Saunders is due to speak at 18:30 GMT followed by Member Mann at 19:00 GMT.
EUR/USD Mid-Day Outlook
Daily Pivots: (S1) 1.1149; (P) 1.1197; (R1) 1.1269; More...
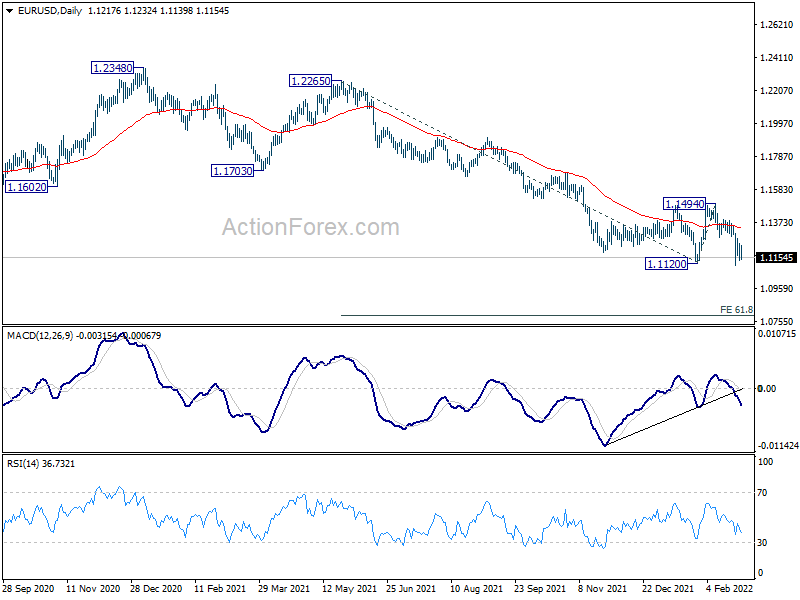
EUR/USD is staying in consolidation from 1.1105 and intraday bias remains neutral first. Further fall is expected with 1.1287 resistance intact. On the downside, sustained break of 1.1120 will confirm resumption of larger down trend from 1.2348. Next target is 61.8% projection of 1.2265 to 1.1120 from 1.1494 at 1.0786. However, firm break of 1.1287 will dampen this bearish view and turn bias back to the upside for 1.1494 resistance.
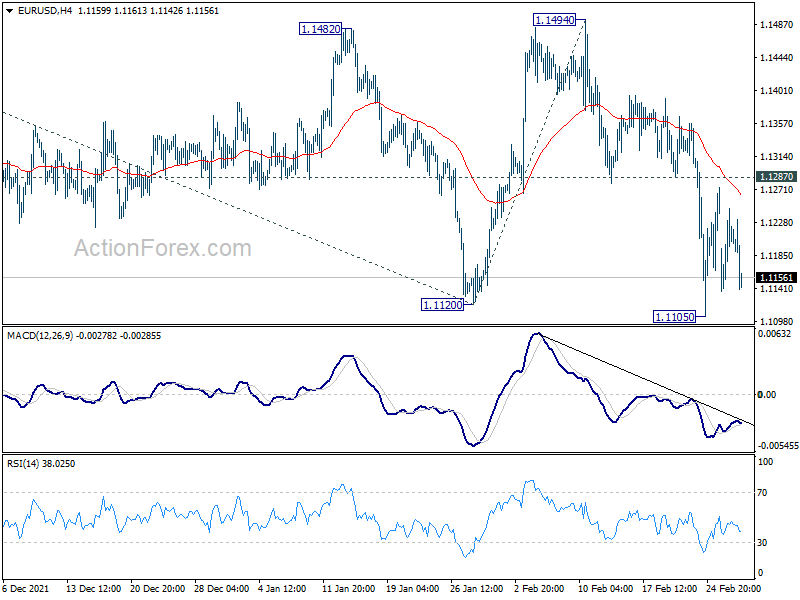
In the bigger picture, the decline from 1.2348 (2021 high) is seen as a leg inside the range pattern from 1.2555 (2018 high). Sustained trading above 55 week EMA (now at 1.1582) will argue that it has completed and stronger rise would be seen back towards top of the range between 1.2348 and 1.2555. However, firm break of 1.0635 (2020 low) will raise the chance of long term down trend resumption and target a retest on 1.0339 (2017 low) next.