Sample Category Title
GBP/USD Daily Outlook
Daily Pivots: (S1) 1.3495; (P) 1.3534; (R1) 1.3572; More...
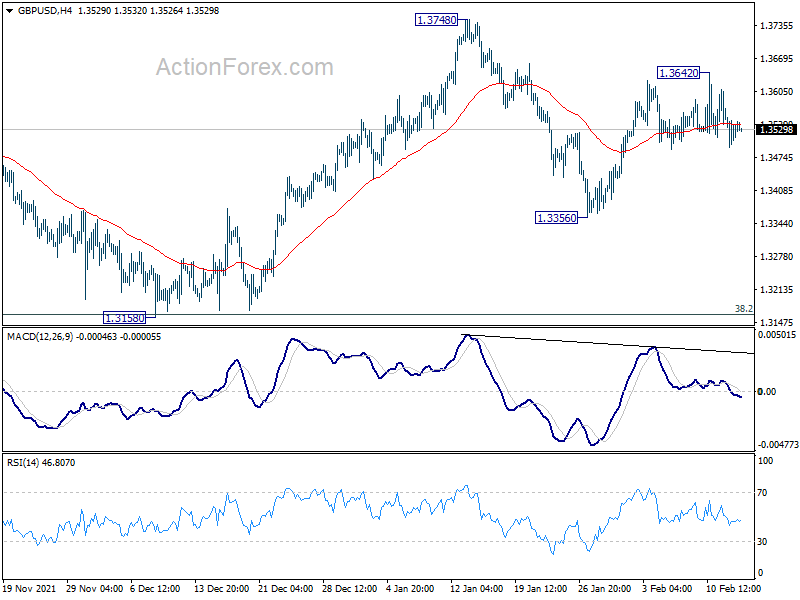
Range trading continues in GBP/USD and intraday bias remains neutral. On the upside, break of 1.3642 will resume the rebound to 1.3748 resistance. Firm break there will revive the bullish case that correction from 1.4248 has completed with three waves down to 1.3158. Further rally should then be seen to retest 1.4248 high. On the downside, however, break of 1.3356 will bring retest of 1.3158 low.
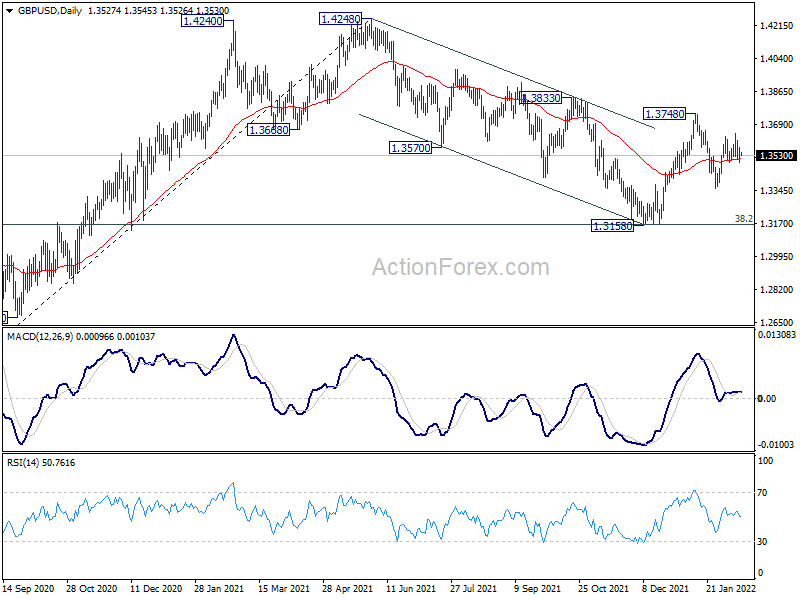
In the bigger picture, as long as 38.2% retracement of 1.1409 to 1.4248 at 1.3164 holds, up trend from 1.1409 (2020 low) is still in progress. On resumption, next target will be 38.2% retracement of 2.1161 to 1.1409 at 1.5134. Nevertheless sustained break of 1.3164 will argue that whole rise from 1.1409 has completed and bring deeper fall to 61.8% retracement at 1.2493.
USD/CHF Daily Outlook
Daily Pivots: (S1) 0.9231; (P) 0.9252; (R1) 0.9265; More....
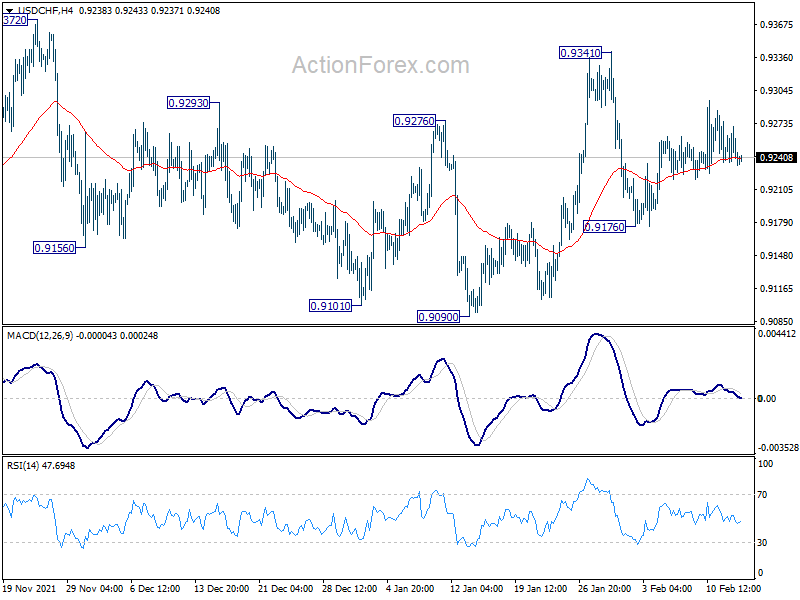
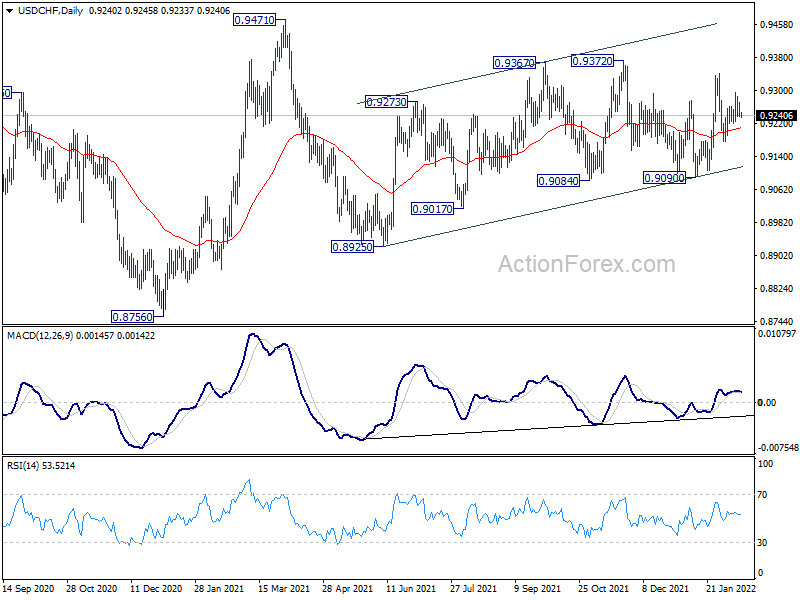
Intraday bias in USD/CHF remains neutral and outlook is unchanged. Overall, further rally is mildly in favor as long as 0.9090 support holds. On the upside, break of 0.9372 will resume the choppy rally from 0.8925 to 0.9471 high. However, break of 0.9090 will turn bias back to the downside for 0.8925 support instead.
In the bigger picture, medium term outlook will be neutral at best as long as 0.9471 resistance holds. Larger down trend could still extend through 0.8756 (2021 low). However, firm break of 0.9471 will argue that the trend has already reversed and rebound the rally from 0.8756 with another impulsive move.
USD/JPY Daily Outlook
Daily Pivots: (S1) 115.12; (P) 115.43; (R1) 115.86; More...
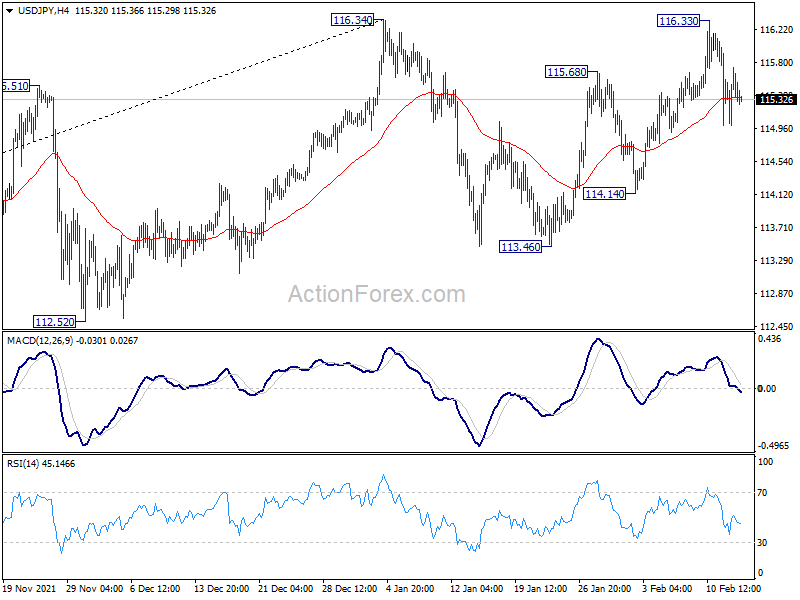
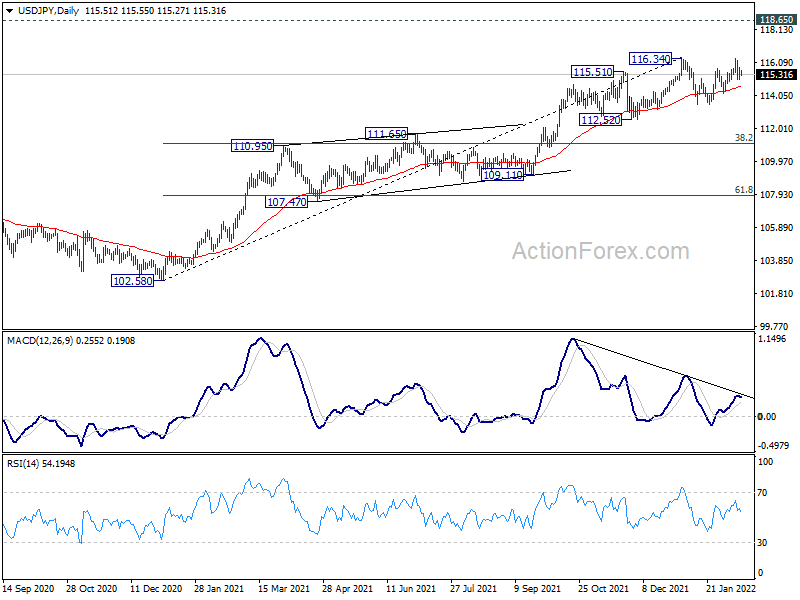
No change in USD/JPY's outlook and intraday bias stays mildly on the downside. Corrective pattern from 116.34 is in its third leg. Deeper fall would be seen to 114.14 support first. Break will target 113.46 next. On the upside, firm break of 116.34 will resume larger up trend from 102.58. Next target is 118.65 long term resistance.
In the bigger picture, no change in the view that rise from 102.58 is the third leg of the up trend from 101.18 (2020 low). Such rally should target a test on 118.65 (2016 high). Sustained break there will pave the way to 120.85 (2015 high) and raise the chance of long term up trend resumption. This will remain the favored case as long as 55 week EMA (now at 111.21) holds.
AUD/USD Daily Report
Daily Pivots: (S1) 0.7092; (P) 0.7122; (R1) 0.7157; More...
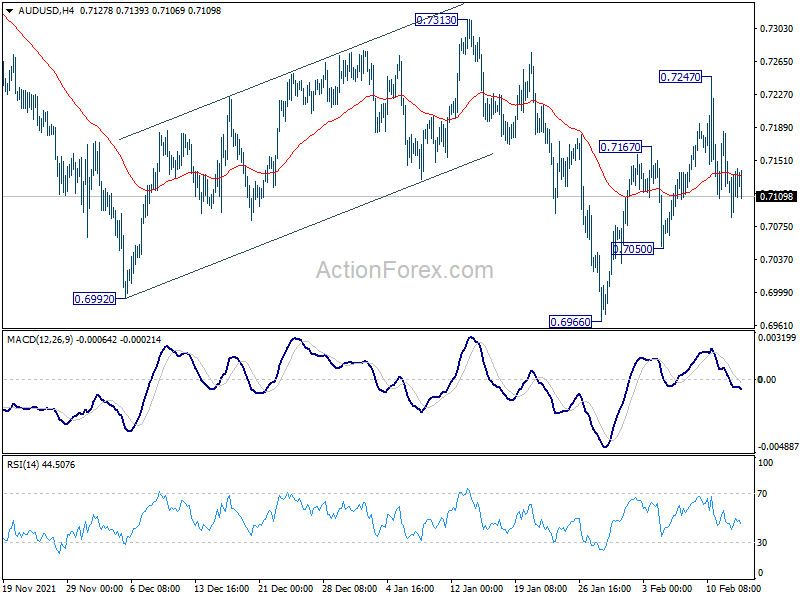
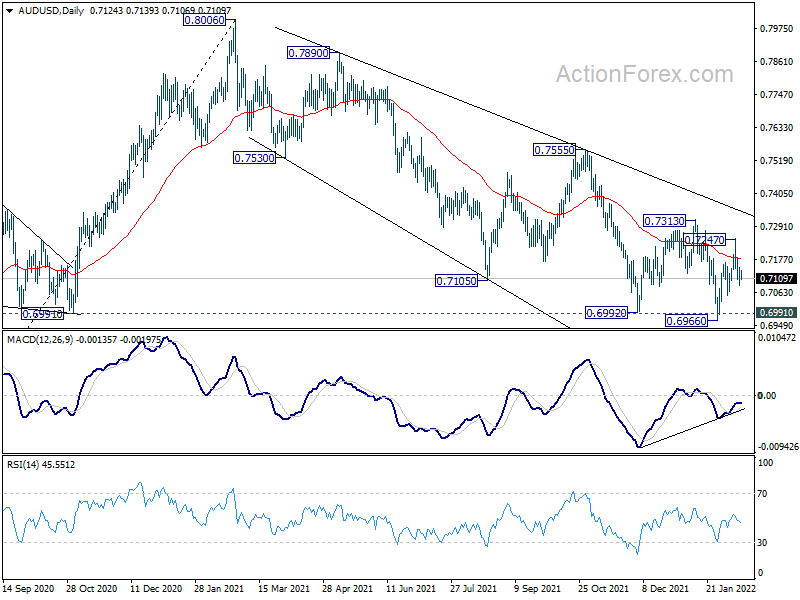
Intraday bias in AUD/USD remains neutral and outlook is unchanged. Further rise would remain mildly in favor as long as 0.7050 support holds. Above 0.7247 will target 0.7313 resistance. Decisive break there argue that correction from 0.8006 has completed at 0.6966, after hitting 0.6991 key support. Outlook will be turned bullish for 0.7555 resistance next. On the downside, however, break of 0.7050 support will bring retest of 0.6966 low instead.
In the bigger picture, focus remains on 0.6991 key structural support. Sustained break there will argue that the whole up trend from 0.5506 might be finished at 0.8006, after rejection by 0.8135 long term resistance. Deeper decline would then be seen back to 61.8% retracement of 0.5506 to 0.8006 at 0.6461. Meanwhile, strong rebound from 0.6991 will retain medium term bullishness. That is, whole up trend from 0.5506 is still in progress.
USD/CAD Daily Outlook
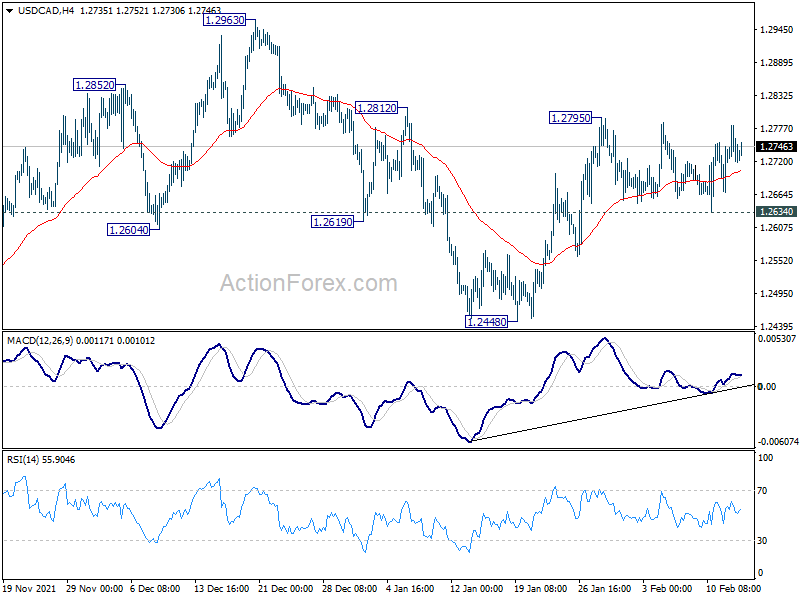
Daily Pivots: (S1) 1.2703; (P) 1.2743; (R1) 1.2767; More...
Range trading continue sin USD/CAD and intraday bias stays neutral. Further rally is mildly in favor with 1.2634 support intact. On the upside, break of 1.2795 will resume the rally from 1.2448 to 1.2963 resistance next. However, break of 1.2634 support will turn bias back to the downside for 1.2448 support instead.
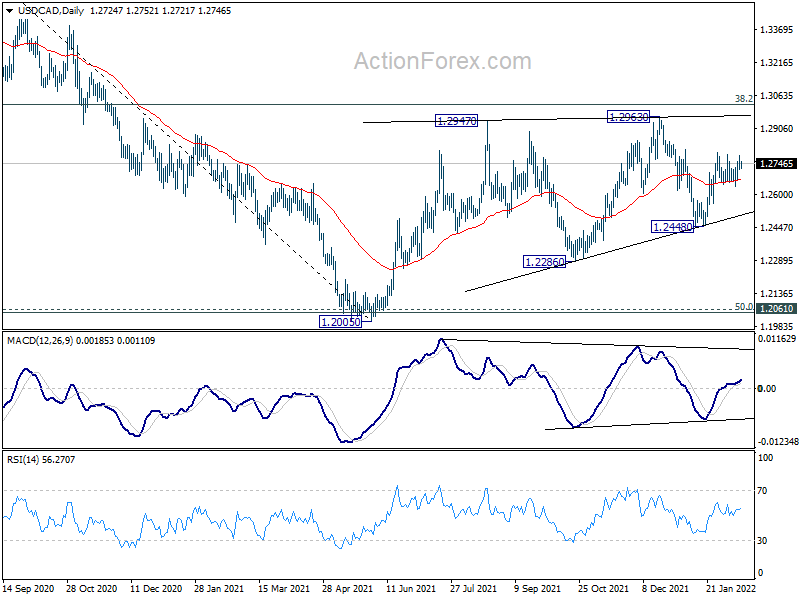
In the bigger picture, focus stays on 38.2% retracement of 1.4667 (2020 high) to 1.2005 (2021 low) at 1.3022. Sustained break there should confirm that the down trend from 1.4667 has completed after defending 1.2061 long term cluster support. Further rise would then be seen towards 61.8% retracement at 1.3650. However, rejection by 1.3022 will maintain medium term bearishness. Break of 1.2005 will resume the down trend from 1.4667 and that carries larger bearish implications too.
GBP/JPY Daily Outlook
Daily Pivots: (S1) 155.50; (P) 156.18; (R1) 157.06; More...
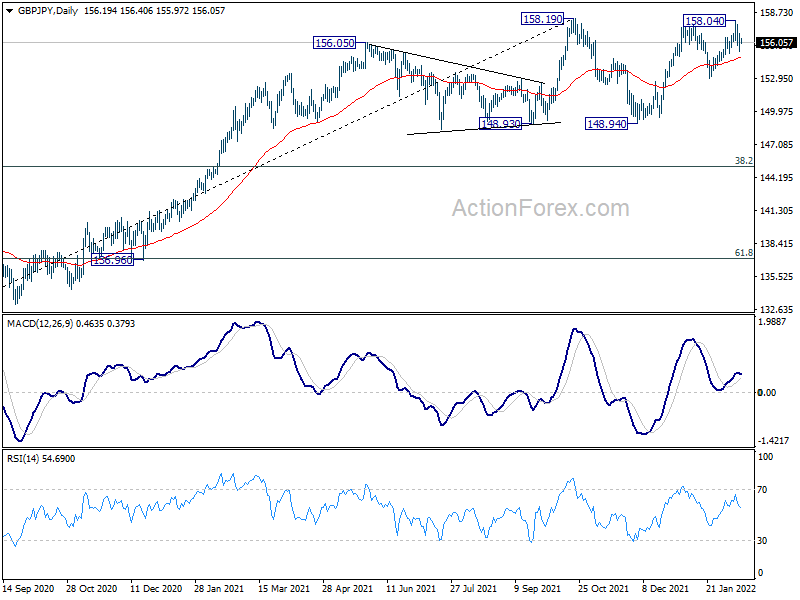
Intraday bias in GBP/JPY stays neutral at this point. On the downside, break of 155.11 resistance should confirm rejection by 158.19 resistance. Intraday bias will be turned to the downside for 152.88 support, to extend the corrective pattern from 158.19 with another falling leg. However, on the upside, sustained break of 158.19 will resume larger up trend.
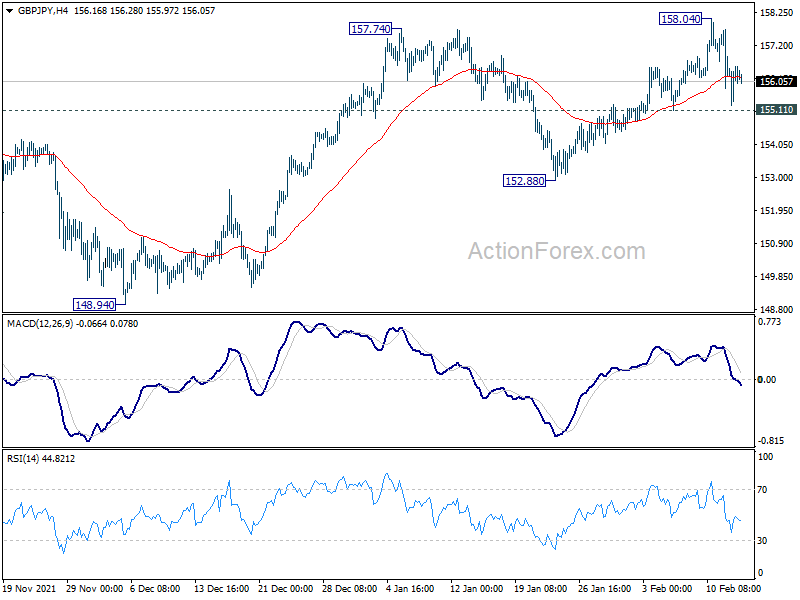
In the bigger picture, price actions from 158.19 are seen as developing into a consolidation pattern to up trend from 123.94 (2020 low). Downside should be contained by 123.94 to 158.19 at 145.10 to bring rebound. Firm break of 158.19 will resume the up trend to long term fibonacci level at 167.93. However, sustained break of 145.10 will raise the chance of trend reversal and target 61.8% retracement at 137.02.
EUR/JPY Daily Outlook
Daily Pivots: (S1) 130.00; (P) 130.70; (R1) 131.34; More....
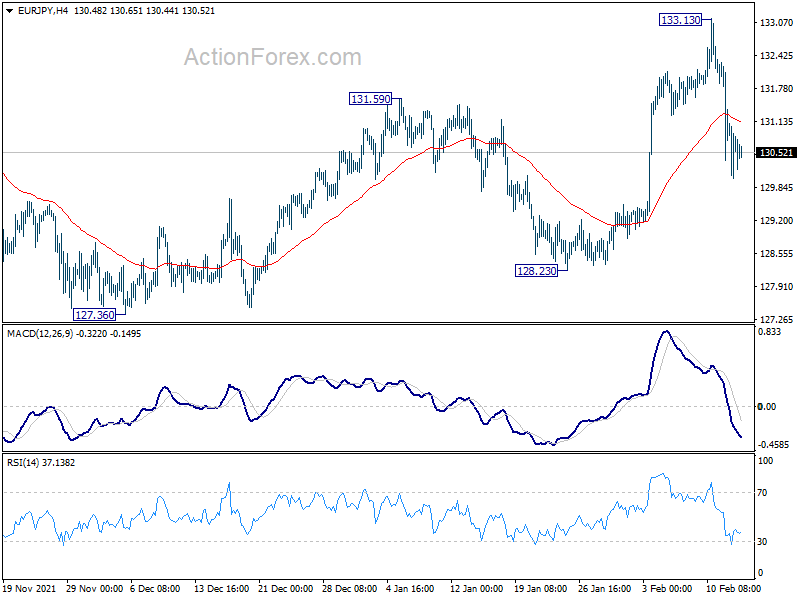
Intraday bias in EUR/JPY remains on the downside and outlook is unchanged. Corrective pattern from 134.11 is extending with another falling leg. Deeper fall would be seen to 128.23 support first. break will target 127.36 support and below. On the upside break of 133.13 will bring retest of 134.11 high.
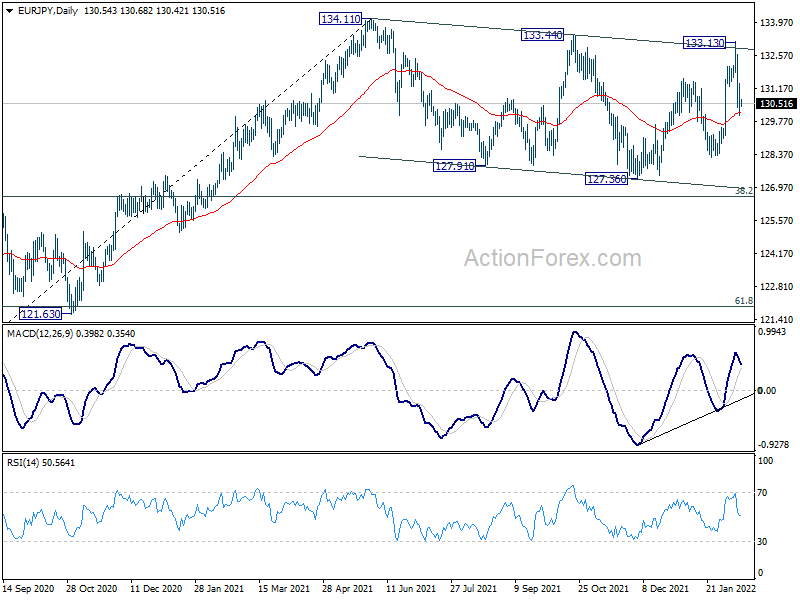
In the bigger picture, price actions from 134.11 are currently seen as a consolidation pattern only. As long as 38.2% retracement of 114.42 (2020 low) to 134.11 at 126.58 holds, up trend from 114.42 is still in favor to continue. Break of 134.11 will target long term resistance at 137.49 (2018 high). However, sustained break of 126.58 will raise the chance of bearish reversal. In this case, deeper decline would be seen to 61.8% retracement at 121.94, and possibly below.
EUR/GBP Daily Outlook
Daily Pivots: (S1) 0.8339; (P) 0.8363; (R1) 0.8379; More...
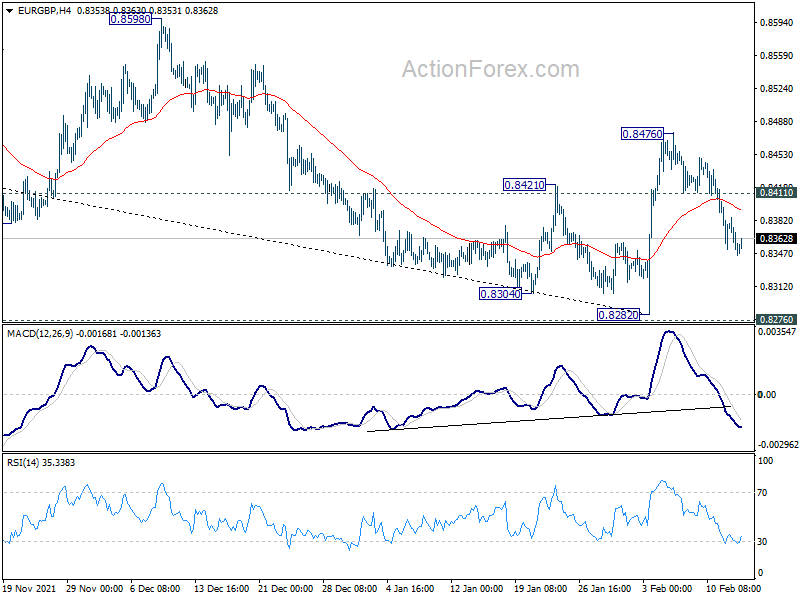
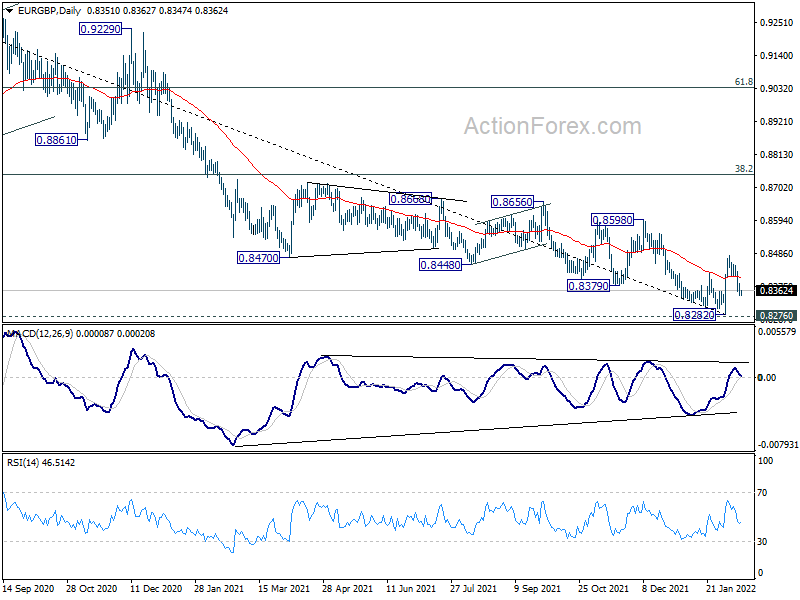
EUR/GBP's fall from 0.8476 is still in progress and intraday bias stays on the downside for retesting 0.8282 low. Sustained break of 0.8276 key long term support will carry larger bearish implication. On the upside, above 0.8411 minor resistance will turn bias back to the upside for 0.8476 resistance. Break there will resume the rebound from 0.8282.
In the bigger picture, price actions from 0.9499 (2020 high) are still seen a corrective pattern that should be contained by 0.8276 long term support (2019 low). Bullish convergence condition in daily MACD and break of 55 day EMA raises the chance that it might be completed. Sustained trading above 38.2% retracement of 0.9499 to 0.8282 at 0.8747 will affirm this bullish case. However, sustained break of 0.8276 will argue that the long term trend has reversed.
EUR/AUD Daily Outlook
Daily Pivots: (S1) 1.5841; (P) 1.5922; (R1) 1.5983; More...
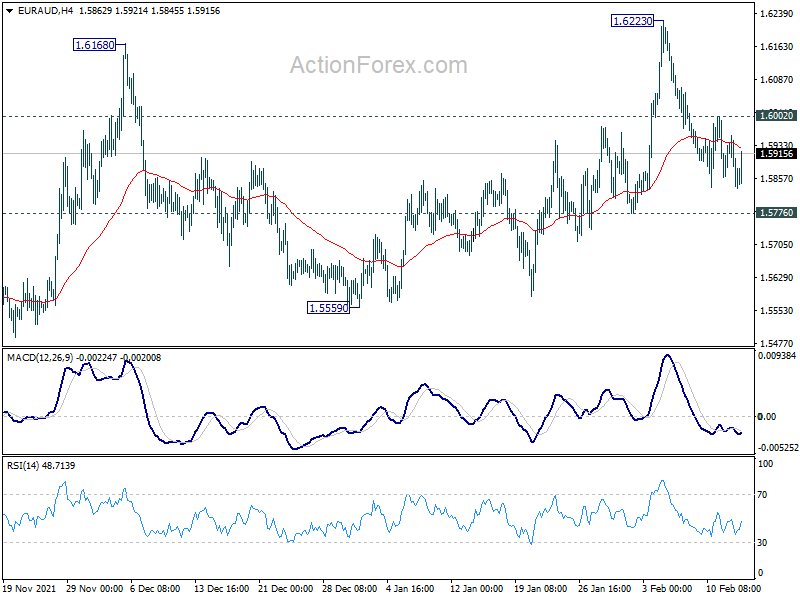
Intraday bias in EUR/AUD stays neutral for the moment. As long as 1.5776 minor support holds, further rise remains mildly in favor. Above 1.6002 will turn bias to the upside for 1.6223 resistance first. However, on the downside, break of 1.5776 will turn bias back to the downside for 1.5559 support instead.
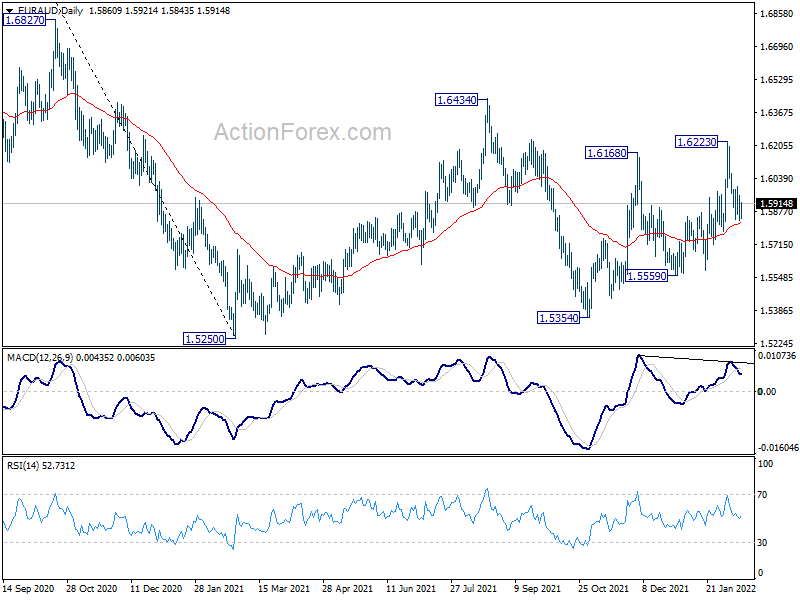
In the bigger picture, rise from 1.5354 is seen as the third leg of the corrective pattern from 1.5250 low. Further rise cannot be ruled out, but even in that case, strong resistance should be seen at 38.2% retracement of 1.9799 to 1.5250 at 1.6988. Larger down trend from 1.9799 is in favor to extend through 1.5250 at a later stage.
Technical Outlook and Review
DXY:
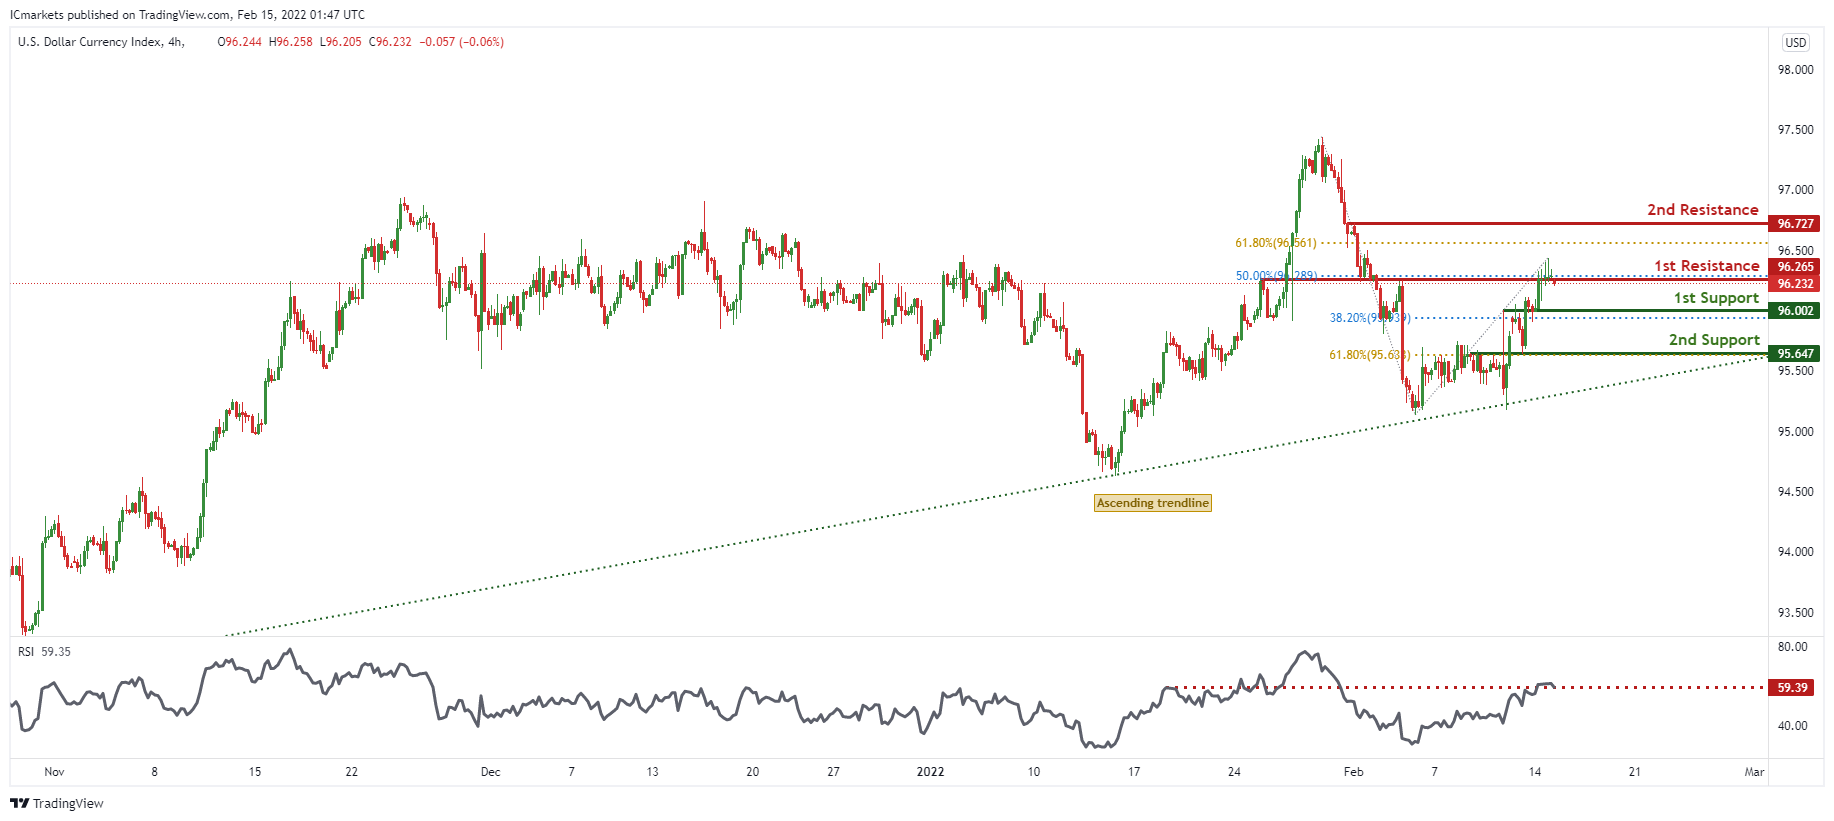
On the H4 timeframe, prices are abiding by a daily ascending trendline and are on bullish momentum. We see the potential for a pullback from our 1st resistance at 96.265 in line with 50% Fibonacci retracement and graphical overlap towards our 1st support at 96.002 in line with 38.2% Fibonacci retracement. Our bearish bias is further supported by our RSI being at levels where dips previously occurred.
Areas of consideration:
- H4 time frame, 1st resistance at 96.265
- H4 time frame, 1st support at 96.002
XAU/USD (GOLD):
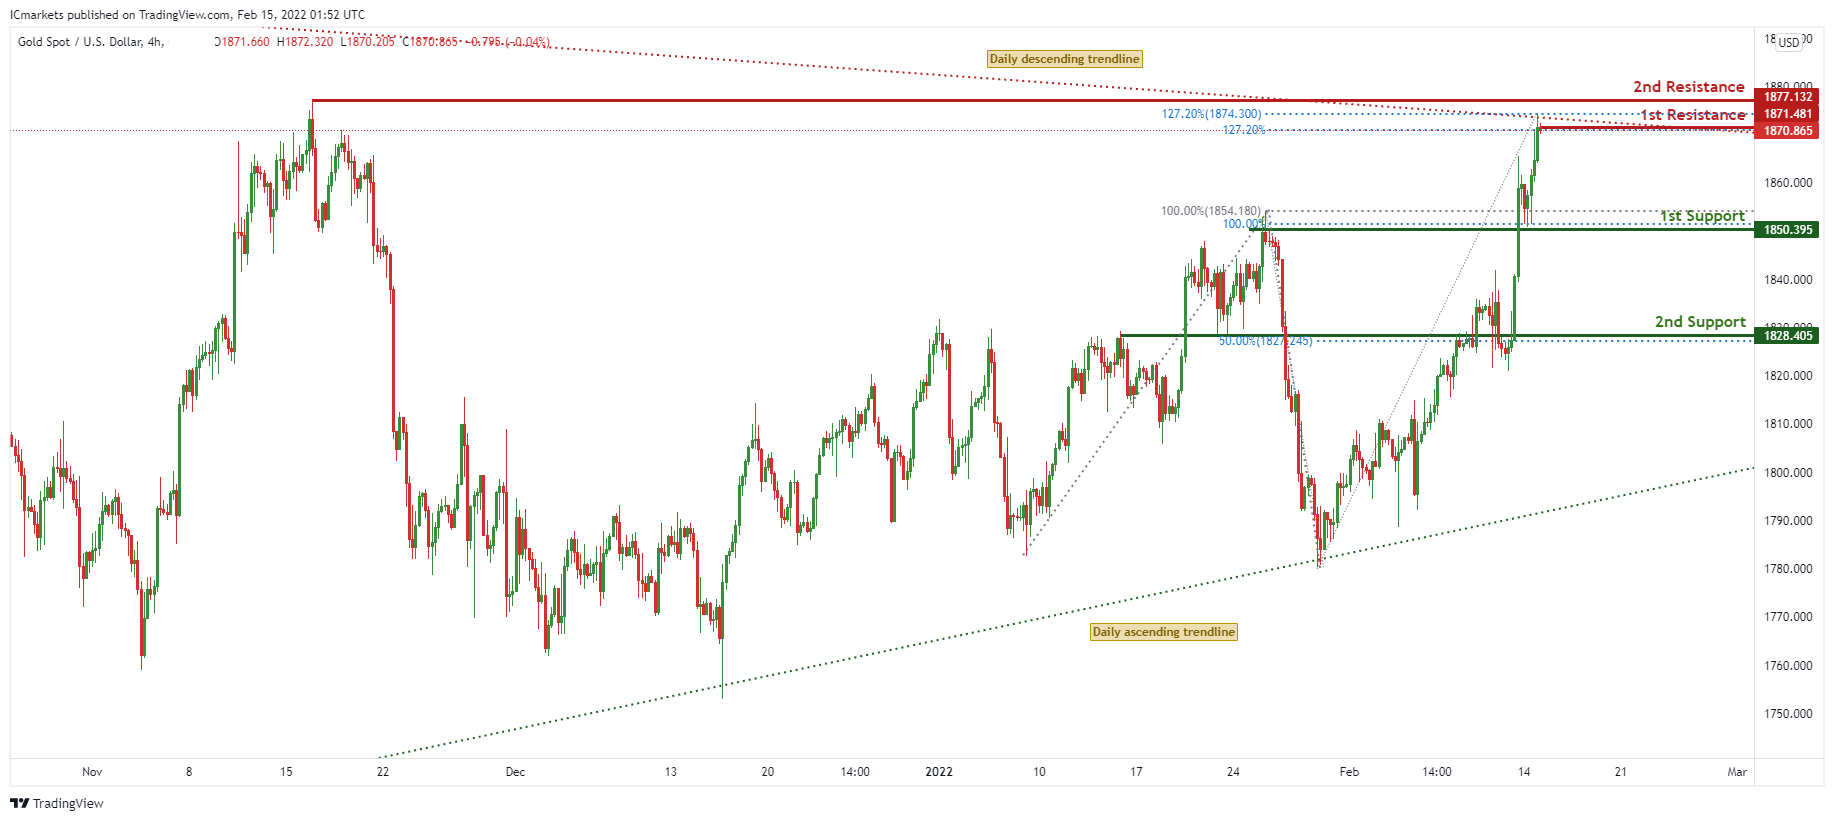
On the H4 chart, prices are on bullish momentum and have approached the edge of our daily descending trendline. We see potential for a pullback from our 1st resistance at 1871.481 in line with 127.2% Fibonacci extension and 127.2% Fibonacci expansion towards our 1st support at 1850.395 in line with 100% Fibonacci retracement and 100% Fibonacci extension.
Areas of consideration:
- 4h 1st support at 1850.395
- 4h 1st resistance at 1870.865
GBP/USD:
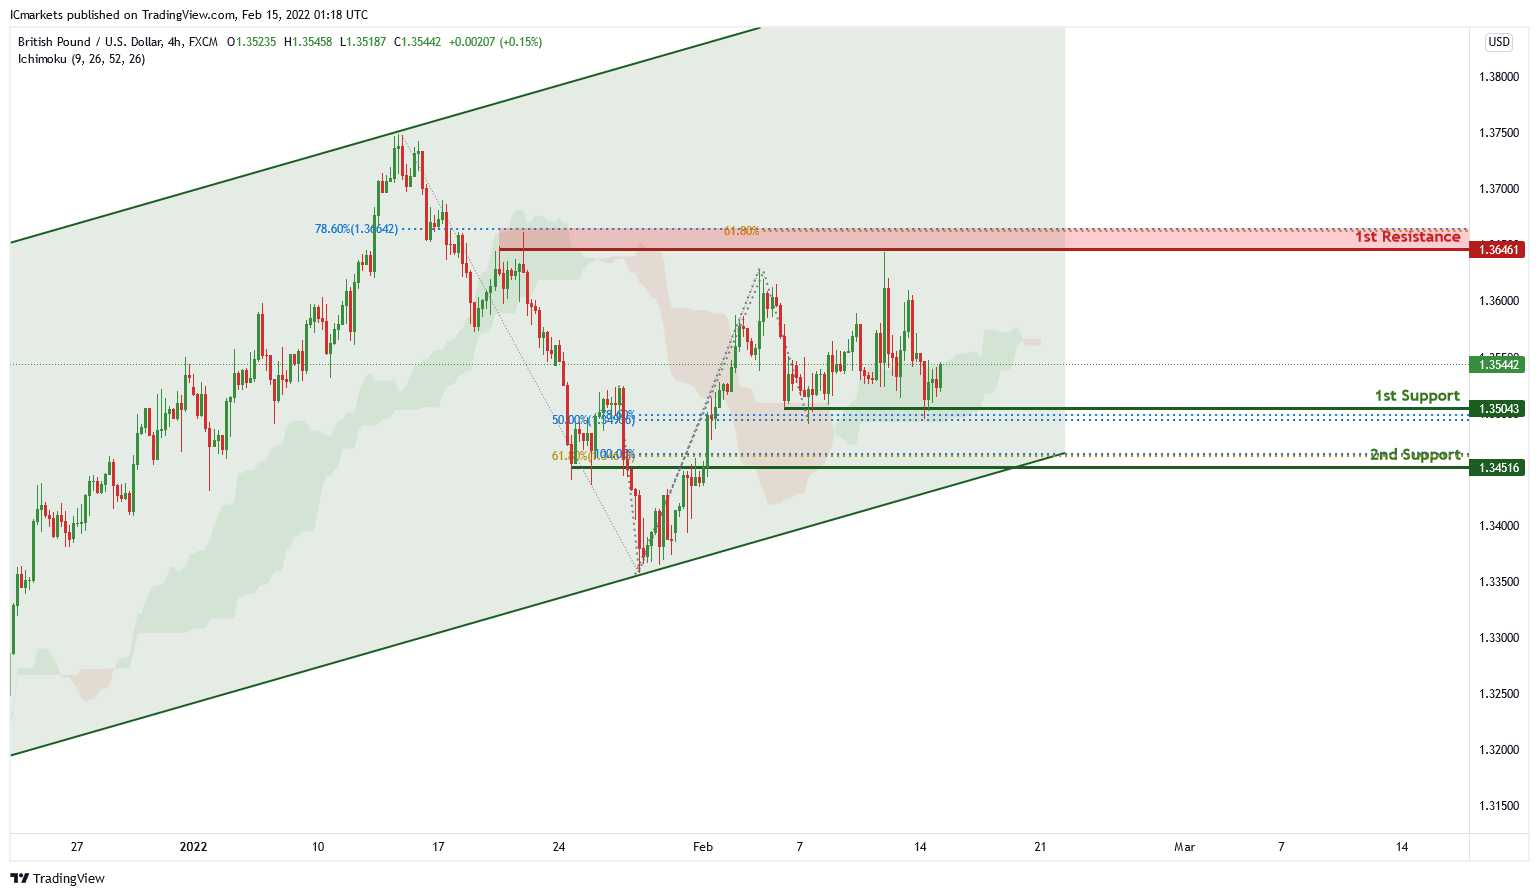
In the H4 chart , price is trading in an ascending channel and near 1st support level of 1.35043 which is also 50% Fibonacci retracement and 78.6% Fibonacci projection. Price can potentially continue its bullish momentum to the 1st resistance level of 1.36461 in line with 61.8% Fibonacci projection and 78.6% Fibonacci retracement. Our bullish bias is supported by the ichimoku cloud indicator as price is trading above it.
Areas of consideration:
- H4 1st resistance 1.36461
- H4 1st support 1.35043
USD/CHF:
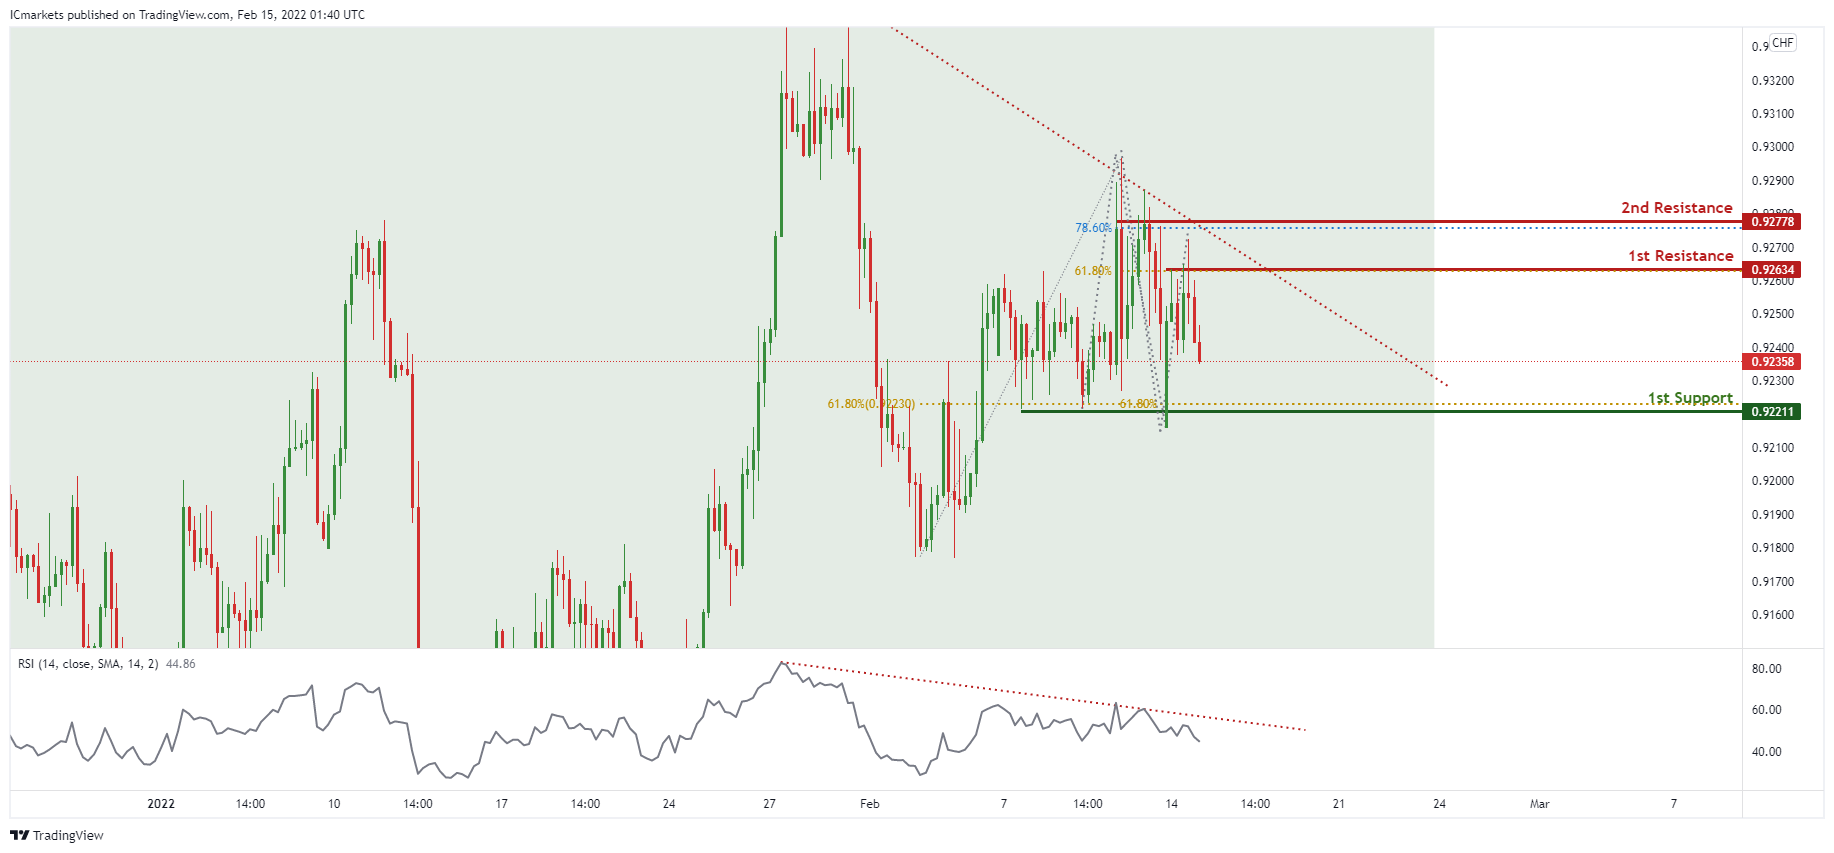
On the H4 timeframe, price is abiding to the daily ascending channel and descending trendline resistance on the H4. We can expect the price to drop from 1st Resistance in line with 61.8% Fibonacci projection towards 1st Support in line with 61.8% Fibonacci projection and 61.8% Fibonacci retracement. Our bearish bias is further supported by the RSI indicator where it is abiding to the descending trendline resistance. Traders should wait for prices to swing higher or lower before entering.
Areas of consideration:
- Watch 1st Support at 0.92211
- Watch 1st Resistance at 0.92634
EUR/USD :
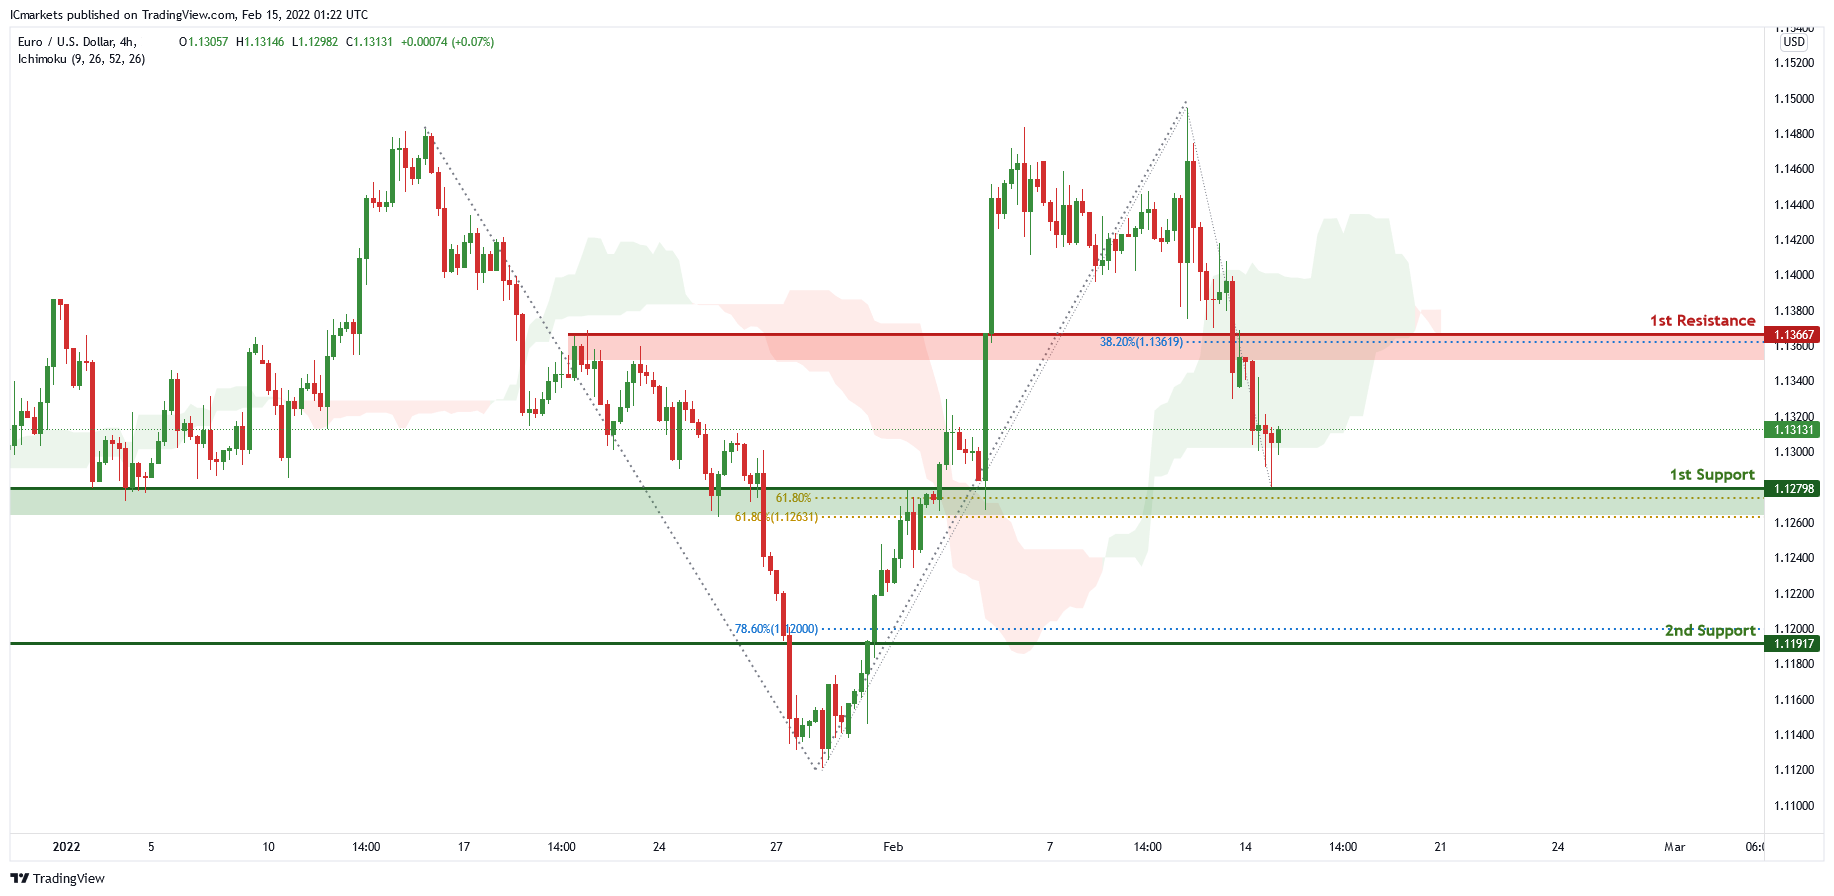
On the H4 chart, price is near 1st support level of 1.12798 in line with 61.8% Fibonacci retracement and 61.8% Fibonacci projection. Price can potentially bounce from this level to the 1st resistance which is also 38.2% Fibonacci retracement and graphical overlap resistance. Our bullish bias is supported by the ichimoku cloud indicator.
Areas of consideration:
- H4 1st resistance at 1.13611
- H4 1st support at 1.12798
USD/JPY:
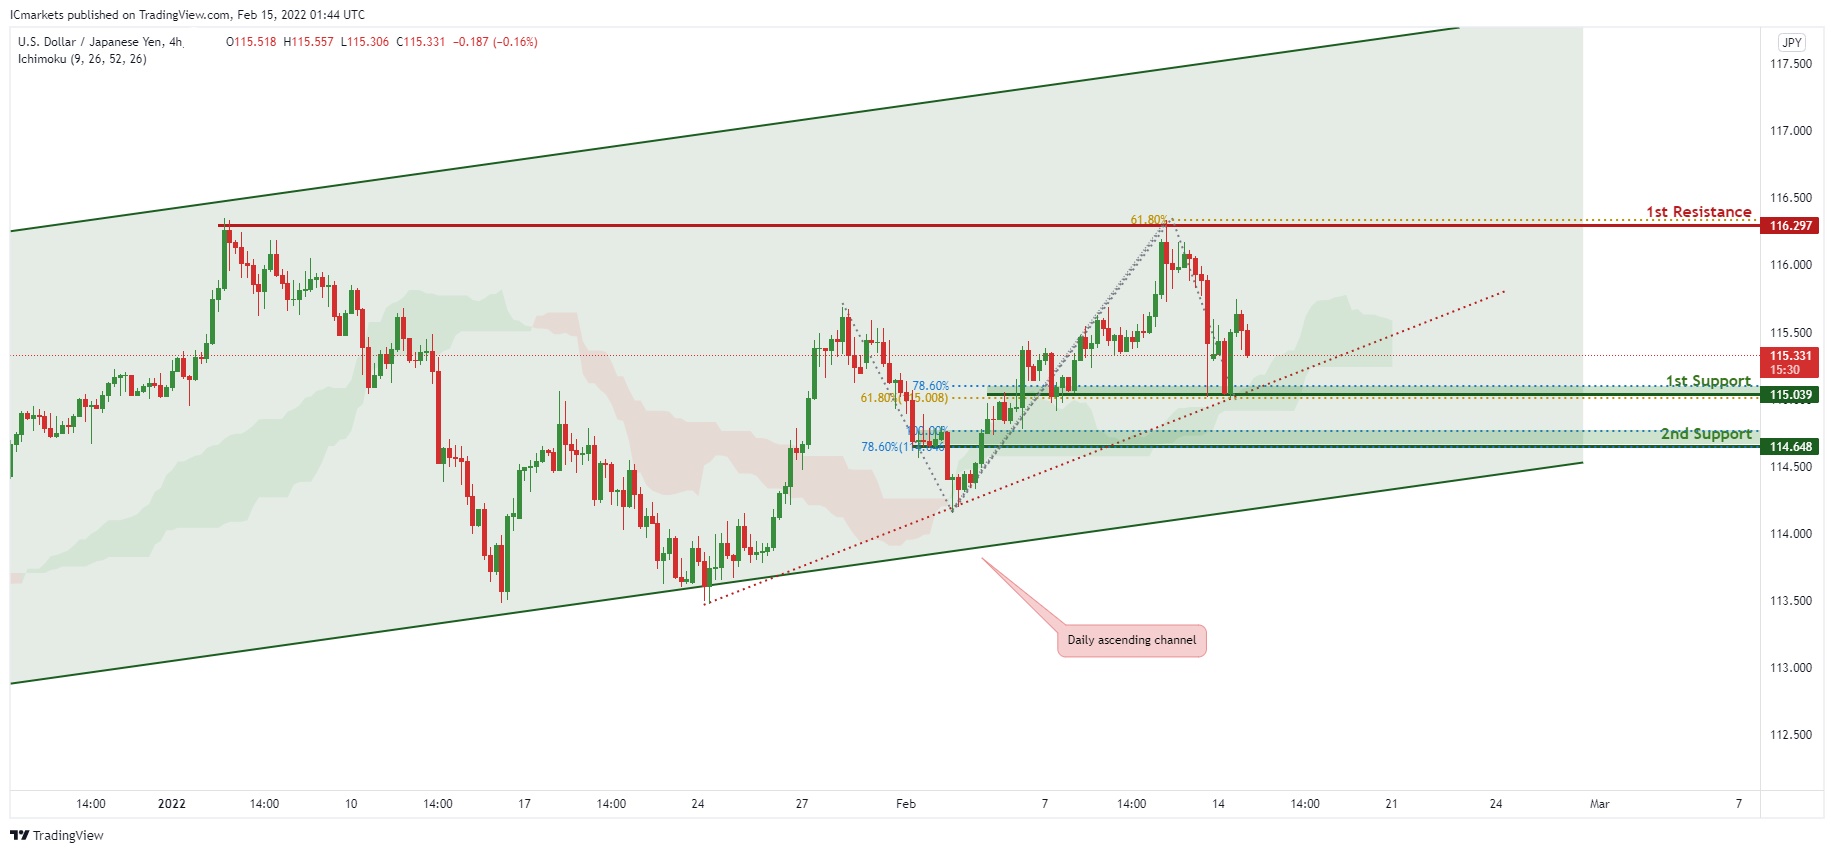
On the H4 chart, price is abiding to the ascending trendline support and the ascending channel on the daily, signifying an overall bullish momentum. We can expect price to bounce at the 1st Support level in line with 78.6% FIbonacci projection ,61.8% Fibonacci retracement and trendline support towards 1st Resistance in line with 61.8% Fibonacci projection and swing high resistance. Our bullish bias is further supported by the Ichimoku cloud acting as a support.
Areas of consideration:
- H4 1st support at 115.039
- H4 1st resistance at 116.297
AUD/USD:
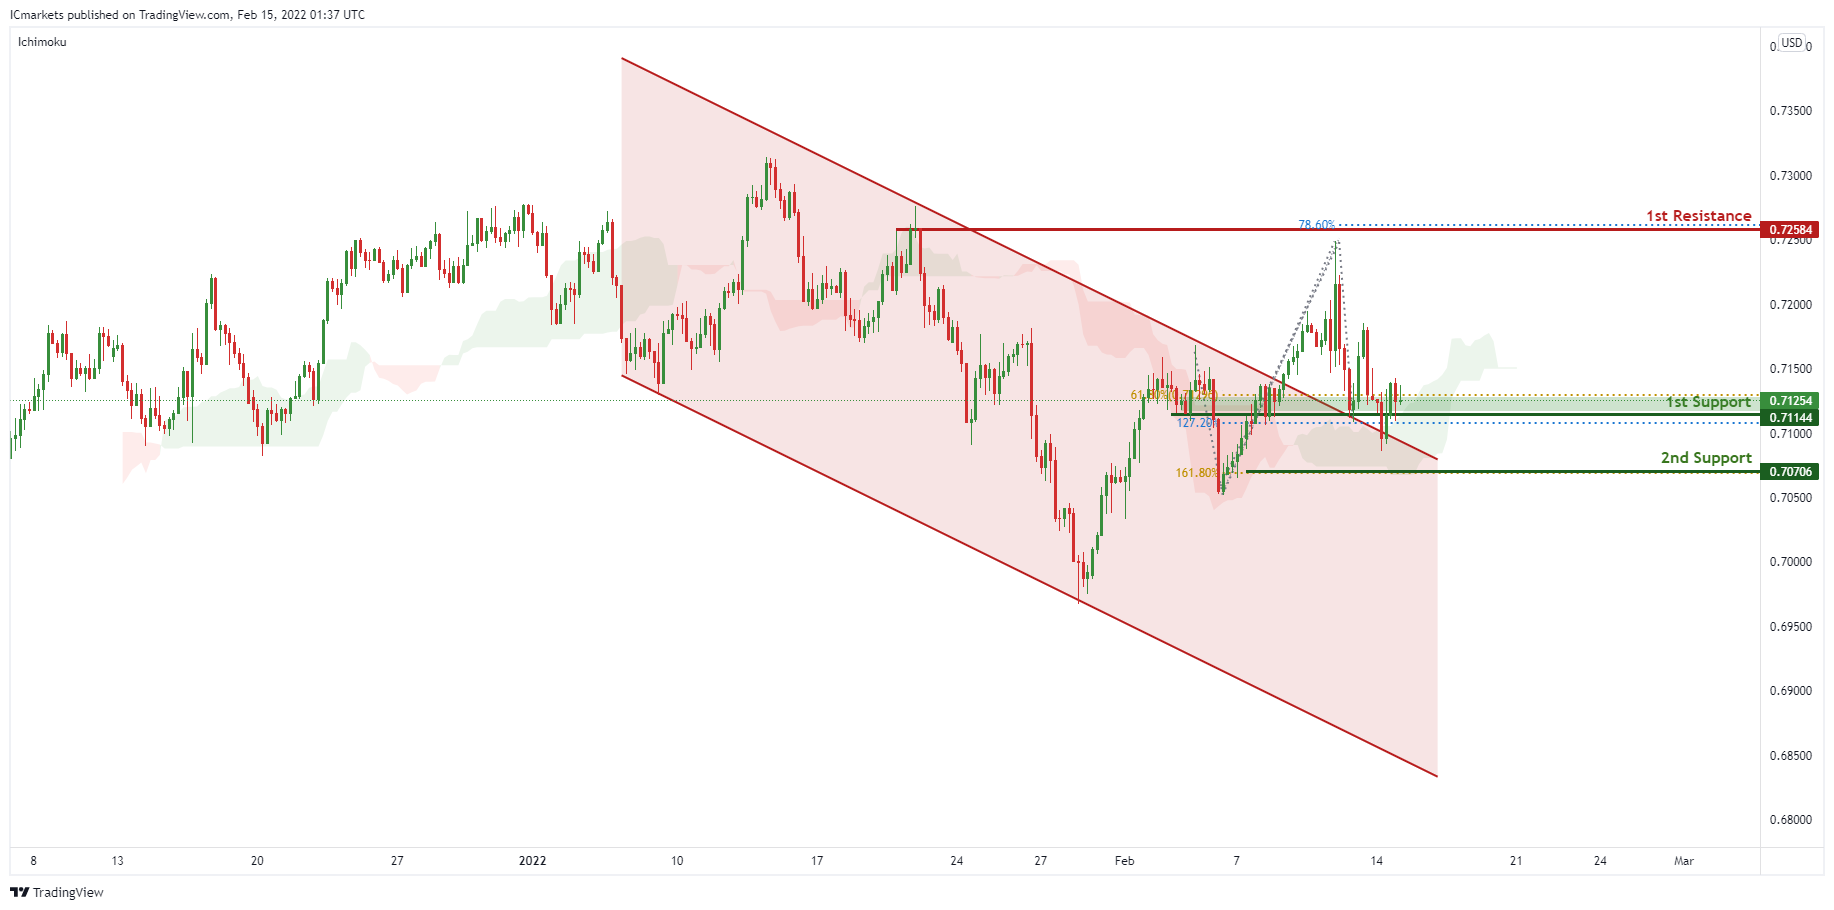
Price broke out of the descending channel, signifying an overall bullish momentum. We can expect price to bounce from 1st Support in line with 61.8% Fibonacci retracement, 127.2% Fibonacci projection and graphical overlap support towards 1st Resistance in line with previous swing high and 78.6% Fibonacci projection. Our bullish bias is further supported by the Ichimoku indicator where the prices are holding above the cloud.
Areas of consideration:
- H4 1st Support level 0.71144
- H4 1st resistance level 0.72584
NZD/USD:
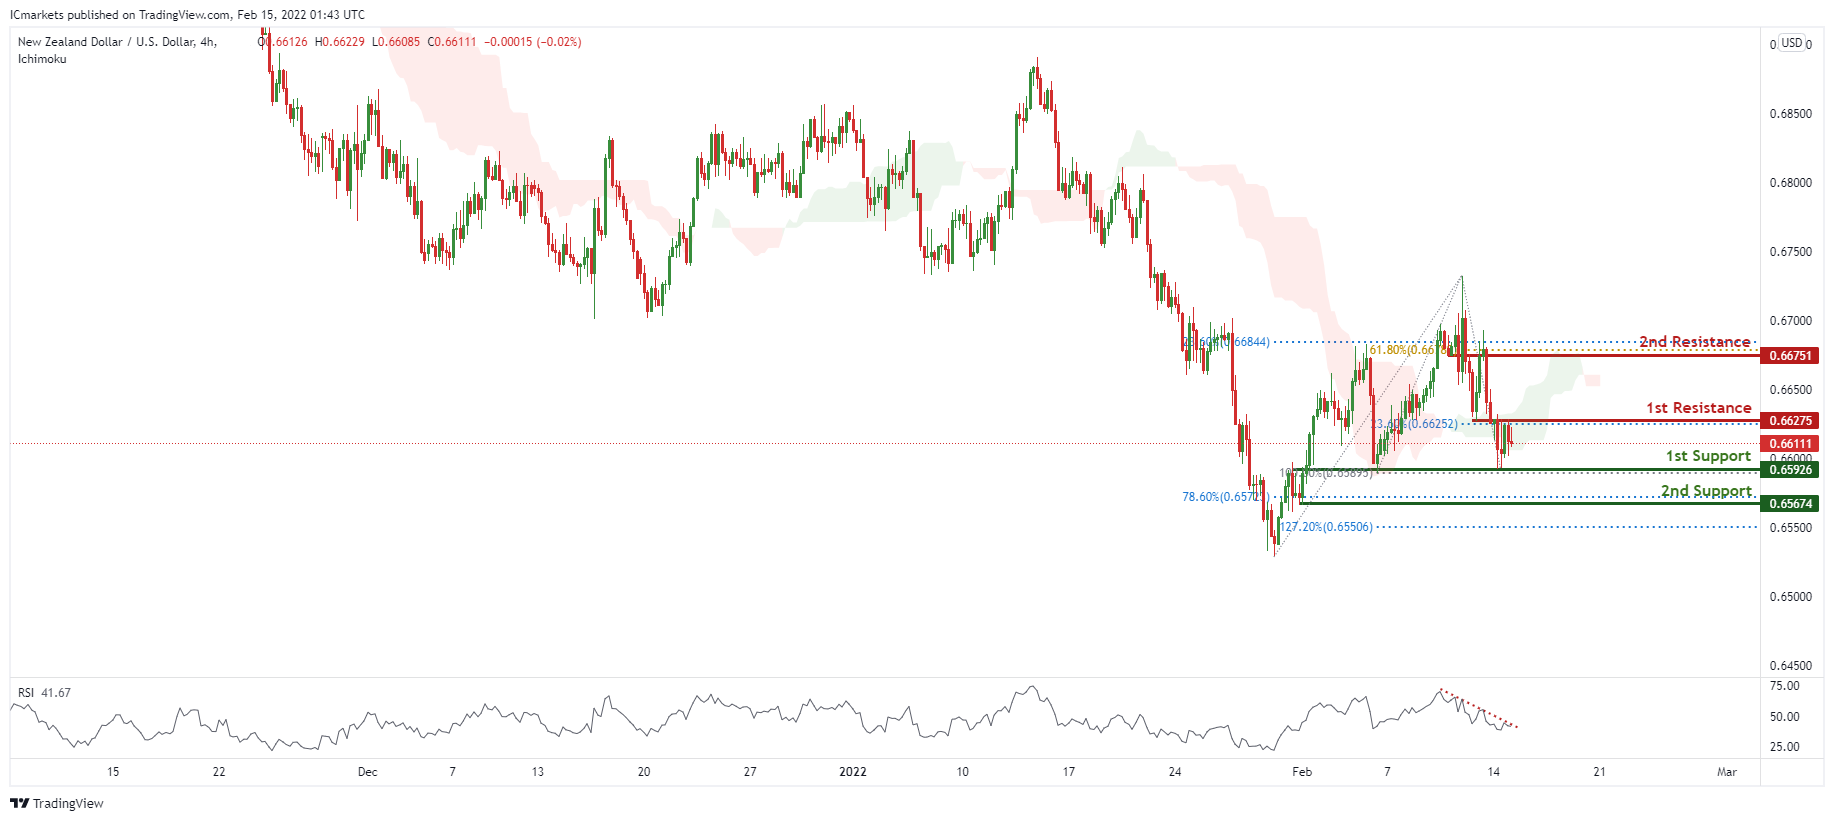
On the H4 timeframe, prices are on bearish momentum. We see potential for bearish continuation from our 1st resistance at 0.66275 in line with 23.6% Fibonacci retracement towards our 1st support at 0.65926 in line with 100% Fibonacci retracement and 78.6% Fibonacci extension. Our bias is further supported by RSI portraying bearish momentum and also ichimoku cloud forecasting bearish momentum . Alternatively, our stop loss will be placed at 2nd resistance at 0.66751 in line with 23.6% Fibonacci retracement and 61.8% Fibonacci extension.
Areas of consideration:
- H4 time frame, 1st resistance at 0.66275
- H4 time frame, 1st support at 0.65926
USD/CAD:
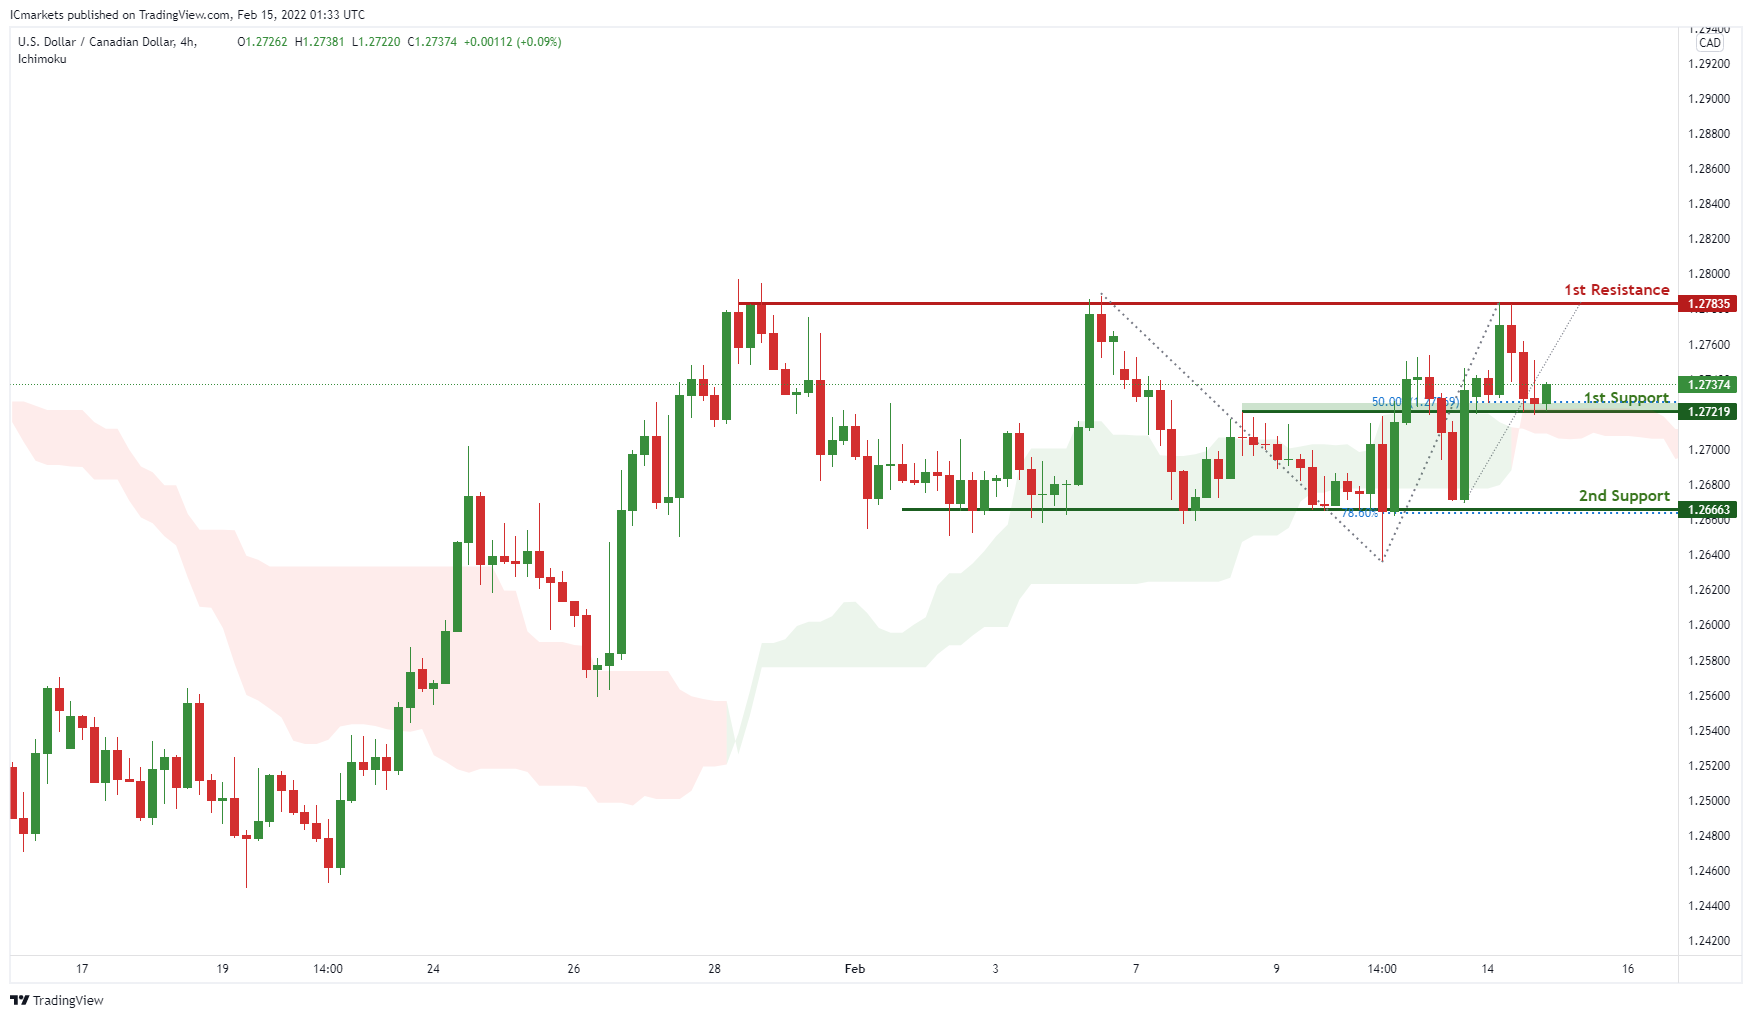
On the H4, with price moving above the ichimoku cloud, signifying an overall bullish momentum. We can expect price to rise to our 1st resistance at 1.27835 in line horizontal graphical swing high resistance from our 1st support in line with horizontal overlap support and 78.6% Fibonacci retracement at 1.27219. Alternatively, price may break 1st support structure and head for 2nd support, which coincides with horizontal swing low support and 161.8% Fibonacci extension at 1.26663.
Areas of consideration:
- H4 time frame, 1st support at 1.27219
- H4 time frame, 1st resistance at 1.27835
OIL:
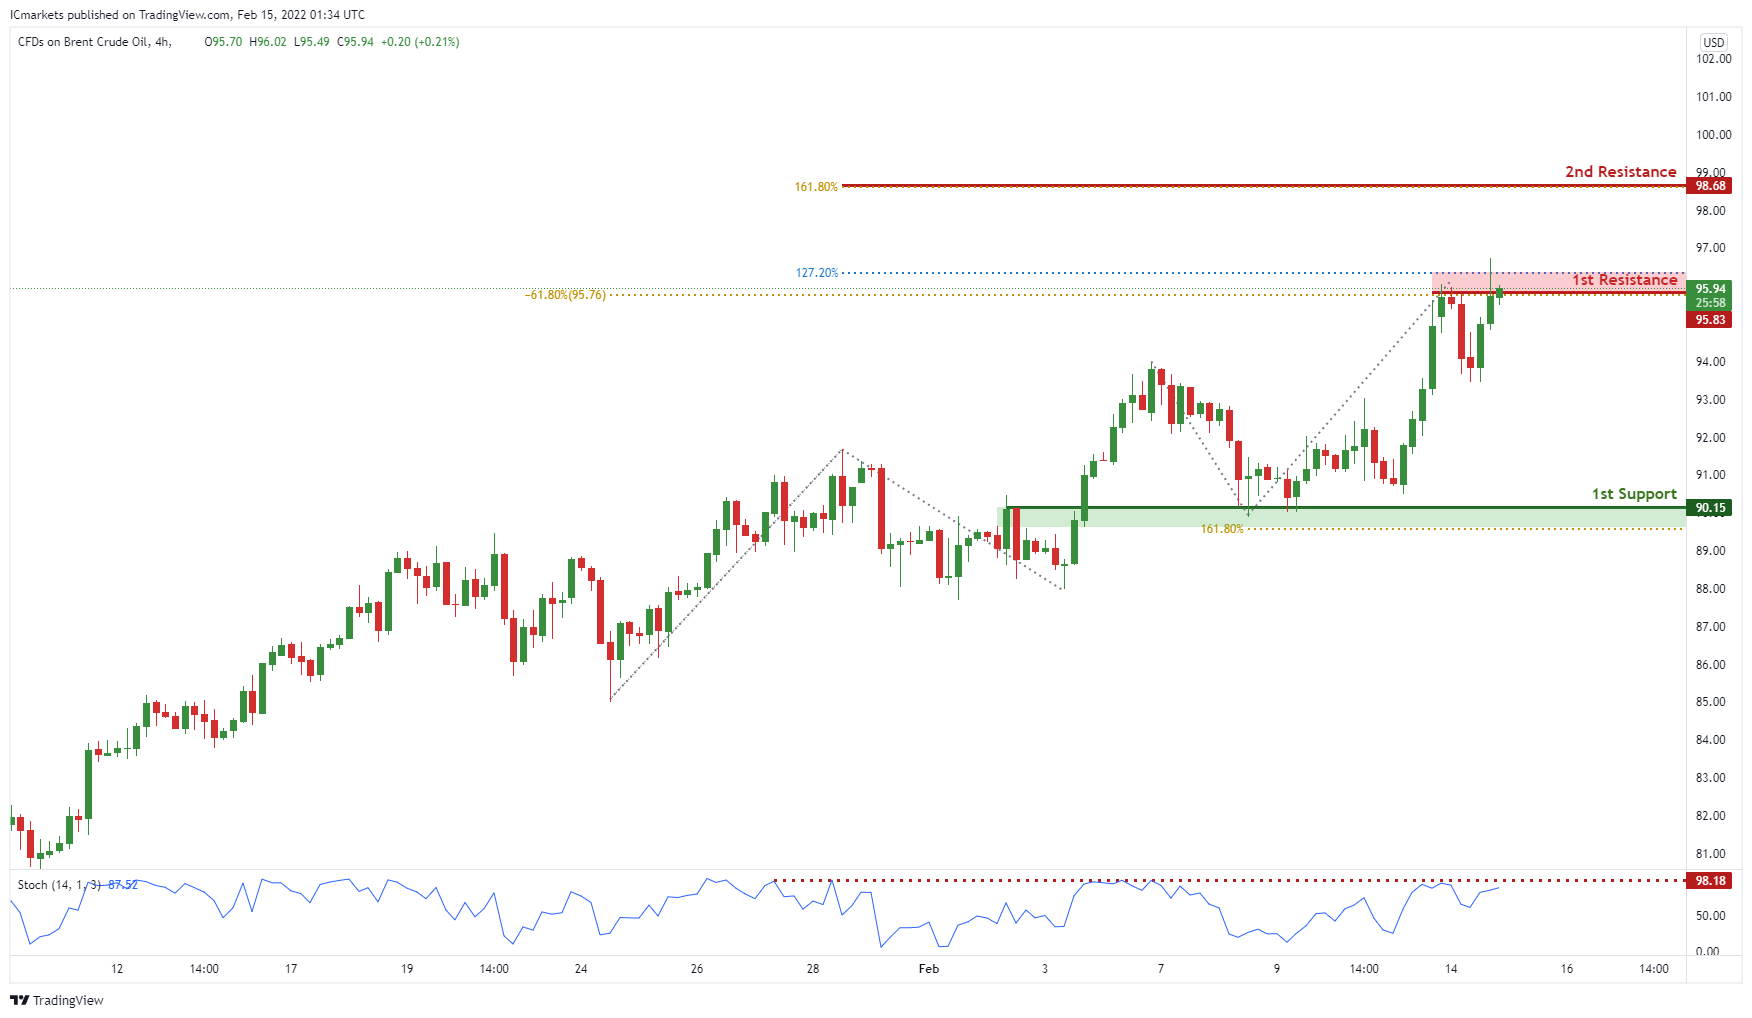
On the H4, with prices expected to reverse off the resistance of the stochastics indicator, we see the potential for a drop to our 1st support at 90.15 in line with horizontal overlap support from our 1st resistance at 95.83 in line with the 127.2% Fibonacci extension and -61.8% Fibonacci expansion. Alternatively, price may break 1st resistance structure and head for 2nd resistance at 98.68, in line with the horizontal swing low support and 161.8% Fibonacci extension.
Areas of consideration:
- H4 time frame, 1st resistance of 95.83
- H4 time frame, 1st support of 90.15
Dow Jones Industrial Average:
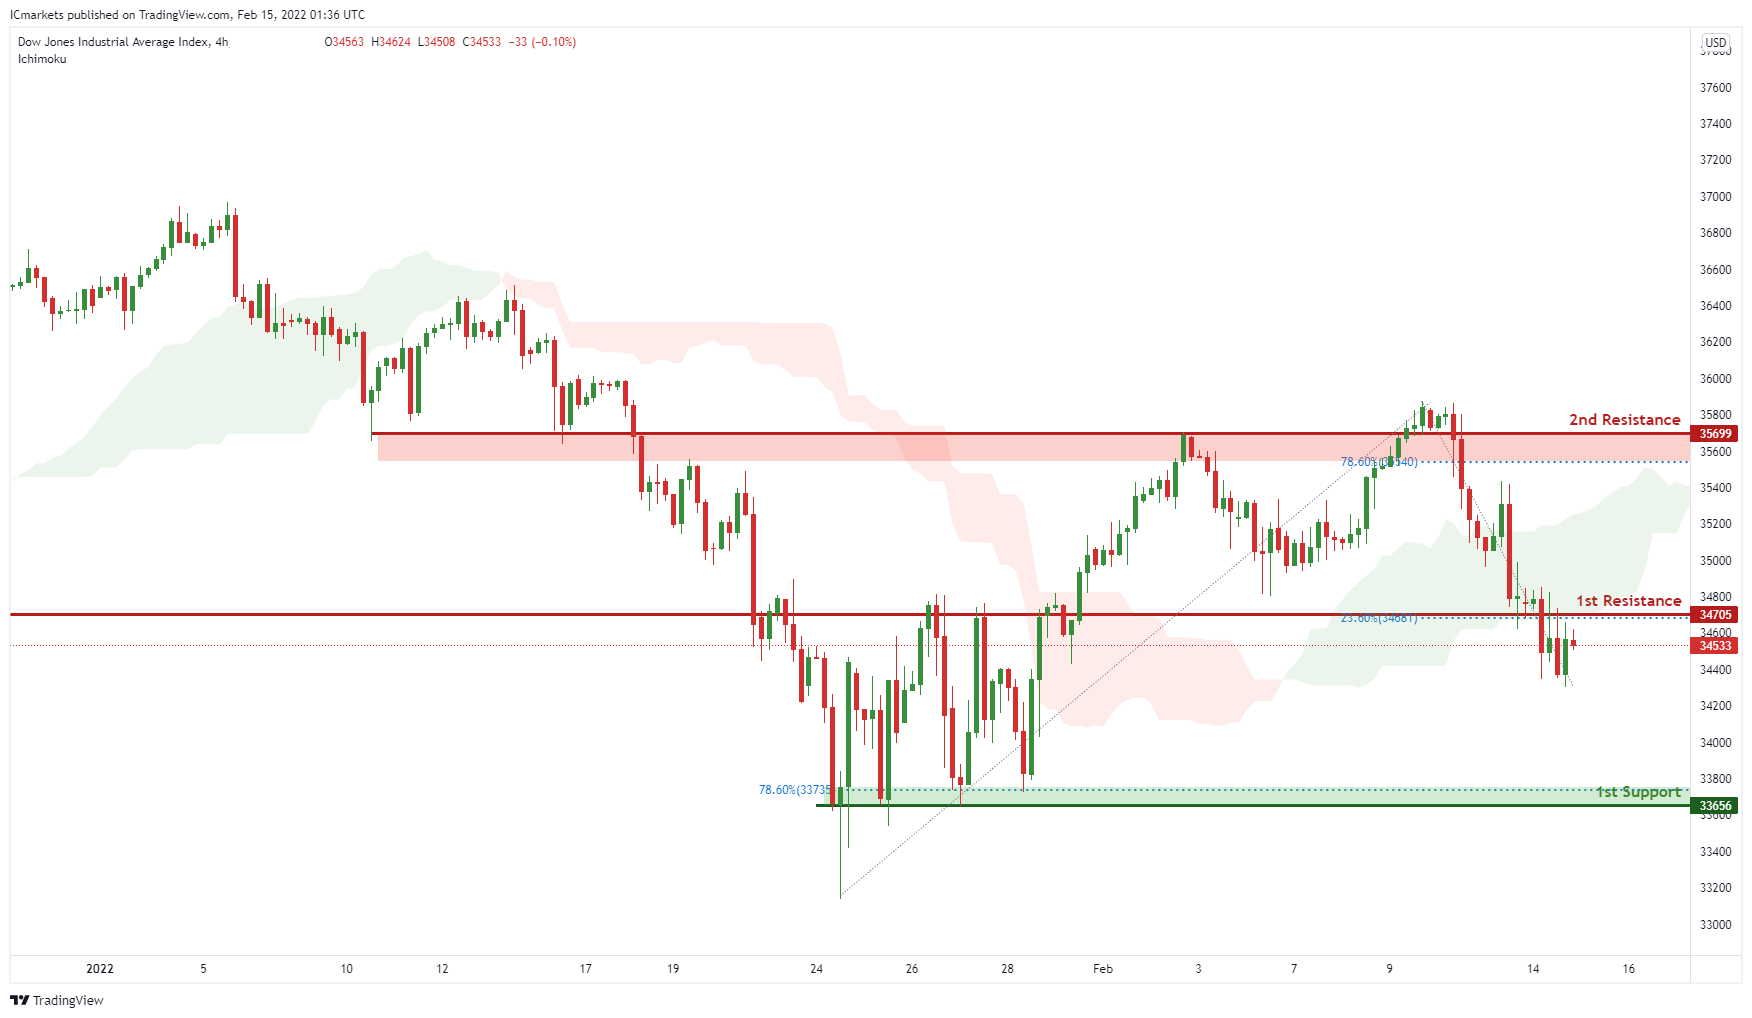
On the H4, with prices moving below the ichimoku cloud, we see the potential for a drop to our 1st support at 33656 in line with horizontal swing low support from our 1st resistance at 34705 in line with the 23.6% Fibonacci retracement. Alternatively, price may break 1st resistance structure and head for 2nd resistance at 35699, in line with the horizontal overlap resistance and 78.6% Fibonacci retracement.
Areas of consideration:
- H4 time frame, 1st resistance of 34705
- H4 time frame, 1st support of 33656