
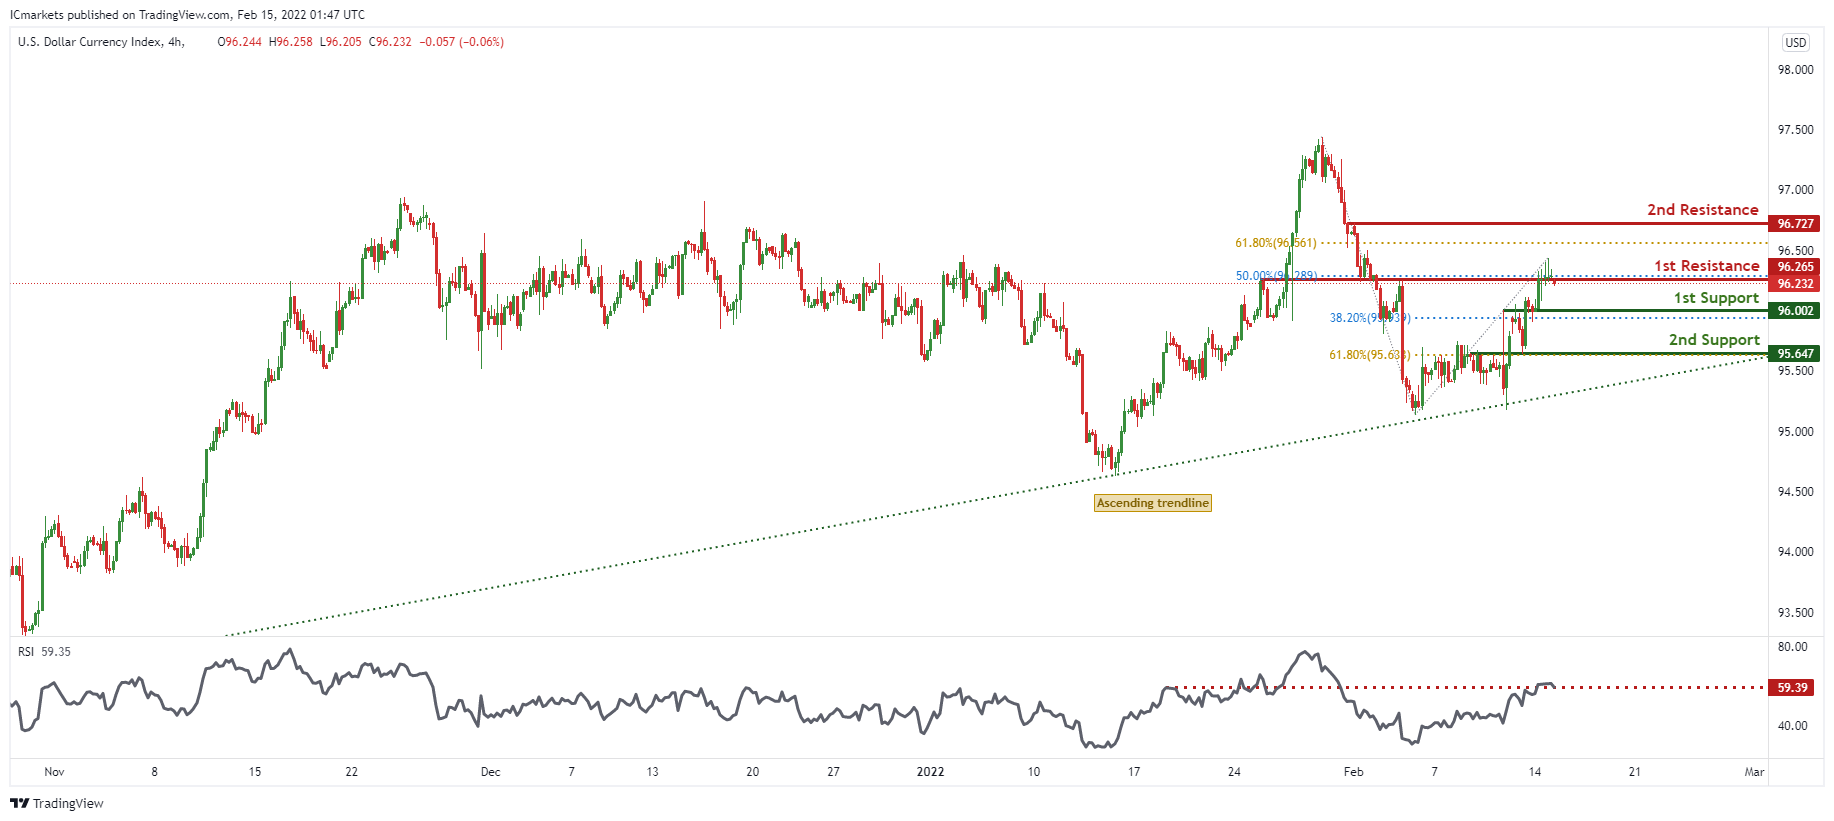
DXY:
On the H4 timeframe, prices are abiding by a daily ascending trendline and are on bullish momentum. We see the potential for a pullback from our 1st resistance at 96.265 in line with 50% Fibonacci retracement and graphical overlap towards our 1st support at 96.002 in line with 38.2% Fibonacci retracement. Our bearish bias is further supported by our RSI being at levels where dips previously occurred.
Areas of consideration:
- H4 time frame, 1st resistance at 96.265
- H4 time frame, 1st support at 96.002
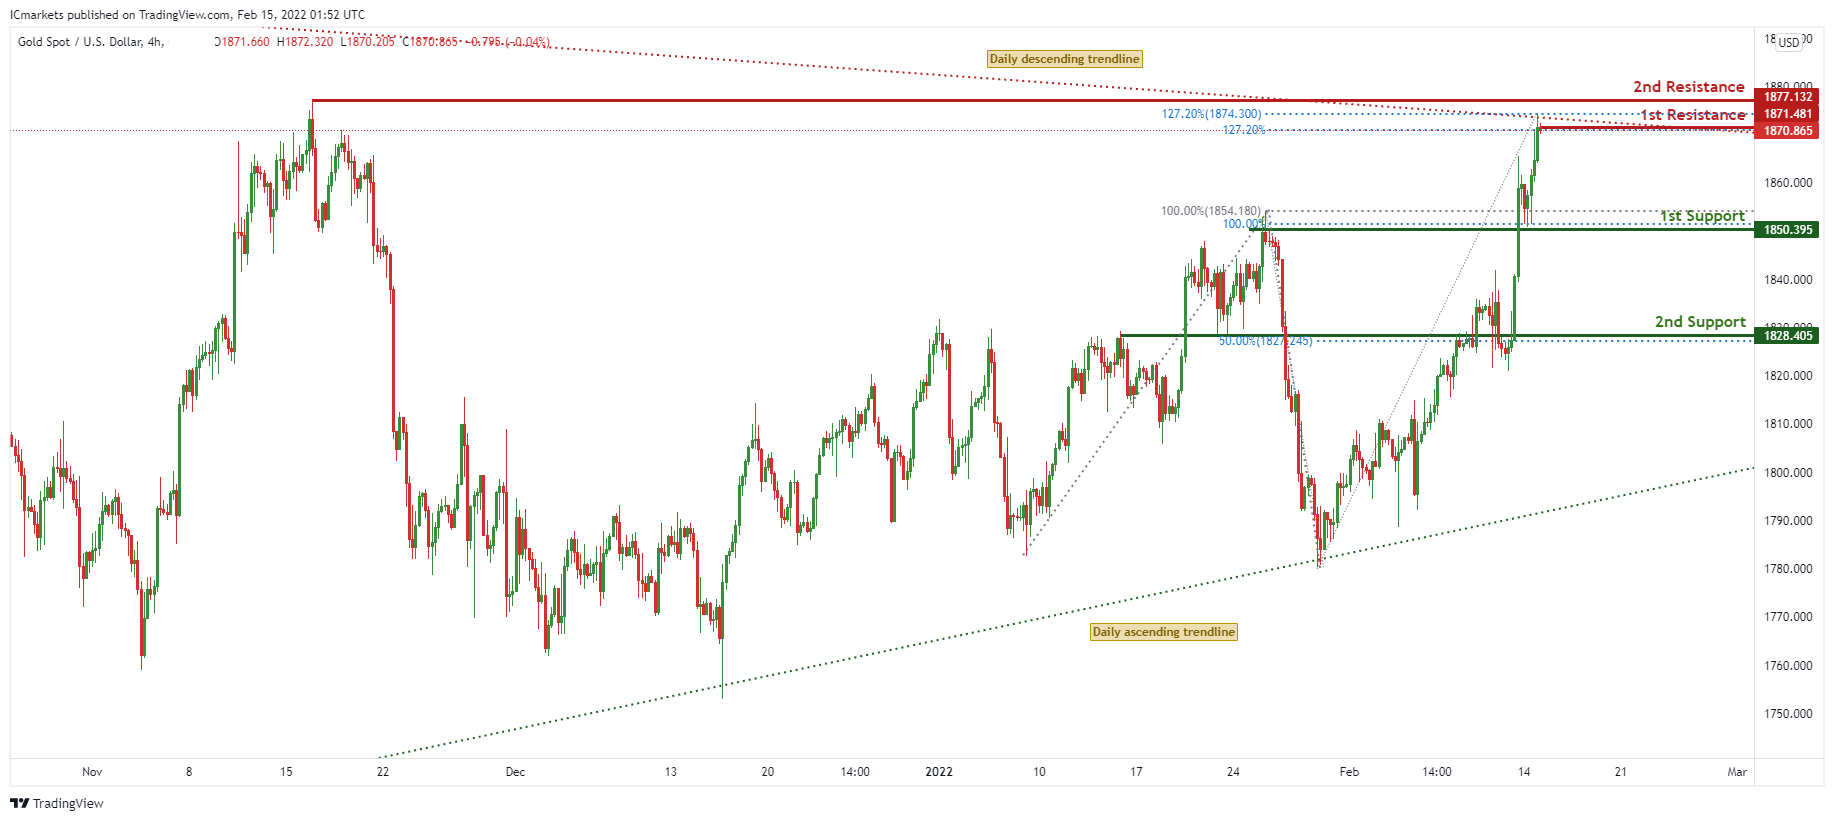
XAU/USD (GOLD):
On the H4 chart, prices are on bullish momentum and have approached the edge of our daily descending trendline. We see potential for a pullback from our 1st resistance at 1871.481 in line with 127.2% Fibonacci extension and 127.2% Fibonacci expansion towards our 1st support at 1850.395 in line with 100% Fibonacci retracement and 100% Fibonacci extension.
Areas of consideration:
- 4h 1st support at 1850.395
- 4h 1st resistance at 1870.865
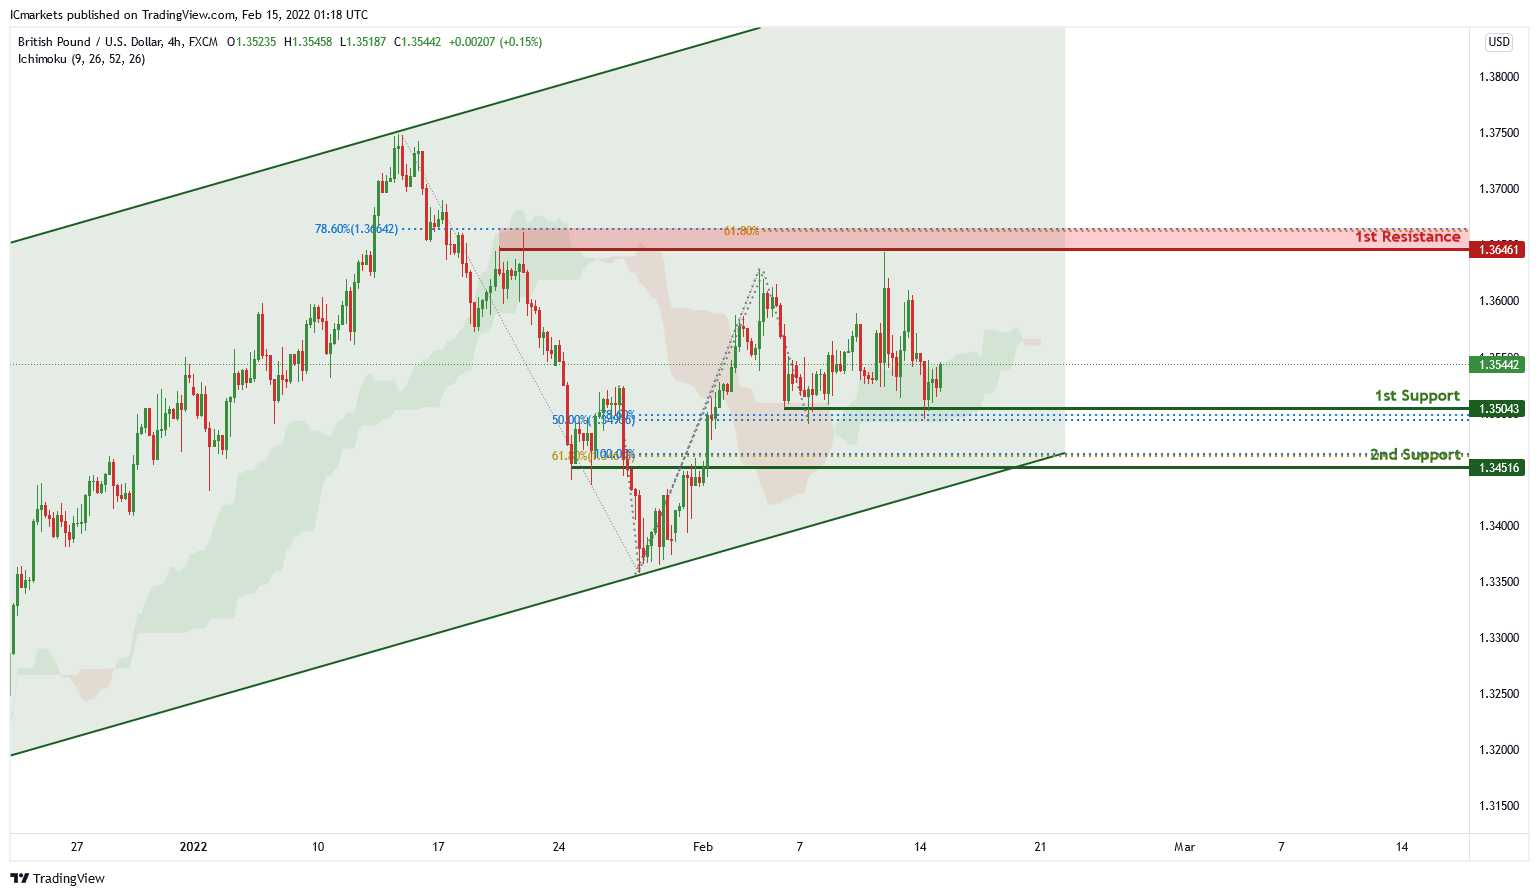
GBP/USD:
In the H4 chart , price is trading in an ascending channel and near 1st support level of 1.35043 which is also 50% Fibonacci retracement and 78.6% Fibonacci projection. Price can potentially continue its bullish momentum to the 1st resistance level of 1.36461 in line with 61.8% Fibonacci projection and 78.6% Fibonacci retracement. Our bullish bias is supported by the ichimoku cloud indicator as price is trading above it.
Areas of consideration:
- H4 1st resistance 1.36461
- H4 1st support 1.35043
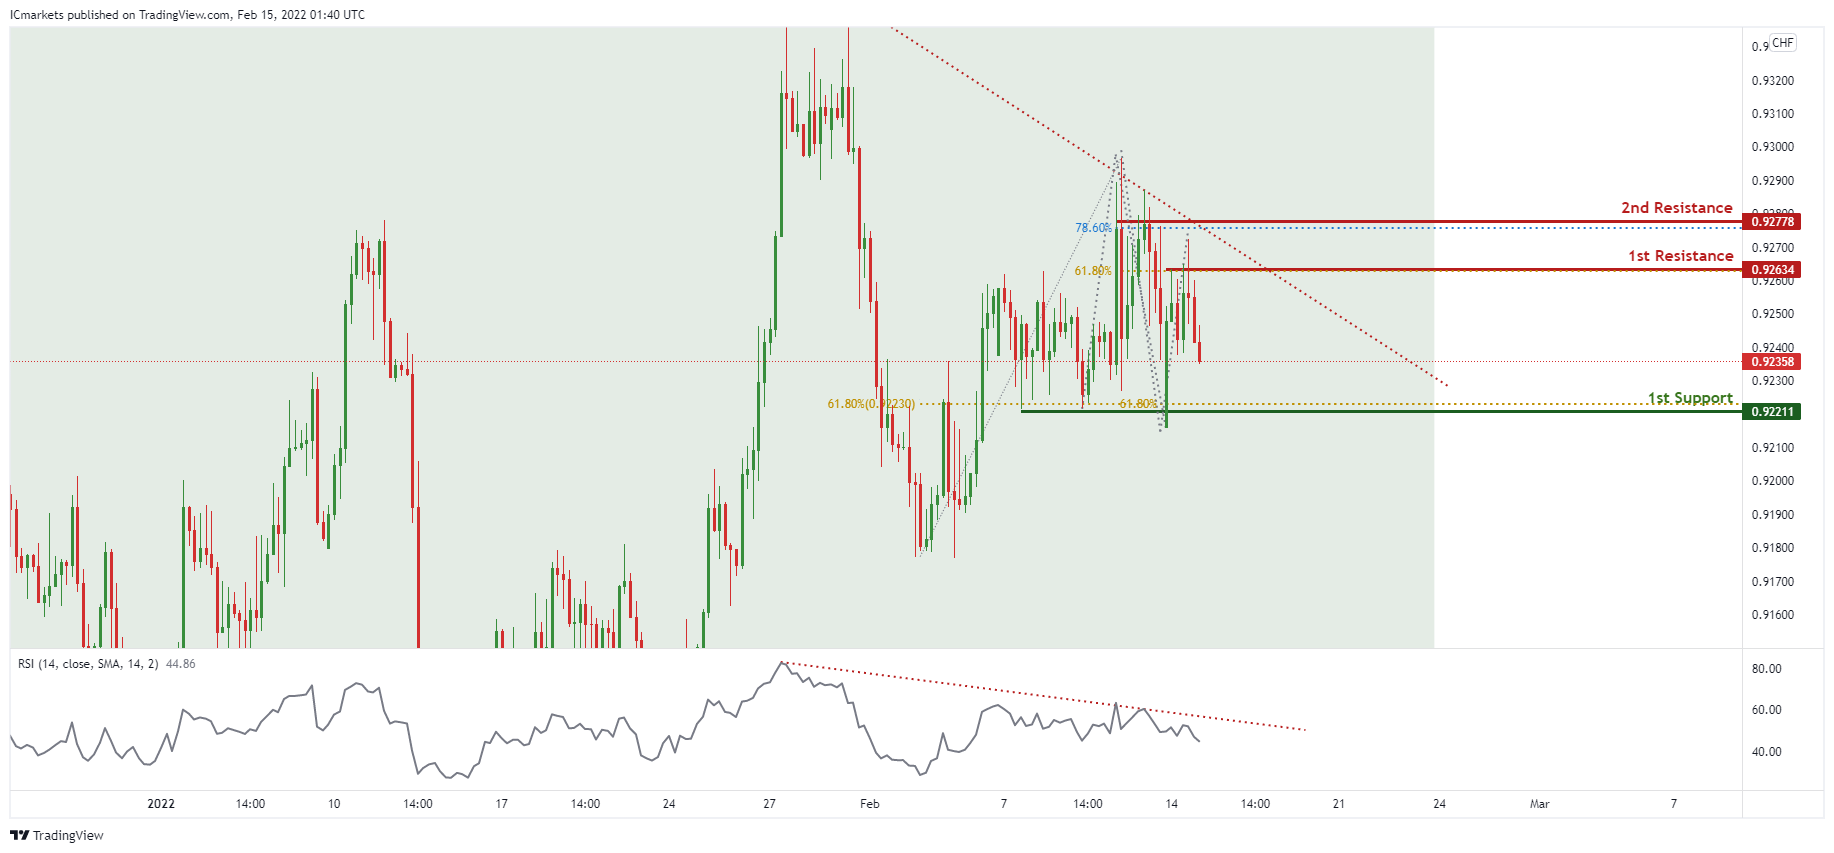
USD/CHF:
On the H4 timeframe, price is abiding to the daily ascending channel and descending trendline resistance on the H4. We can expect the price to drop from 1st Resistance in line with 61.8% Fibonacci projection towards 1st Support in line with 61.8% Fibonacci projection and 61.8% Fibonacci retracement. Our bearish bias is further supported by the RSI indicator where it is abiding to the descending trendline resistance. Traders should wait for prices to swing higher or lower before entering.
Areas of consideration:
- Watch 1st Support at 0.92211
- Watch 1st Resistance at 0.92634
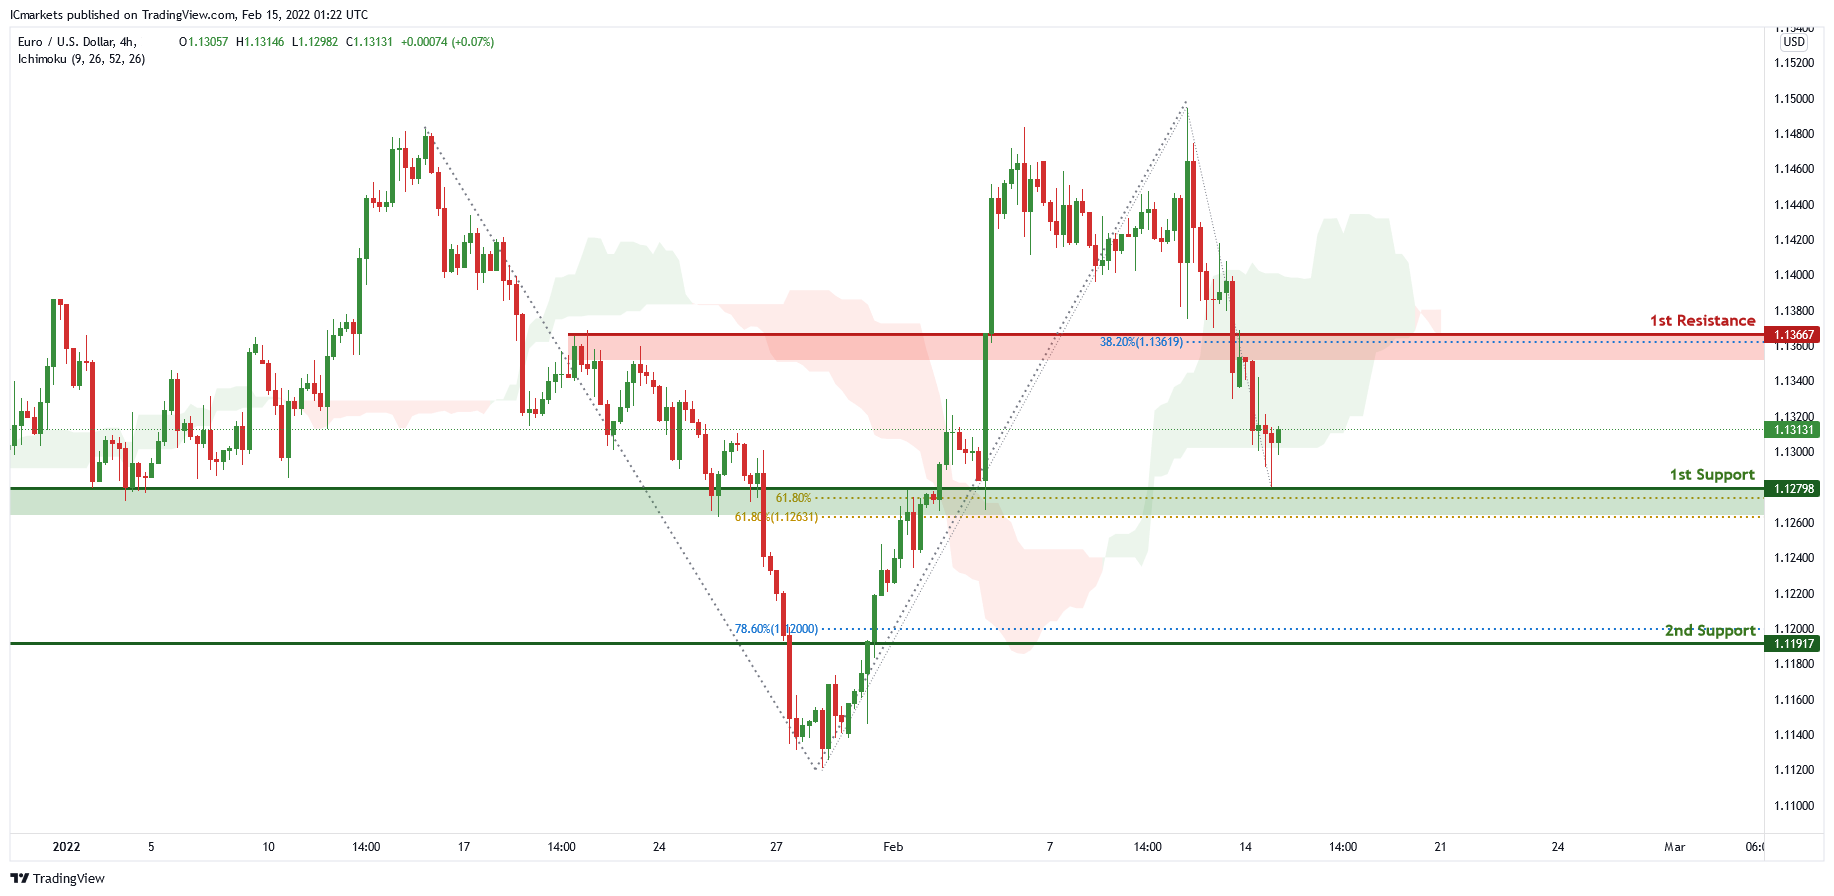
EUR/USD :
On the H4 chart, price is near 1st support level of 1.12798 in line with 61.8% Fibonacci retracement and 61.8% Fibonacci projection. Price can potentially bounce from this level to the 1st resistance which is also 38.2% Fibonacci retracement and graphical overlap resistance. Our bullish bias is supported by the ichimoku cloud indicator.
Areas of consideration:
- H4 1st resistance at 1.13611
- H4 1st support at 1.12798
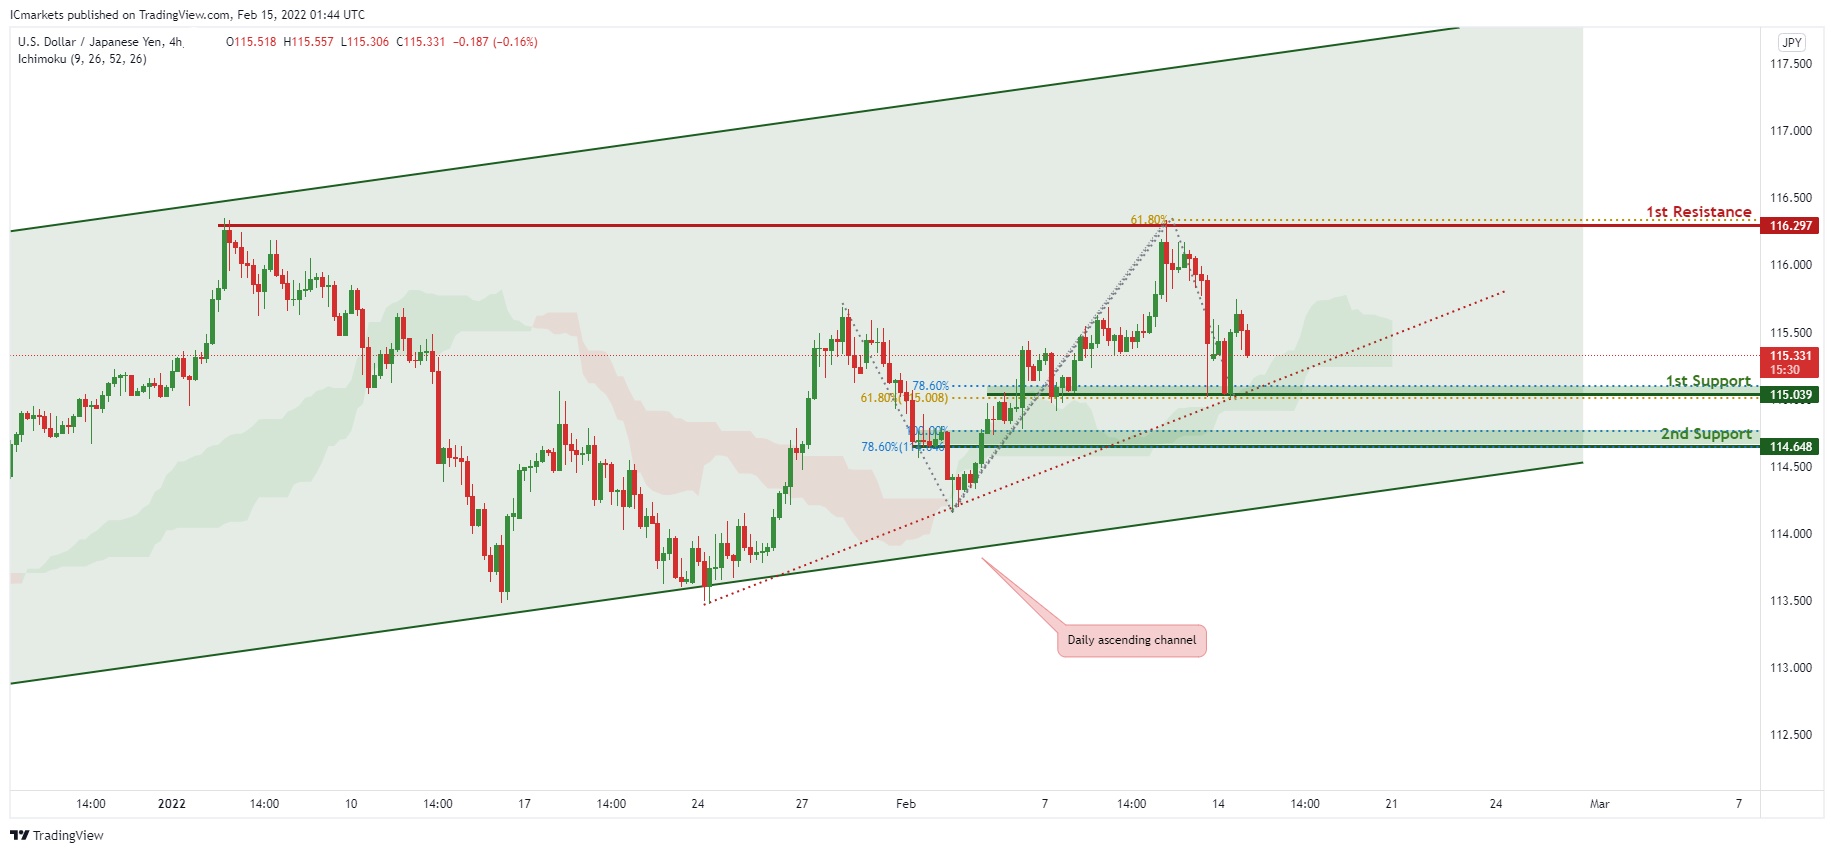
USD/JPY:
On the H4 chart, price is abiding to the ascending trendline support and the ascending channel on the daily, signifying an overall bullish momentum. We can expect price to bounce at the 1st Support level in line with 78.6% FIbonacci projection ,61.8% Fibonacci retracement and trendline support towards 1st Resistance in line with 61.8% Fibonacci projection and swing high resistance. Our bullish bias is further supported by the Ichimoku cloud acting as a support.
Areas of consideration:
- H4 1st support at 115.039
- H4 1st resistance at 116.297
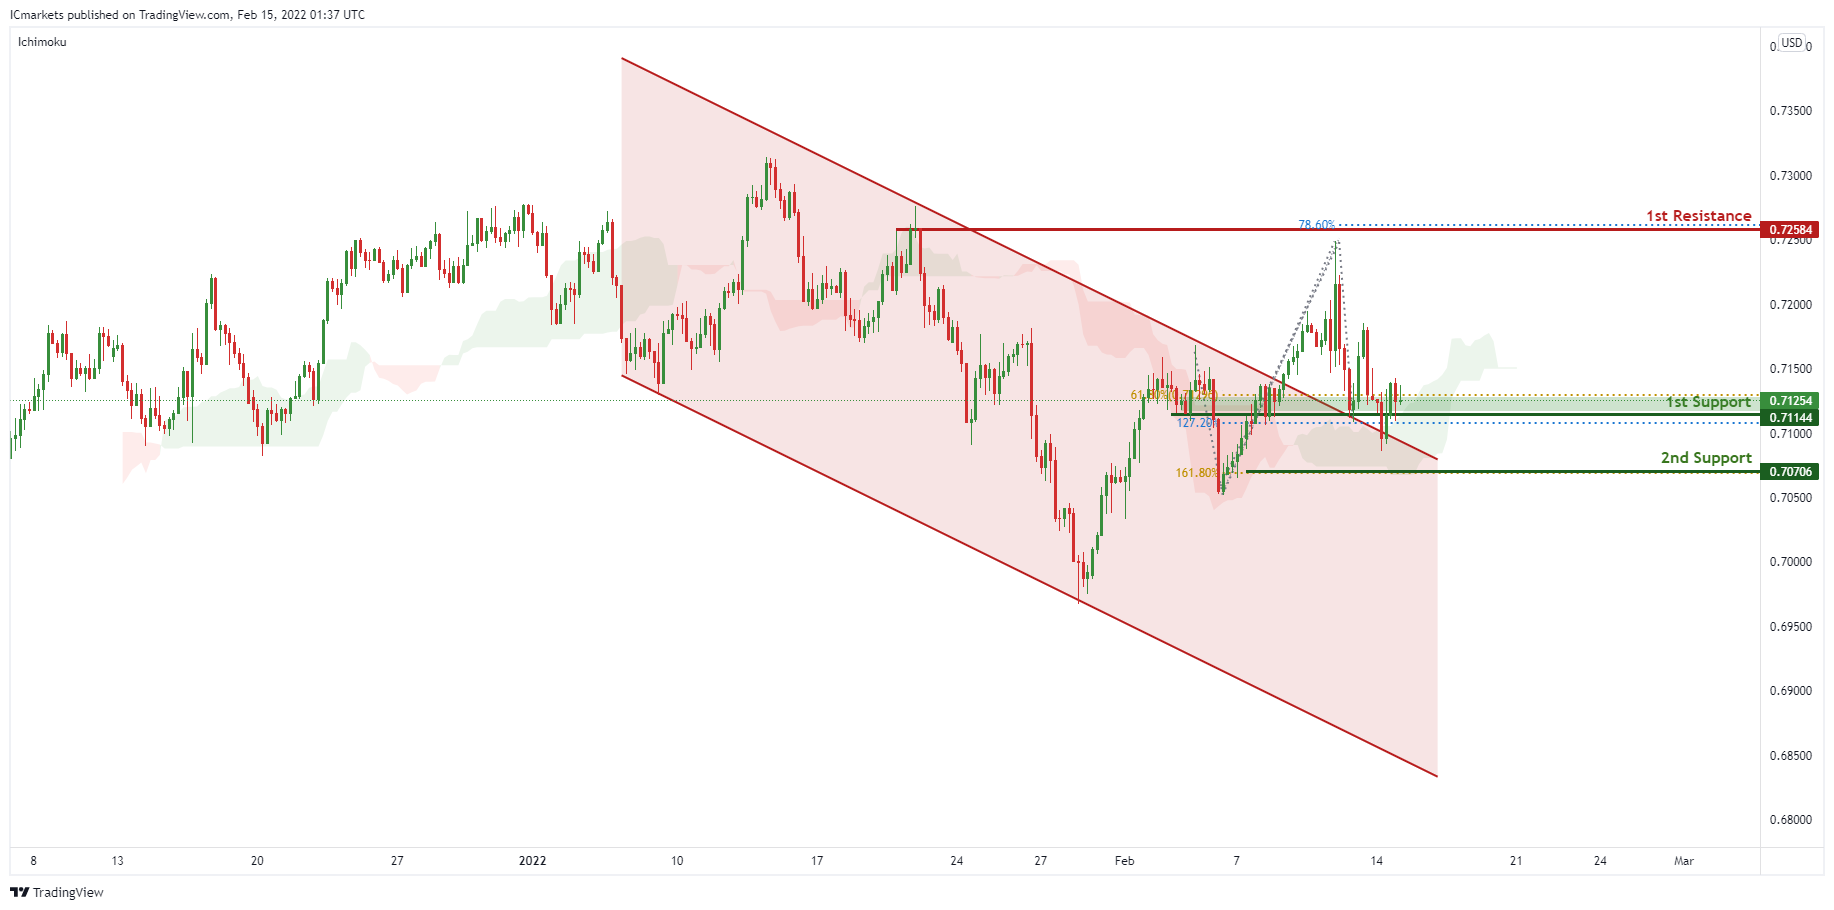
AUD/USD:
Price broke out of the descending channel, signifying an overall bullish momentum. We can expect price to bounce from 1st Support in line with 61.8% Fibonacci retracement, 127.2% Fibonacci projection and graphical overlap support towards 1st Resistance in line with previous swing high and 78.6% Fibonacci projection. Our bullish bias is further supported by the Ichimoku indicator where the prices are holding above the cloud.
Areas of consideration:
- H4 1st Support level 0.71144
- H4 1st resistance level 0.72584
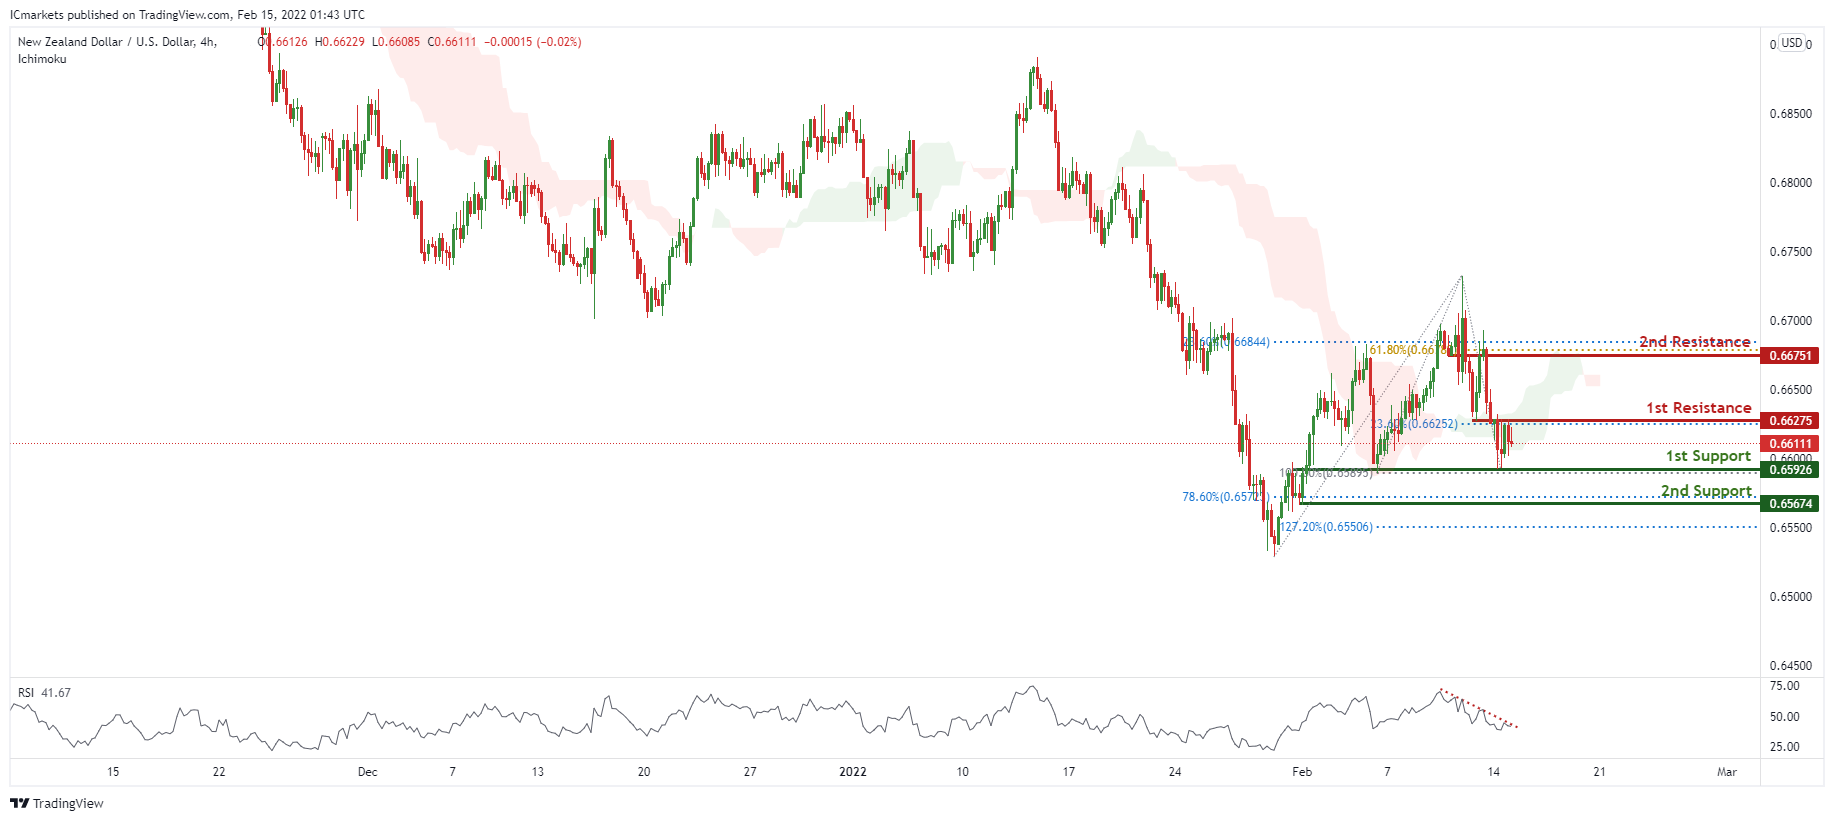
NZD/USD:
On the H4 timeframe, prices are on bearish momentum. We see potential for bearish continuation from our 1st resistance at 0.66275 in line with 23.6% Fibonacci retracement towards our 1st support at 0.65926 in line with 100% Fibonacci retracement and 78.6% Fibonacci extension. Our bias is further supported by RSI portraying bearish momentum and also ichimoku cloud forecasting bearish momentum . Alternatively, our stop loss will be placed at 2nd resistance at 0.66751 in line with 23.6% Fibonacci retracement and 61.8% Fibonacci extension.
Areas of consideration:
- H4 time frame, 1st resistance at 0.66275
- H4 time frame, 1st support at 0.65926
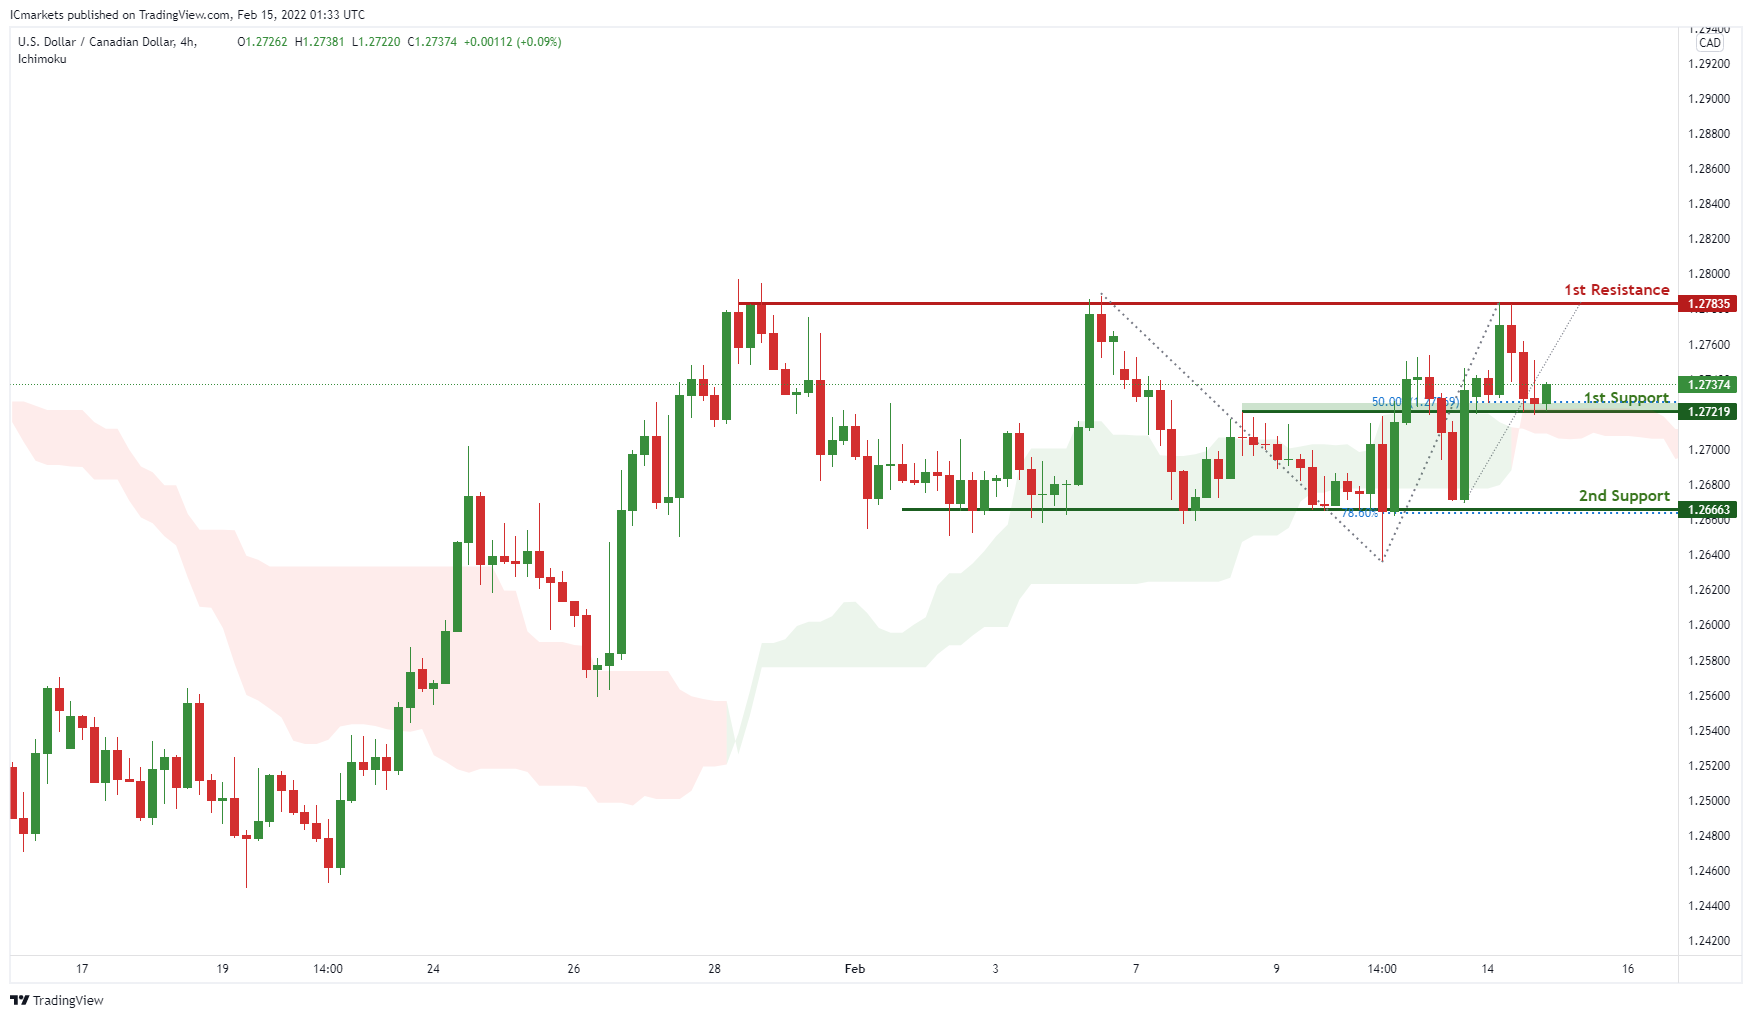
USD/CAD:
On the H4, with price moving above the ichimoku cloud, signifying an overall bullish momentum. We can expect price to rise to our 1st resistance at 1.27835 in line horizontal graphical swing high resistance from our 1st support in line with horizontal overlap support and 78.6% Fibonacci retracement at 1.27219. Alternatively, price may break 1st support structure and head for 2nd support, which coincides with horizontal swing low support and 161.8% Fibonacci extension at 1.26663.
Areas of consideration:
- H4 time frame, 1st support at 1.27219
- H4 time frame, 1st resistance at 1.27835
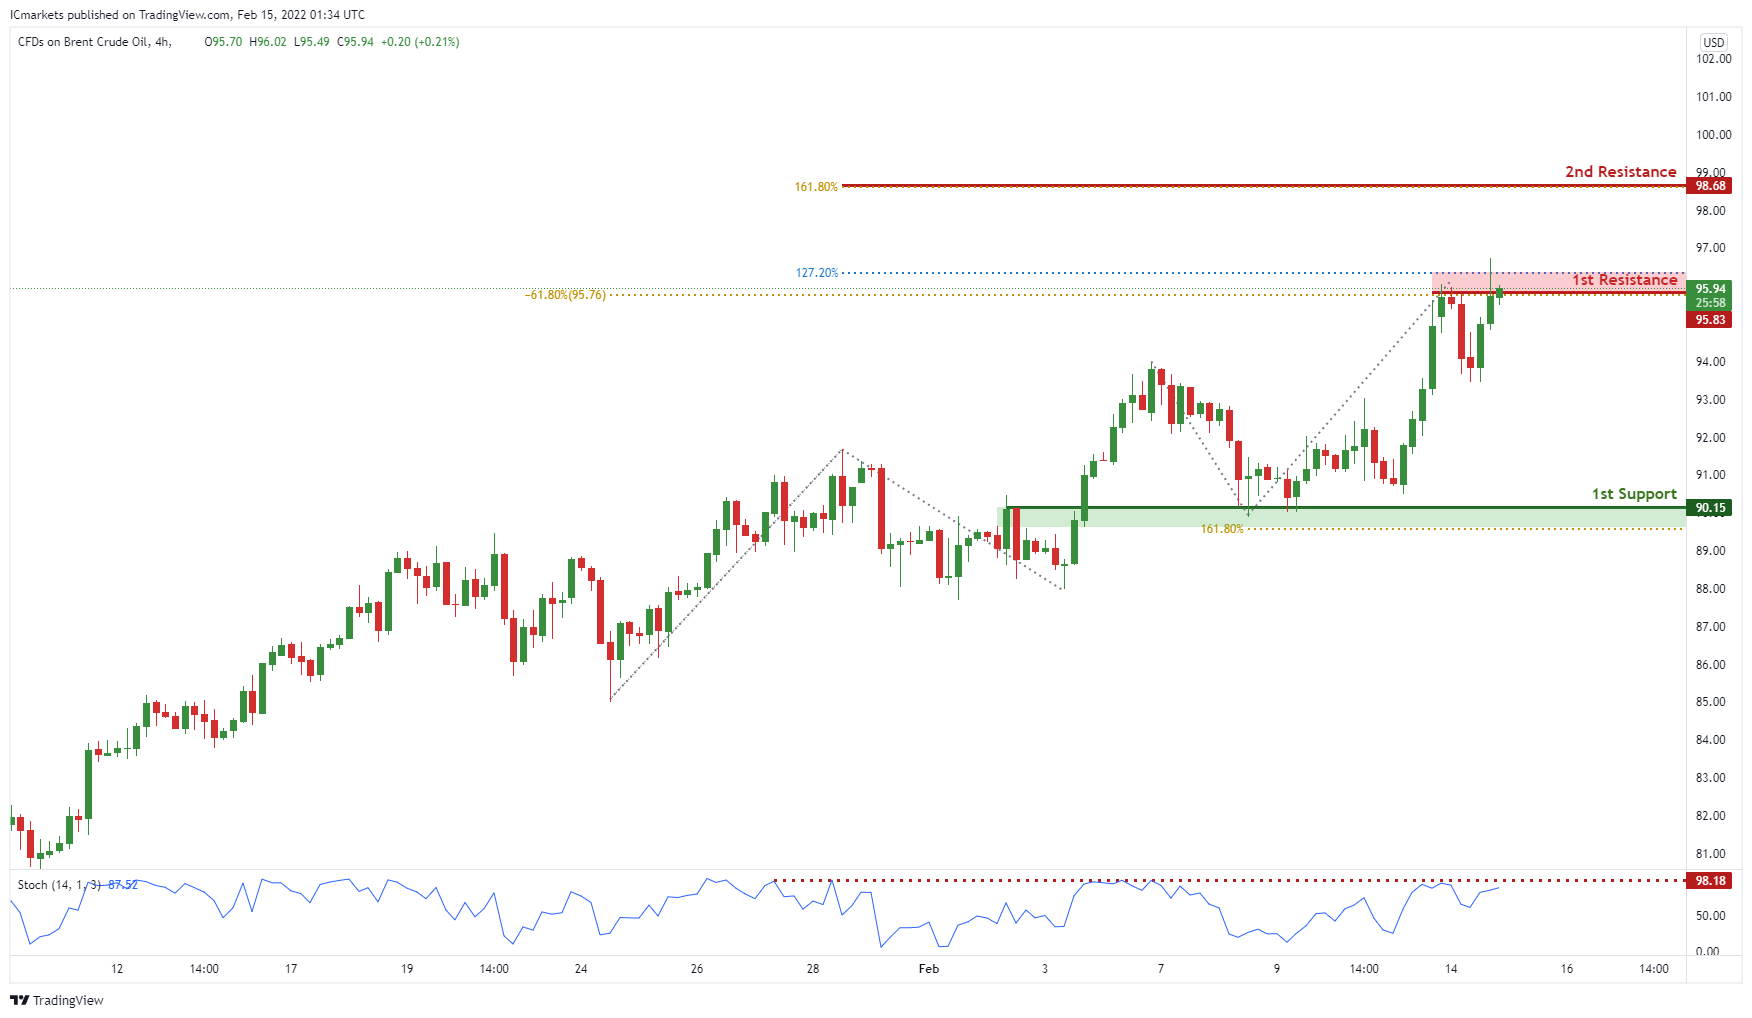
OIL:
On the H4, with prices expected to reverse off the resistance of the stochastics indicator, we see the potential for a drop to our 1st support at 90.15 in line with horizontal overlap support from our 1st resistance at 95.83 in line with the 127.2% Fibonacci extension and -61.8% Fibonacci expansion. Alternatively, price may break 1st resistance structure and head for 2nd resistance at 98.68, in line with the horizontal swing low support and 161.8% Fibonacci extension.
Areas of consideration:
- H4 time frame, 1st resistance of 95.83
- H4 time frame, 1st support of 90.15
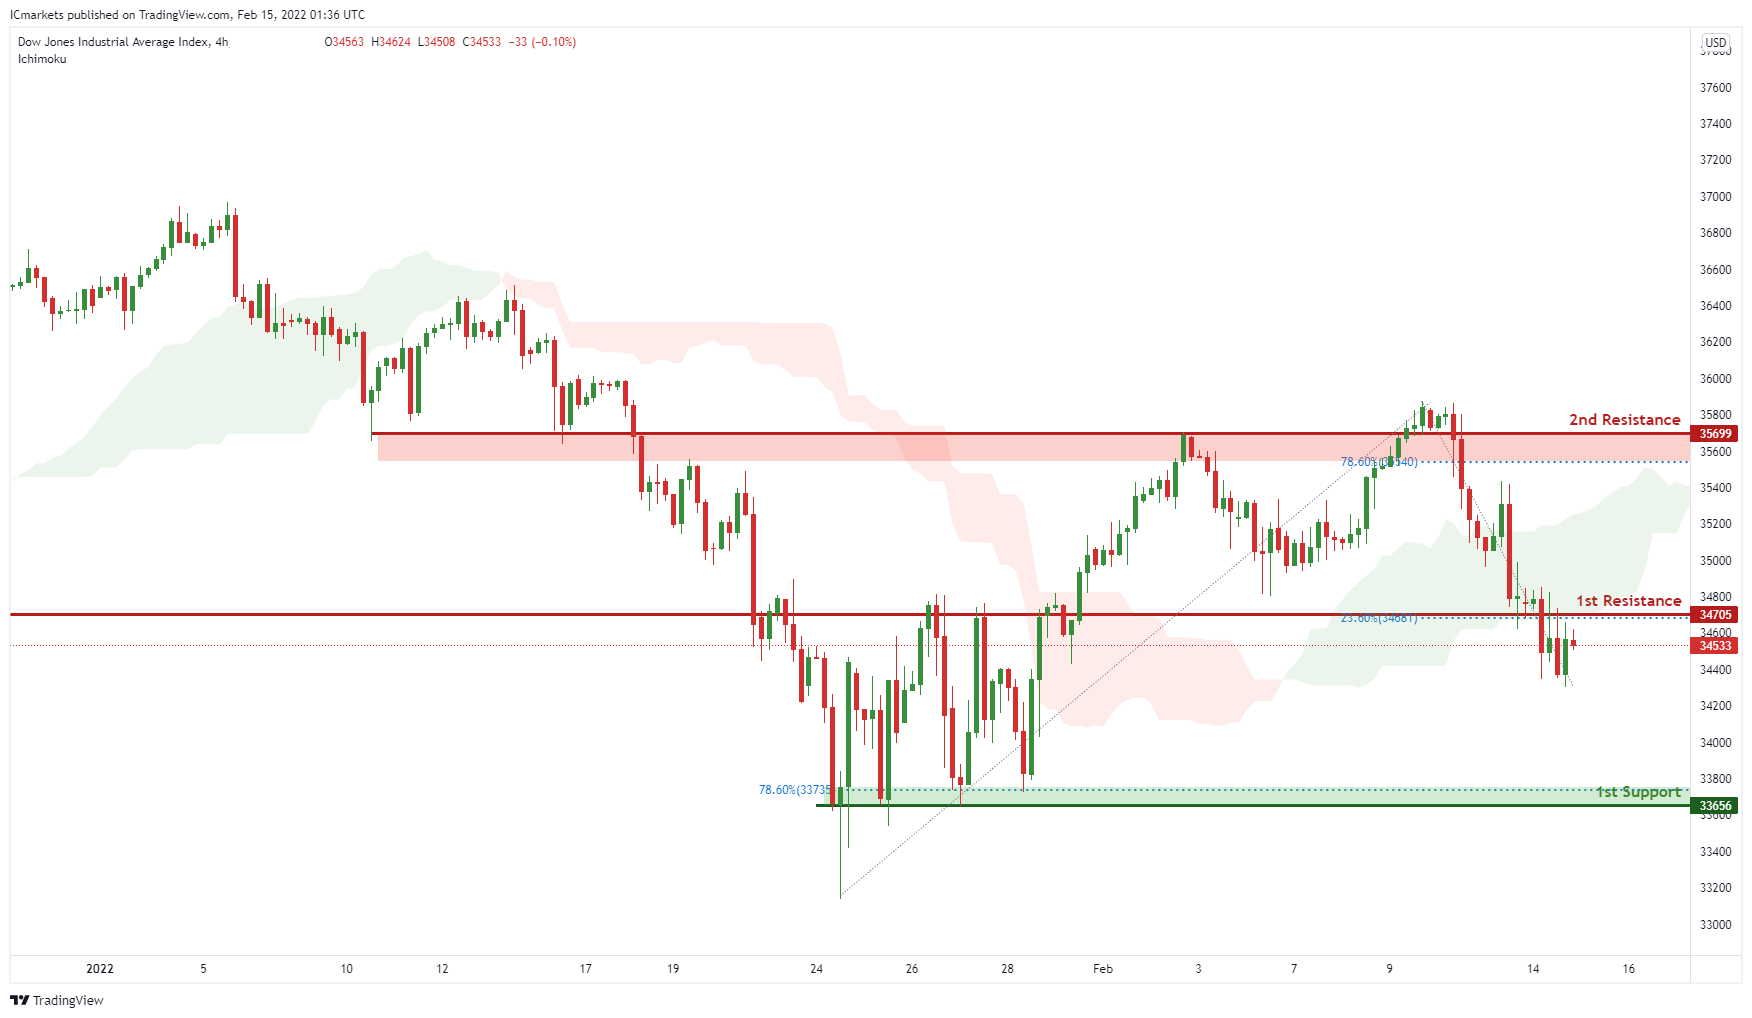
Dow Jones Industrial Average:
On the H4, with prices moving below the ichimoku cloud, we see the potential for a drop to our 1st support at 33656 in line with horizontal swing low support from our 1st resistance at 34705 in line with the 23.6% Fibonacci retracement. Alternatively, price may break 1st resistance structure and head for 2nd resistance at 35699, in line with the horizontal overlap resistance and 78.6% Fibonacci retracement.
Areas of consideration:
- H4 time frame, 1st resistance of 34705
- H4 time frame, 1st support of 33656


