

Sample Category Title
Crude Prices Test Multi-Year Highs ahead of OPEC’s Supply Decision
OPEC and its allies will gather on Wednesday in a scheduled meeting to assess conditions in the oil market and decide on further supply increases. Crude prices are pinned at the highest in more than seven years and the roaring start to 2022 is definitely captivating enough for producers to raise output at a faster pace. Despite that, producers may stick to their initial plan, delivering only a modest boost as doubts remain about whether spare capacity will be enough to commit to meaningful increases.
Oil prices attractive for a sharper output hike
OPEC+ oil exporters are expected to follow the script and raise their output by 400,000 barrels a day for March as part of a plan which aims to gradually recover the lost supply of 9.7 million bpd or 10% of global demand that was removed two years ago in the face of the Covid-19 crisis. But producers may have every reason to ramp up their output faster than previously proposed. Unlike other covid variants, omicron did little to dent energy demand, while heavy snowfalls around the globe further bolstered the need for fuel, sending the international benchmark Brent price above the $90.00/barrel and the West Texas Intermediate (WTI) as high as $88.81/barrel.
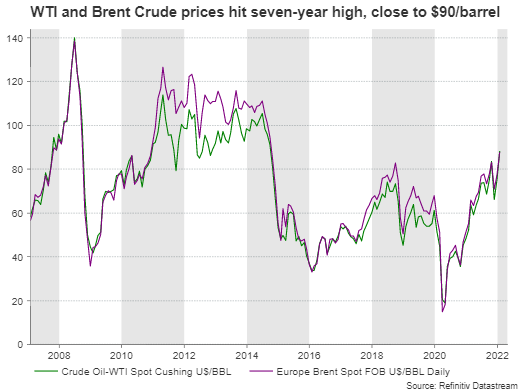
With oil prices driving the inflation storm and central banks seeking adjustments in their policies to cool the price acceleration before it permanently spreads to other sectors and ruins the economic recovery, oil exporters could ideally fill the excess demand and contribute to the inflation fight by raising their production volumes.
OPEC+ to stick to initial plan
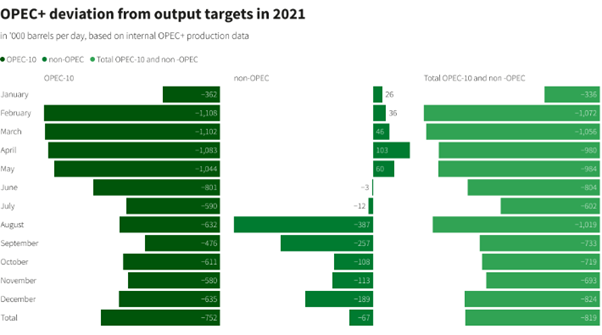
Yet, the decision could be more complicated than it seems. Although the omicron wave proved less deadly, it is still transmitting more rapidly than others, forcing a bulk of workers to isolate themselves. As a result, key OPEC+ countries such as Russia and Nigeria have been struggling to keep pace with their allowed increases, delivering output below-target over the past few months. Specifically, analysts believe that Russia’s monthly increases will not be able to exceed 60,000 bpd in the first half of 2022 due to a decline in drilling compared to its required amount of 100,000 bpd. Technical issues and the lack of investment have been a headache as well, while local military attacks in Libya further tightened OPEC+ deliveries.
Reuters’ data have recently shown that the OPEC+ group was 800,000 bpd below its quota target last year, missing billions of dollars in revenue, which could otherwise be distributed to the less fortunate members for investment. January’s miss was even larger than the one in December, a survey indicated.
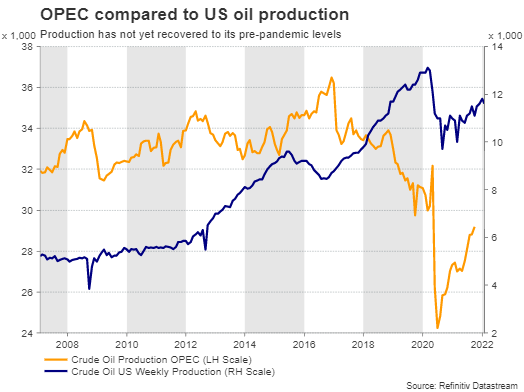
Hence, although the attractive prices and the rosy 2022 outlook from several financial institutions, which foresee crude prices surging to $100/barrel, would theoretically induce OPEC producers to open their taps so as to also limit competition from US shales, the tight spare capacity could play down the scenario of higher production increases for now, especially as the boiling political tensions across the Ukrainian border are currently threatening even existing supply arrangements.
WTI crude
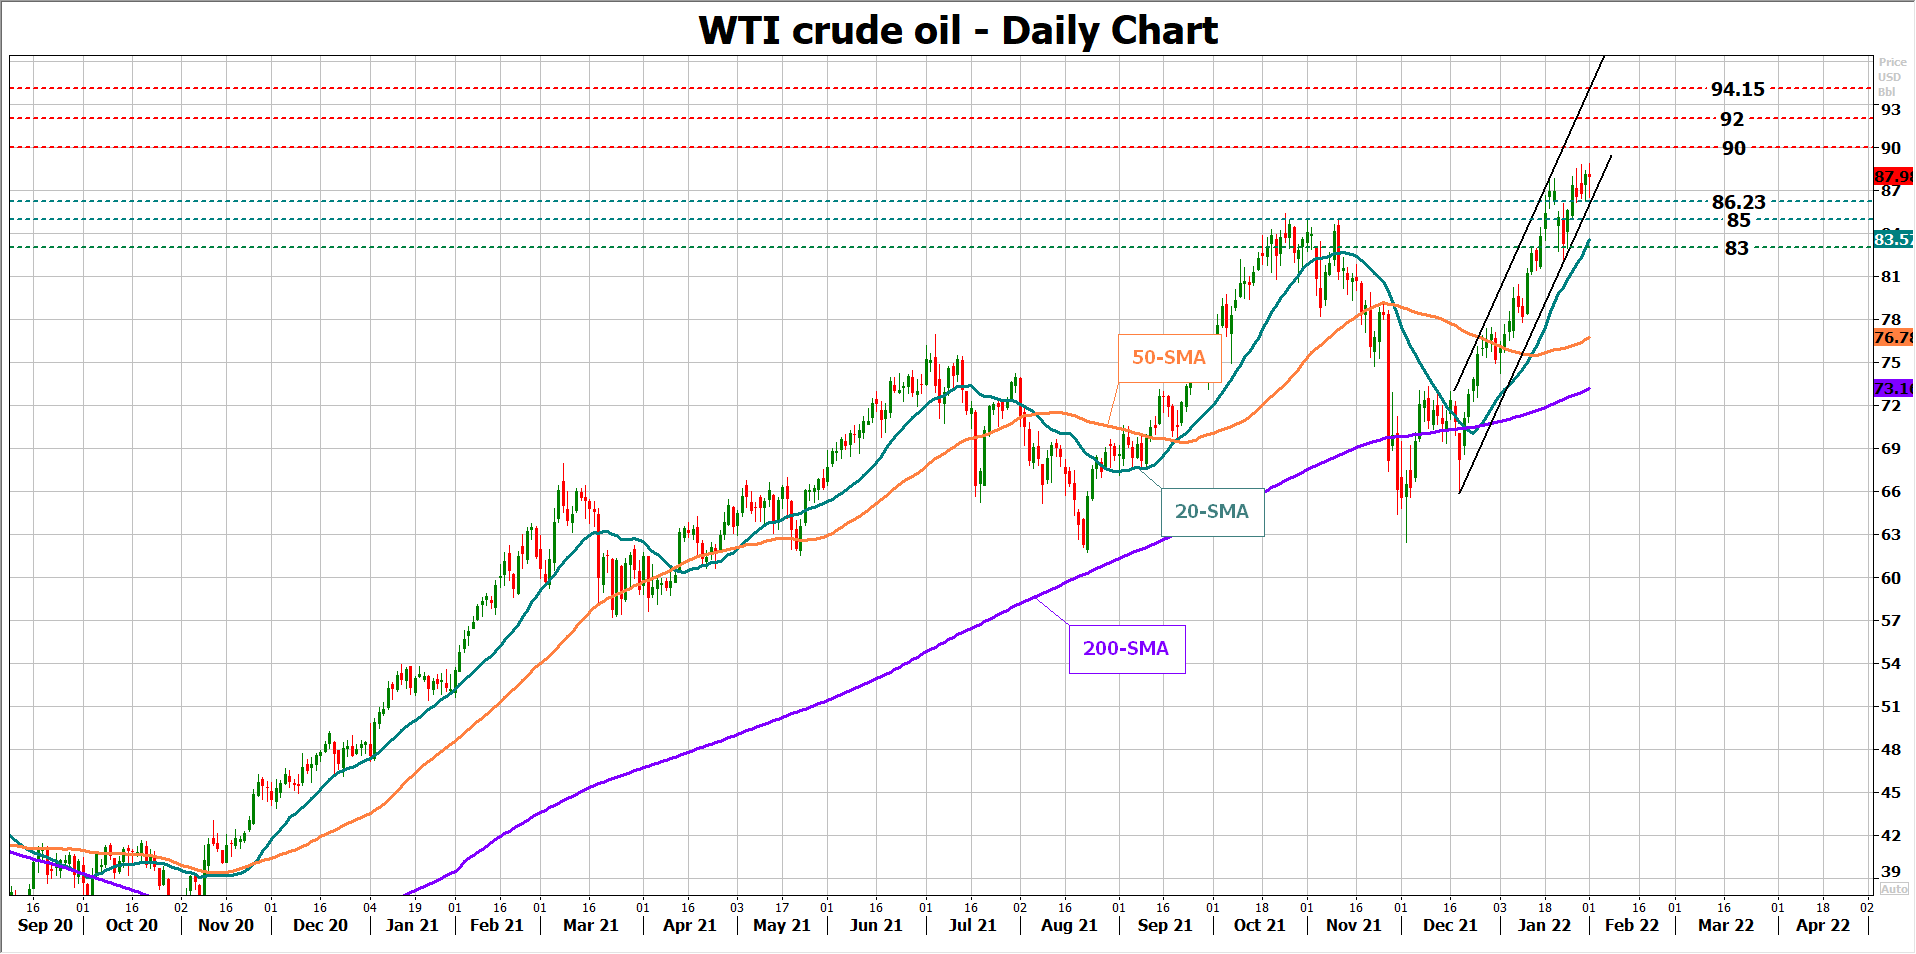
If OPEC+ oil exporters repeat the gradual increase of 400,000 bpd at a time when global economic activity asks for a stronger boost, WTI crude could crawl up to $90.00/barrel. A sharper ascend could stabilize around the resistance line at $92.00 before the $94.15 barrier comes on the radar.
In the event oil producers stress the need for a sharper increase, WTI could initially seek support around the nearby floor of $86.23. Failure to rebound here and an extension below the $85.00 round level would question the bullish trend in the market, bringing the $83.00 – $82.00 territory next on the radar. Yet, in the broad picture, the positive trajectory may stay in place as long as the price trades above the $62.00 level.
NZD/USD Recovery Could Fail Near 0.6680
Key Highlights
- NZD/USD started an upside correction from 0.6530.
- A major bearish trend line is forming with resistance near 0.6670 on the 4-hours chart.
- EUR/USD and GBP/USD recovered above 1.1250 and 1.3500 respectively.
- The US ISM Manufacturing Index declined from 58.8 (revised) 57.6 in Jan 2022.
NZD/USD Technical Analysis
The New Zealand Dollar declined heavily from well above 0.6850 against the US Dollar. NZD/USD even traded below the 0.6700 support level before the bulls appeared.
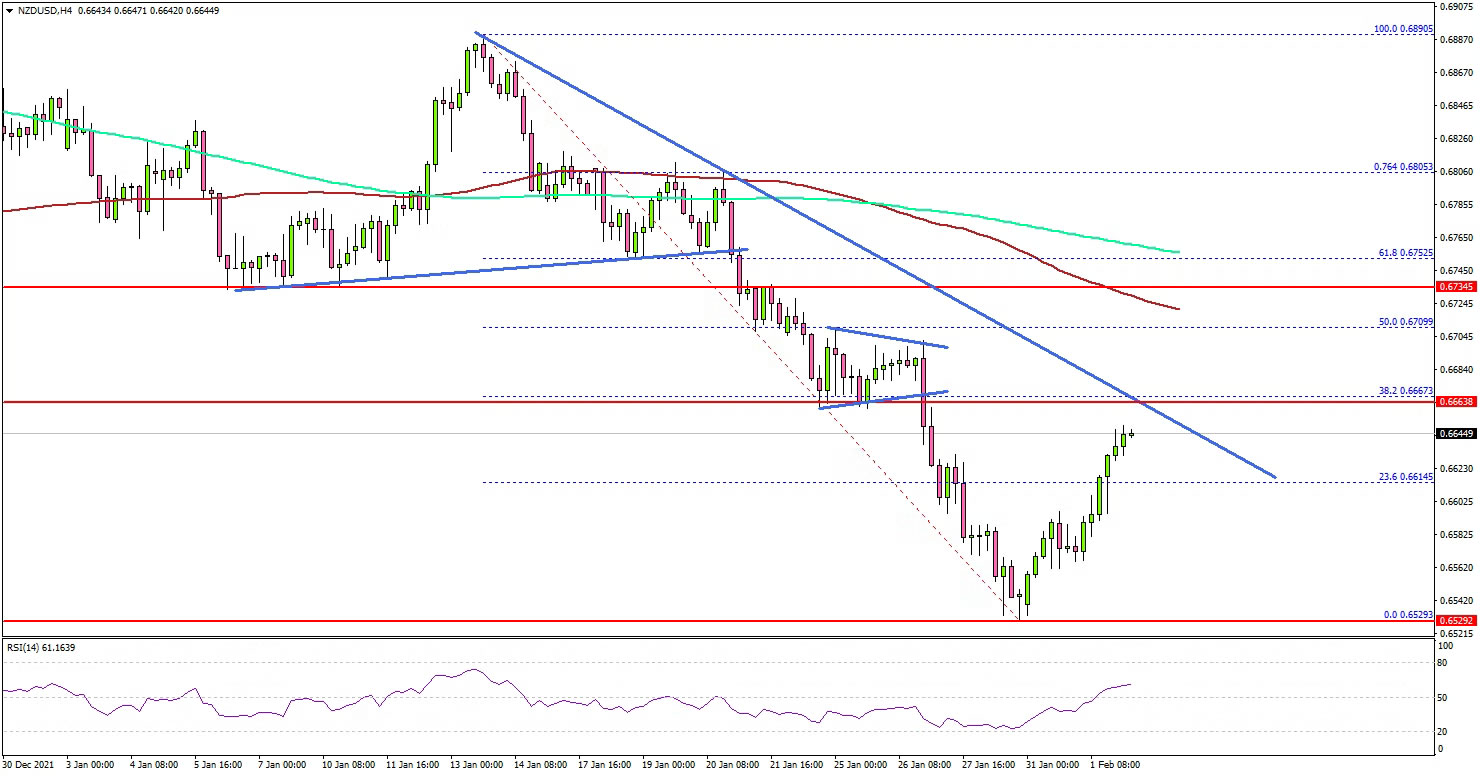
Looking at the 4-hours chart, the pair traded as low as 0.6529. There was a close below the 0.6700 pivot level, the 100 simple moving average (red, 4-hours), and the 200 simple moving average (green, 4-hours).
It is now correcting losses and trading above 0.6580. It even moved above the 23.6% Fib retracement level of the downward move from the 0.6890 swing high to 0.6529 low.
An immediate resistance is near the 0.6640 level. The first major resistance is near the 0.6670 zone. There is also a major bearish trend line forming with resistance near 0.6670 on the same chart. Any more gains could send the pair towards the 50% Fib retracement level of the downward move from the 0.6890 swing high to 0.6529 low at 0.6700.
If there is no upside break above 0.6670, the pair could start another decline. An immediate support is near the 0.6580 level. The next major support is near the 0.6550 level, below which it could test 0.6500.
Fundamentally, the US ISM Manufacturing Index for Jan 2022 was released yesterday by the Institute for Supply Management (ISM). The market was looking for a decline from 58.7 to 57.5 in Jan 2022.
The actual result was mixed, as there was a drop in the US ISM Manufacturing Index to 57.6. The last reading was revised up from 58.7 to 58.8.
Looking at EUR/USD, the pair started a recovery wave above 1.1200 and 1.1250. Similarly, GBP/USD recovered above the 1.3500 resistance zone.
Economic Releases
- Euro Zone CPI for Jan 2022 (YoY) (Prelim) - Forecast +4.4%, versus +5.0% previous.
- Euro Zone Core CPI for Jan 2022 (YoY) (Prelim) - Forecast +1.9%, versus +2.6% previous.
AUDUSD Wave Analysis
- AUDUSD reversed from support zone
- Likely to rise to resistance level 0.7150
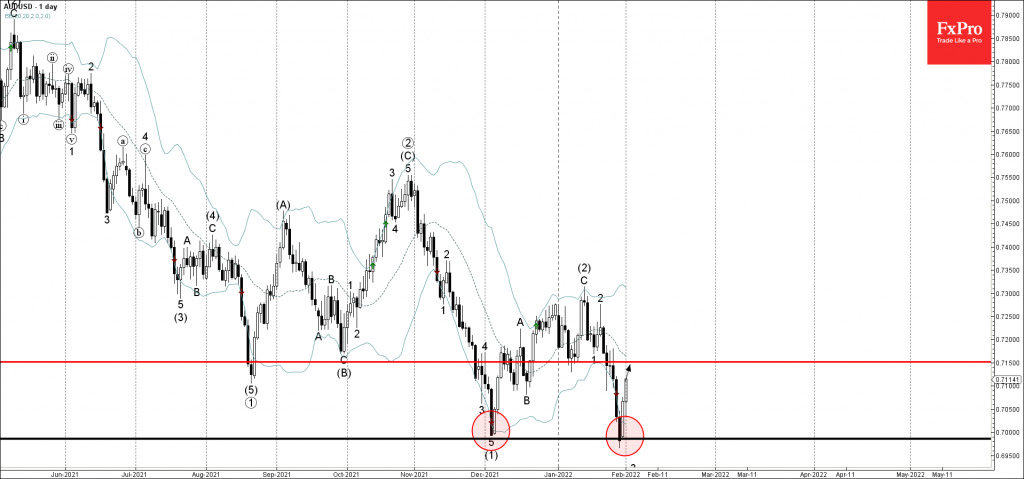
AUDUSD currency pair recently reversed up with the daily Bullish Engulfing the support zone lying between the round support level 0.7000 (previous monthly low from the start of December) and the lower daily Bollinger Band.
The upward reversal from this support are stopped the earlier minor impulse wave 3 of the impulse wave (3) from
Given the strength of the aforementioned support zone – AUDUSD can be expected to rise further toward the next resistance level 0.7150 (former support from the start of January).
EURGBP Consolidates But Reserves Bearish Tilt
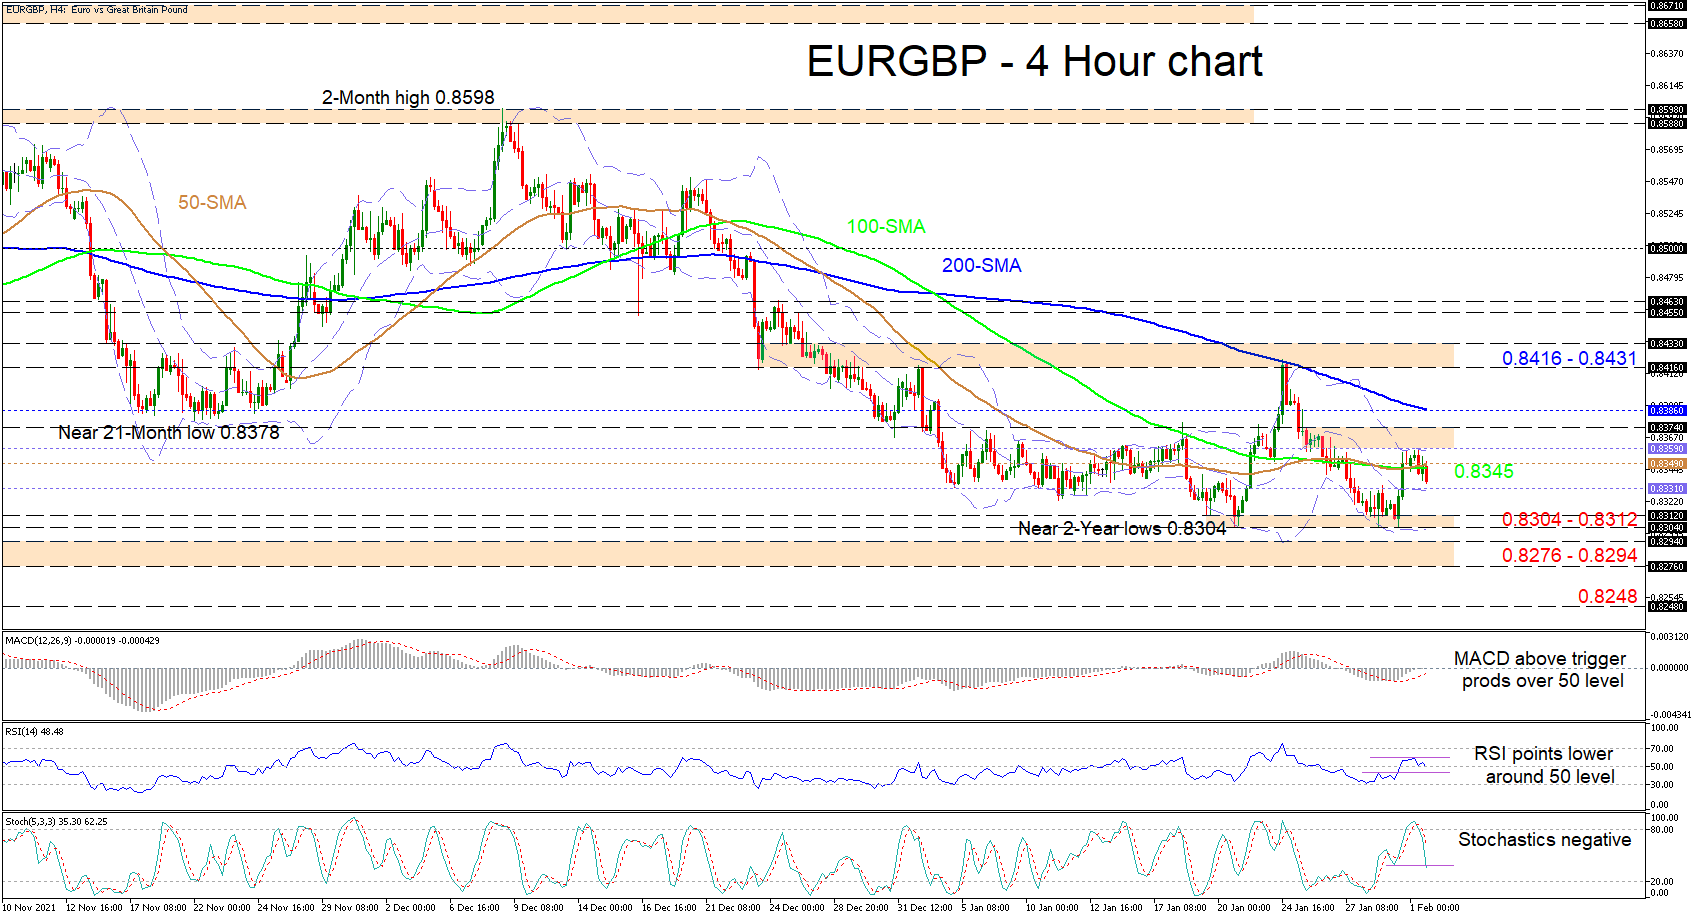
EURGBP has returned below its horizontally entwined 50- and 100-period simple moving averages (SMAs) following its fresh bounce at two-year low levels, which was curbed by the upper Bollinger band around 0.8359. The descending 200-period SMA is defending the bearish outlook, while the drifting 50- and 100-period SMAs are backing a sideways trend.
In addition, the static Bollinger bands have yet to disperse and thus infer that volatility has dropped, which could be a sign that a bigger price move could be around the corner. The short-term oscillators are mixed, reflecting opposing messages in momentum. The MACD remains north of the red trigger line and is toying with the zero threshold. On the other hand, the RSI has nudged below the 50 level, while the stochastic oscillator retains a negative charge, both promoting downward price action.
In the negative scenario, initial downside friction could occur at the mid-Bollinger band at 0.8331. Then the 0.8304-0.8312 support base formed by troughs recording two-year low levels could be challenged. If this hardened floor fails to dismiss bearish pressures, the price may slide toward the critical 0.8276-0.8294 support section, which was shaped by the December 2019 and February 2020 troughs. Should this boundary not act as an upside defence, the price could then target the 0.8248 low, identified back in July 2016.
Otherwise, if buyers re-emerge around the mid-Bollinger band and drive the pair over the 100- and 50-period SMAs at 0.8345 and 0.8349 respectively, resistance may then emanate from the upper Bollinger band at 0.8359 until 0.8374. Should buying interest endure, the descending 200-period SMA at 0.8386 could try to impede advances from gaining pace. However, if the price propels past the 200-period SMA, upside momentum could then come under the microscope as the bulls tackle the 0.8416-0.8431 resistance border.
Summarizing, EURGBP is exhibiting a neutral-to-bearish tilt below the 200-period SMA at 0.8386 and the 0.8416-0.8431 ceiling of the recent sideways market. A dive below 0.8276-0.8294 could significantly reinforce the bearish outlook, while a jump north of the 0.8416-0.8431 barrier is necessary to boost optimism in the pair.
USDCAD Marks Yet More Higher Lows; Bullish Forces Linger
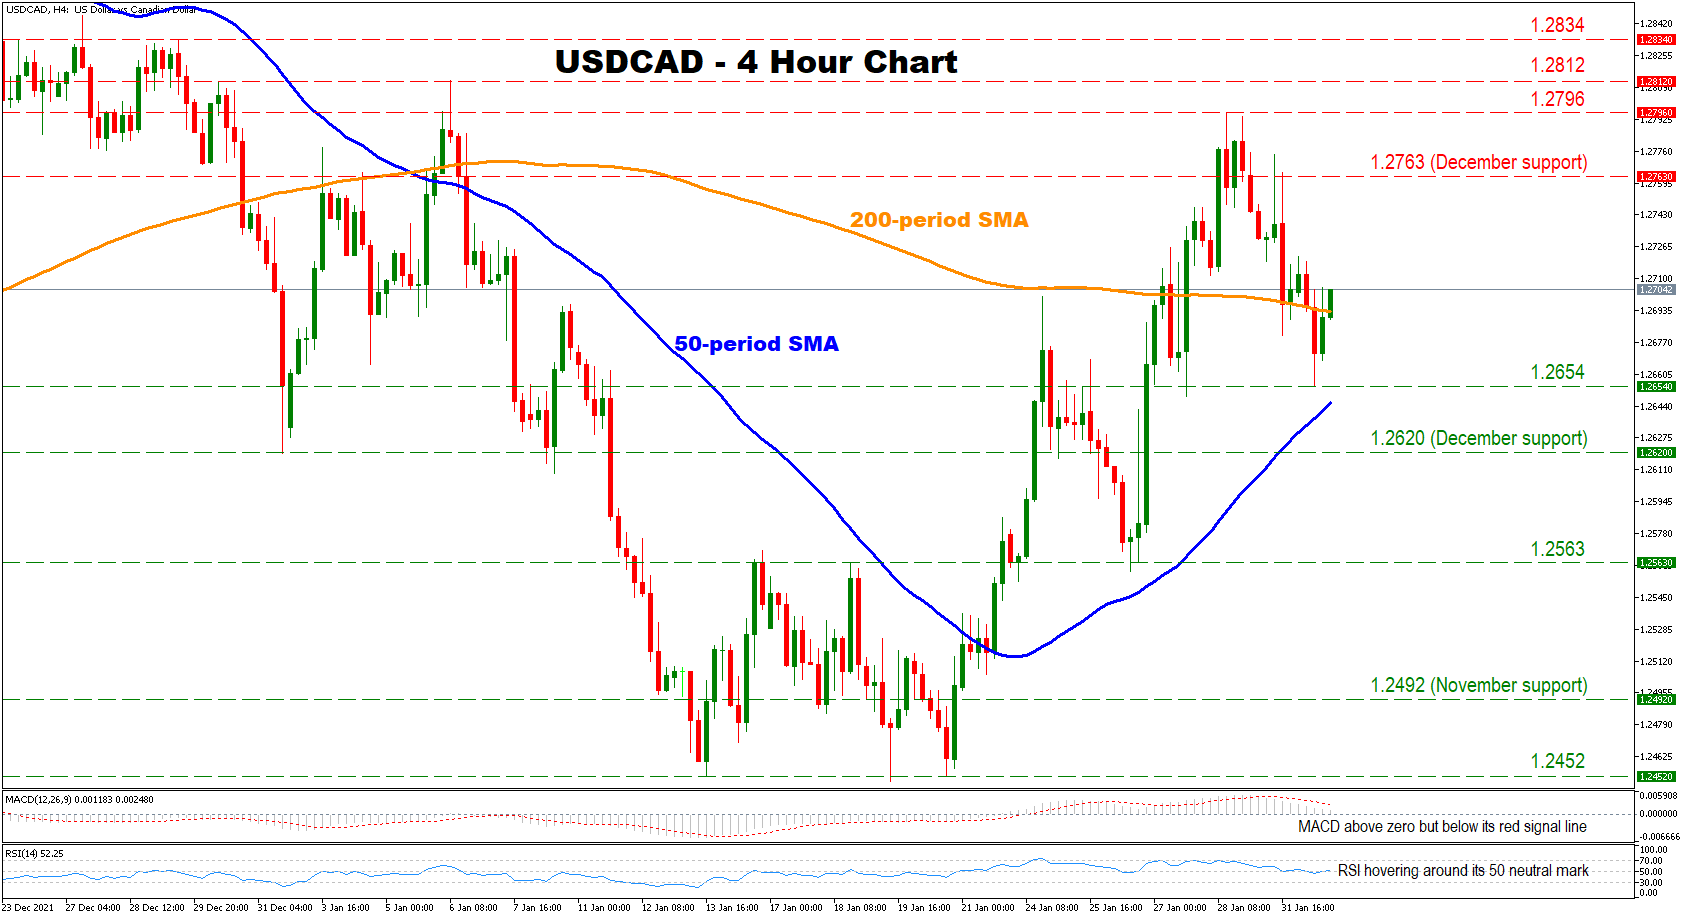
USDCAD has marked yet more higher highs and higher lows since mid-January as bullish forces linger. Moreover, the 50-period simple moving average (SMA) is closing the gap with the 200-period SMA, and if the former manages to cross above the latter, it would reinforce the case of a sustained bullish outlook.
Short-term momentum indicators are reflecting a mixed picture as the RSI is hovering slightly above its 50 neutral mark. However, the MACD is found below its red signal line despite being in positive territory, which indicates that the positive momentum might be losing steam.
Should the bulls maintain control, the December support at 1.2763 might be the first line of resistance, before buyers shift their attention towards the 1.2796 hurdle. A decisive move above the latter could mark yet another higher high, strengthening the pair’s positive momentum, which could send the price to test its 1.2812 and 1.2834 obstacles, consecutively.
On the flip side, initial support might be found at the 200-period SMA currently at 1.2693 before sellers eye the region which includes 1.2654 level and the 50-period SMA currently at 1.2646. A break below the latter could intensify selling pressures, opening the door towards the December support at 1.2620. Crossing below this point, sellers might then target the 1.2563 obstacle.
In brief, the short-term outlook for the pair is cautiously bullish. For sentiment to change, buyers would need to break below the 50-period SMA.
ISM Manufacturing Index Registers 20th Consecutive Month of Expansion in Spite of Omicron
January ISM manufacturing index fell to 57.6, just beating market expectations for 57.5. This marked a 1.2 percentage point decrease from the December reading of 58.8.
New orders decreased by 3.1 percentage points to 57.9, while new export orders increased by 0.1 percentage points to 53.7.
The backlog of orders sub-index came in at 56.4, falling 6.4 percentage points from December's 62.8 print.
The production index pulled back 1.6 percentage points to 57.8, while the employment index rose 0.6 percentage points to 54.5.
The supplier deliveries sub-index fell to 64.6 points from 64.9 in December. The sub-index continues to reflect difficulties in meeting deliveries due to production issues related to the pandemic.
14 of 18 manufacturing industries reported growth in January. Growth was led by Apparel, Leather & Allied Products; Furniture & Related Products; Miscellaneous Manufacturing, Nonmetallic Mineral Products; and Machinery.
Key Implications
The expansion rambles on and the manufacturing sector posted another month of gains in January. Amid ongoing supply chain issues and yet another wave of COVID-19 infections a slight deceleration was expected, but the sector proved resilient overall.
The start of 2022 offered plenty of room for missteps as the Omicron variant spread, but the increase in new orders is a testament to the resilience of demand. Just as important, supply chains are showing continued signs of healing, as the supplier delivery sub-index continues to fall (indicating that delivery times are lengthening at a slower pace). As this most recent wave wanes, this momentum should be carried into February, helping to ease the bottlenecks that have become characteristic of the economic recovery.
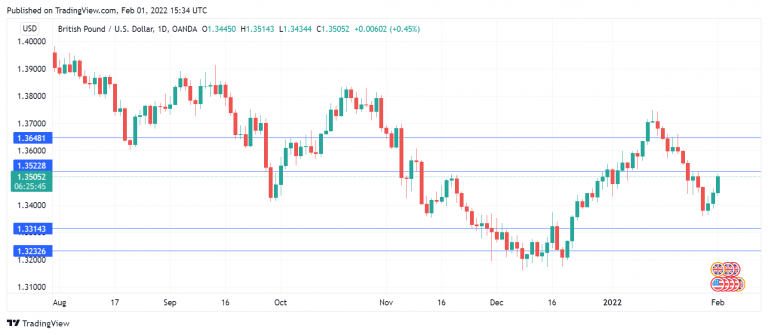
GBP Extends Gains, Pushes above 1.35
The British pound is up for a third straight day, as GBP/USD has rebounded after last week’s sharp losses. The pair is trading just above the 1.35 level in the North American session.
BoE expected to raise rates
Financial markets are predicting that the BoE will hit the rate trigger at Thursday’s policy meeting. A rate hike would mark the first back-to-back rate rises since 2004. This scenario seems a virtual certainty, with a rate hike priced in at almost 90 per cent.
The primary drivers behind a rate hike are the surge in inflation and the strength of the labour market. The markets are hawkish about a rate hike since the BoE appears to have underestimated how quickly inflation would rise and unemployment would fall. Following in the footsteps of the Federal Reserve, the BoE has acknowledged that inflation may prove to be more persistent than previously anticipated. Even though a rate hike has been priced in, if the BoE does follow through and raise rates, the pound could get a boost, especially if the MPC vote in favour of a hike is unanimous.
What happens after March?
The Federal Reserve is poised to raise rates for the first time in three years, with a lift-off at the March meeting a virtual certainty. After that, it seems anyone’s guess. Fed Chair Jerome Powell left guidance unclear at last week’s FOMC meeting, and said that the Fed was still undecided on the likely course of monetary policy this year. If the Fed is undecided about policy, it’s no wonder that the markets are in the dark as to how many rate hikes to expect. The forecast for the number of rate hikes we’ll see in 2022 ranges from 3 to 7, with speculation that the Fed could hike rates at every meeting this year if needed. If inflation remains red-hot despite several rate hikes, it’s likely that the Fed will implement additional hikes until inflationary pressures ease.
GBP/USD Technical Analysis
- GBP/USD has support at 1.3314 and 1.3232
- 1.3522 is under pressure in resistance. Above, there is resistance at 1.3648
XAU/USD Outlook: Gold Rises Above $1800 on Weaker Dollar But Fresh Bulls Need More Evidence
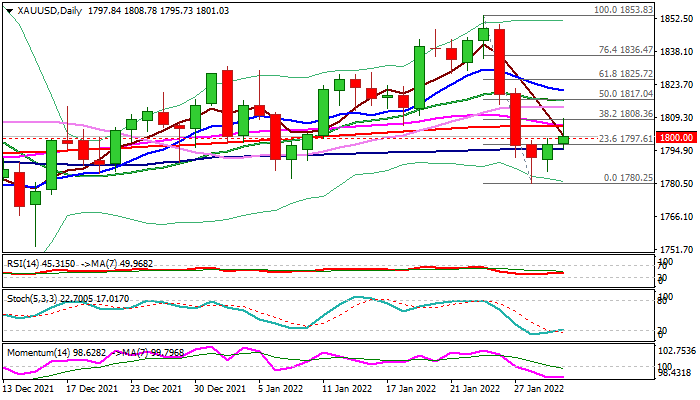
Spot gold regained traction after last week’s sharp post-Fed fall and bounced above key $1800 level.
Recovery from new 1 – 1/2 month low ($1780) extends into second day, driven by weaker dollar, as traders collected profits after euphoria on Fed’s hawkish signals for first rate hike in March and subsequent 3-4 increases until the end of the year faded, and more cautious tones were heard from the US policymakers.
Fed remains on course to end pandemic measures and start tightening policy as inflation skyrocketed but also wants to keep the door open amid uncertain outlook and still ongoing pandemic.
Fresh strength needs close above $1800 today to generate initial bullish signal, with extension above $1815/17 pivots (daily cloud top / 50% retracement of $1853/$1780 bear-leg) to confirm reversal.
Daily studies are still weak as 14-d momentum remains in the negative territory and moving averages remain above the price, with converged 55/200DMA’s on track to for a death-cross and add negative tone on technical outlook.
However, near-term action is expected to remain biased higher while holding above $1800, but the downside will remain vulnerable as long as the price action stays within the daily cloud ($1796/$1815), with more direction signals expected from Friday’s release of US non-farm payrolls for January.
Res: 1805; 1808; 1815; 1821.
Sup: 1800; 1796; 1785; 1780.
Pound Braces for First Back-to-Back Rate Hike by BoE Since 2004
The Bank of England is widely anticipated to raise interest rates to 0.50% on Thursday when it announces its decision at 12:00 GMT. Having already lifted the Bank Rate in December, the expected hike in February would make it the first time since 2004 that the BoE has tightened policy in two meetings in a row, underscoring not only the urgency to cap price growth but also just how long it’s been when inflation was last such a big threat. Yet, rate hike bets haven’t been powerful enough to defend the pound from the US dollar’s recent assault. Can a hawkish tone revive cable’s uptrend?
Worries about rising cost of living
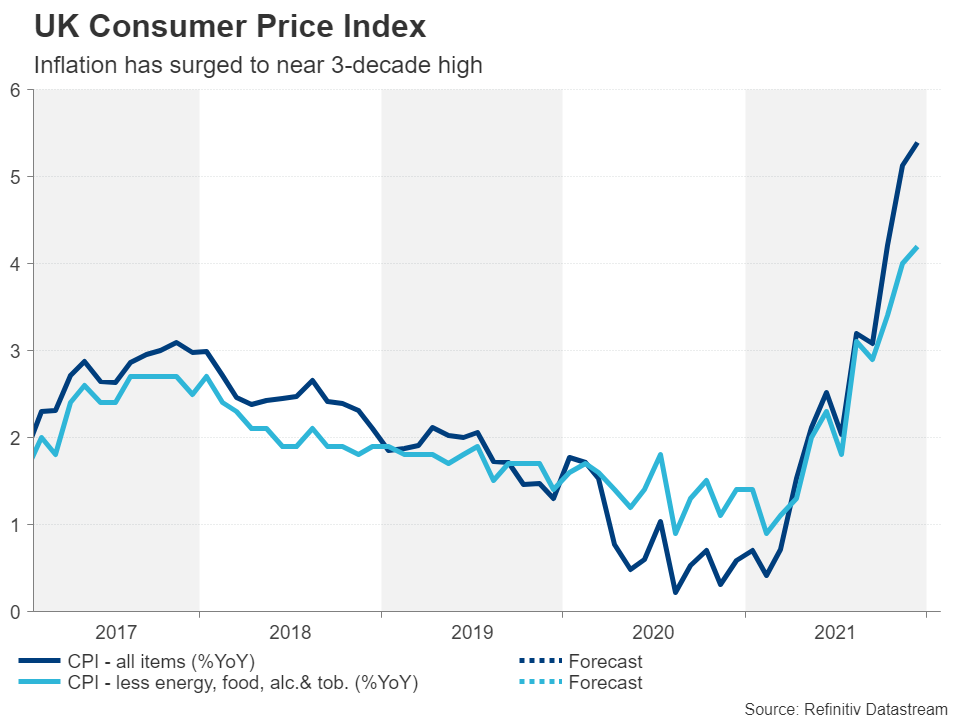
Inflation in the UK hit a near 30-year high of 5.4% y/y in December and the upsurge could get even greater in the coming months as energy bills are set to soar in April when the price cap is raised by the country’s regulator. With Britain’s labour market tightening very rapidly lately, the conditions are ripe for a wage-price spiral as employees feeling the strain of a jump in the cost of living find themselves with wage bargaining powers for the first time in years.
No shocks expected in February
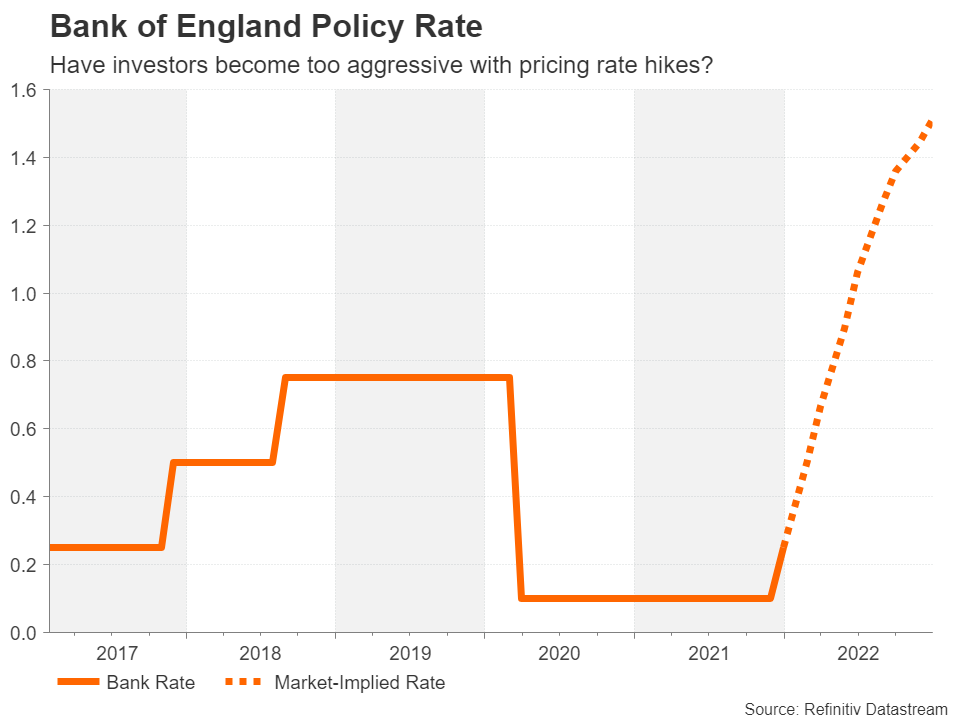
Money markets have fully priced in a 25 basis points rate rise in February, to add to December’s 15-bps increase that lifted the Bank Rate back up to 0.25% from historic lows. But the rate hike expectations don’t stop there as investors are betting on at least four additional increases during the course of the year. Interestingly, the Bank of England is one of the few central banks that generally tends to agree with market pricing, nudging traders in the right direction only if it sees a risk of it missing its 2% inflation target by following the market-implied path.
Policymakers tried to do this back in the Autumn when they first started to panic about higher inflation. But their clumsy communication still ended up wrong-footing many investors in both November and December. That’s not likely to happen this time round, although the BoE could still surprise in two ways on Thursday.
Will BoE flag danger ahead?
Firstly, the Bank’s quarterly Monetary Policy Report will be crucial in letting markets know whether the current implied path is consistent with hitting 2% inflation within the forecast period. The main risk here is that policymakers might think markets have become too aggressive with rate hike expectations.
Whilst it’s fair to say that the UK economy is fairly strong right now and the recovery has been impressive given that it suffered more than all other major economies from the initial pandemic meltdown, the outlook is as uncertain as ever. British consumers face a double squeeze in spending power over the next few months, as apart from the looming surge in fuel bills, they are also about to be struck by higher taxes in the form of an increase in national insurance contributions.
Combined with a rise in borrowing costs, spending by both households and businesses could take a major hit and the Bank might make a point of stressing this risk in its report. However, policymakers’ recent hawkish rhetoric suggests this won’t be a significant concern for them at this point and the bigger question mark heading into the meeting is what the Bank will say concerning the balance sheet.
Balance sheet runoff eyed
Like the Fed, the BoE’s balance sheet has ballooned during the pandemic and with inflationary pressures emerging from all over the place, a decision on reducing it is more than likely. Policymakers already signalled last year that the balance sheet could begin to shrink when the Bank Rate reaches 0.50% instead of their previous guidance of 1.50%. However, they could go one step further than that and announce the outright selling of assets, namely, gilts.
In all likelihood, a decision on the latter will be saved for a later date and the most investors should expect is the balance sheet will be allowed to run off by not reinvesting in maturing bonds. Nevertheless, Governor Andrew Bailey could hint at a future sale of bonds in his press briefing, potentially boosting gilt yields.
Pound finding its feet again
The UK 10-year yield has just crossed above 1.30% for the first time since March 2019 and a further spike could help sterling claw back some of its recent losses against the greenback. The $1.35 and $1.36 level are key targets for cable in the near-term as they stand in the way of re-challenging the January top of $1.3748. Only a break above this high can restore the pound’s bullish posture.
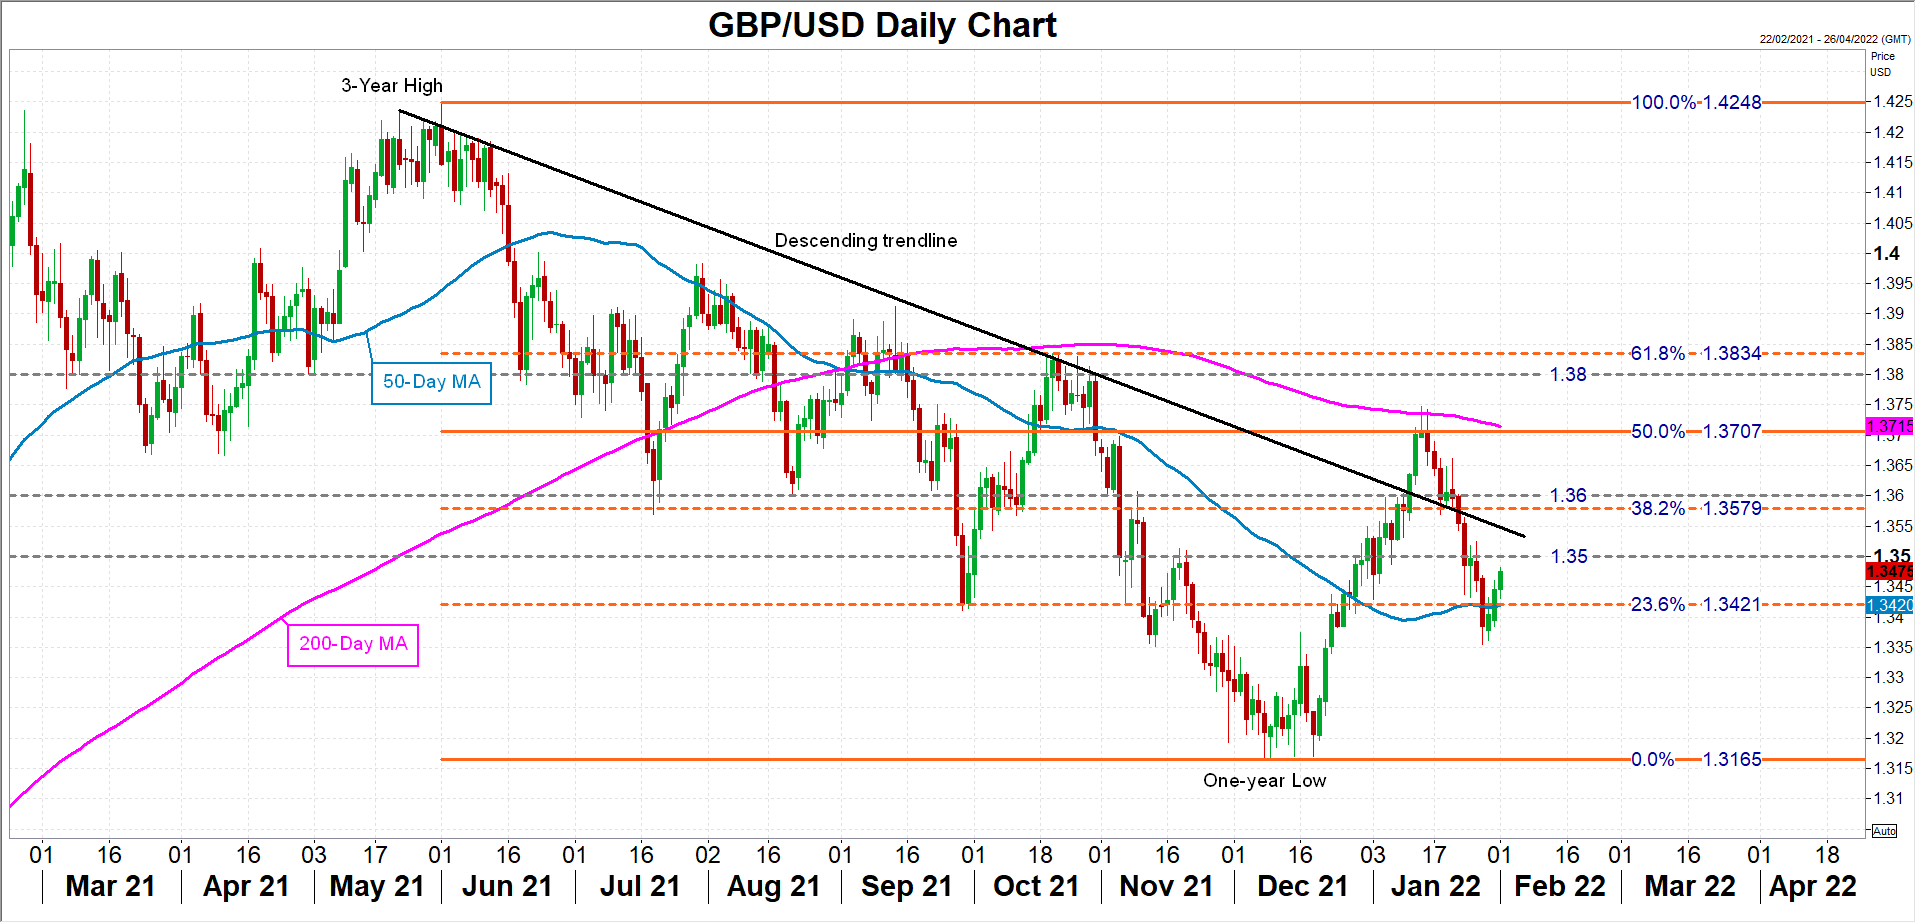
Alternatively, if the BoE tries to talk down some of the more hawkish market expectations, cable can slip back below its 50-day moving average and revisit December’s one-year trough of $1.3165.
In the meantime, the pound has been paying little attention to the happenings in No. 10 Downing Street where Boris Johnson is under pressure to resign. The stripped-down report into the alleged breaches of lockdown rules by Downing Street staff, including the Prime Minister, has found there were serious failings in leadership. Johnson has apologised and appears to be clinging on for now. However, the police are also investigating some of those events and the full report that is expected to be published after the police inquiry has ended could be more damning. Thus, the drama for Johnson is far from over.