Sample Category Title
EUR/USD Elliott Wave Analysis: More Weakness ahead
The USD slowed down as US stocks turned higher on Friday, but this can be only a temporary slowdown as stocks may remain in downtrend due to risks between US and Russia. However, there are RBA, BOE and ECB, scheduled for this week, which can be catalysts for some dollar resistance, especially as other CB may follow the FED.
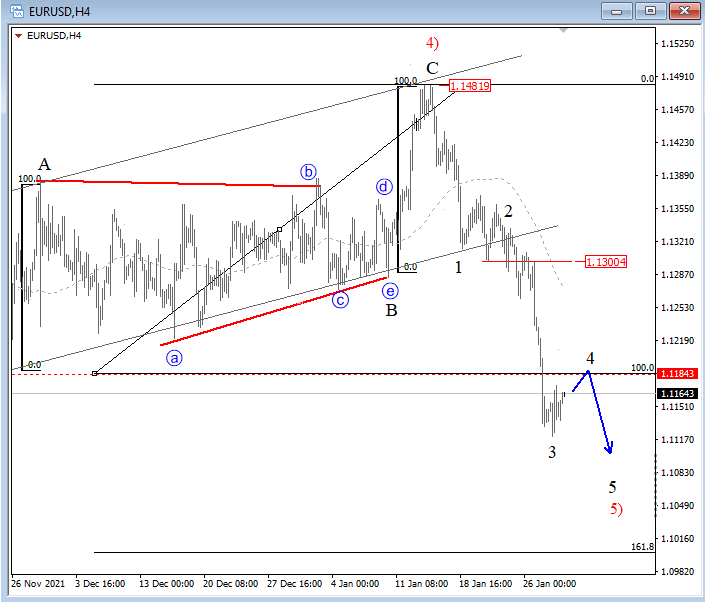
EURUSD is coming to the downside on 4h chart, now even accelerating after hawkish FED last week, so it appears that more weakness is in play now for a fifth wave, which should be completed by a five-wave cycle. This can then be the final leg of wave C) when looking at higher degree waves.
EUR/USD 4h Elliott Wave analysis
EUR/USD Outlook: Limited Correction Likely to Precede Fresh Weakness
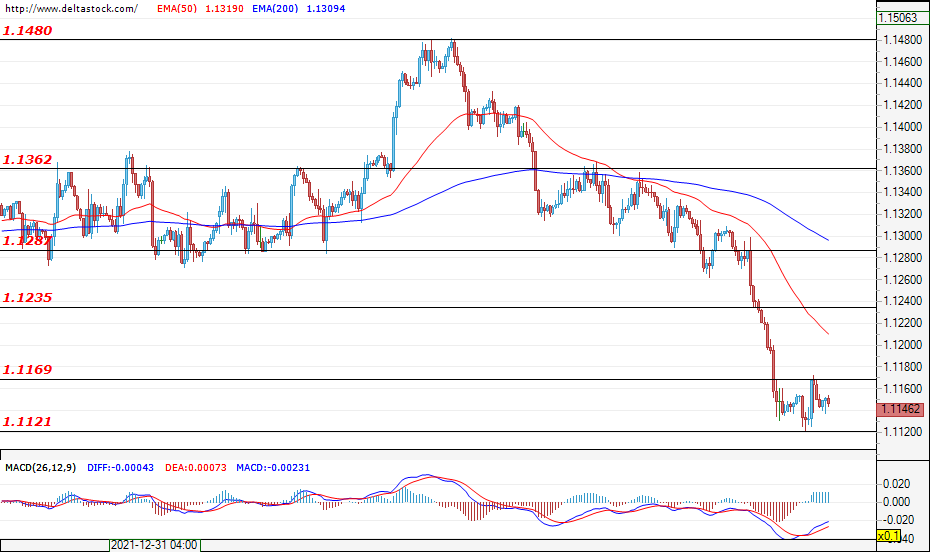
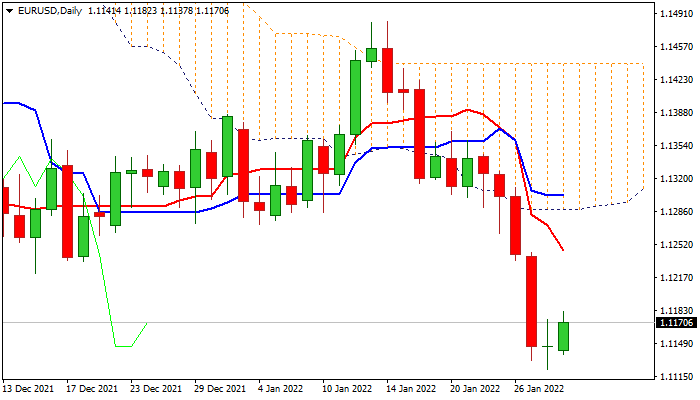
Bears are consolidating above new seven-month low (1.1145, posted on last week’s 1.74% fall) on Monday, with limited bounce before larger bears regain full control, seen as likely scenario.
Oversold stochastic on daily chart signals correction, but 14-period momentum on both, daily and weekly chart, remains deeply in negative territory, reinforcing underlying bearish bias.
Upticks should be capped by strong barriers at 1.1260/90 zone (Fibo 38.2% of 1.1482/1.1121 bear-leg / base of thick daily cloud) to keep bears in play for fresh push towards targets at 1.1040/00 (Fibo 76.4% of 1.0635/1.2349 / psychological).
Fundamentals may also work against the single currency, as ECB is expected to stay on hold on its policy meeting due later this week, that would add to concerns about accelerating divergence from the US Federal Reserve, after the Fed chief Powell sent signals for four rate hikes this year.
Res: 1.1200; 1.1260; 1.1290; 1.1305.
Sup: 1.1121; 1.1100; 1.1040; 1.1000.
US Dollar Index: Dollar Pulls Back from New Multi-Month High on Overbought Conditions
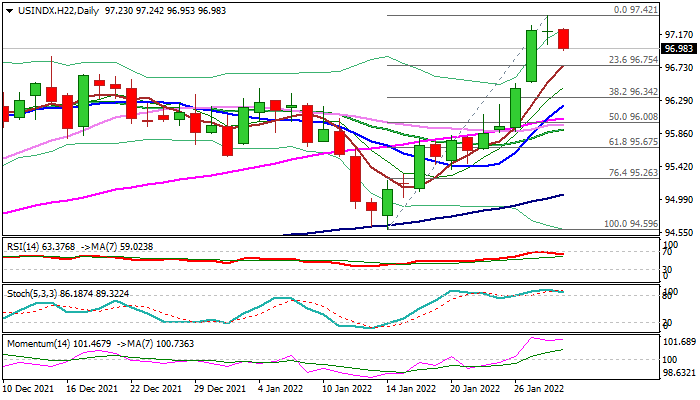
The dollar index edges lower in early Monday’s trading, following last week’s 1.6% advance (the biggest weekly rally since early June 2021) that resulted in hitting the highest in 18 months.
The greenback was lifted by growing expectations for US rate hikes after more hawkish than expected Fed (market expectations for four rate hikes by the end of the year rose above 90%), increased demand for safe-haven assets amid growing geopolitical tensions and weak and volatile equities.
The dollar is on course for solid gains in January, with long-tailed monthly candle suggesting that the downside is well protected and adding to positive signals.
However, overbought conditions on daily chart suggest bulls may take a breather, with bearish close on Monday to complete reversal pattern and signal correction.
Initial support lays at 96.75 (5DMA/Fibo 23.6% of 94.59/97.42 upleg), with extended dips expected to find firm ground at 96.30 zones (top of thick daily cloud/Fibo 38.2% of 94.59/97.42 upleg/rising 10DMA) to keep larger bulls in play and offer better buying opportunities.
Caution on potential loss of 96.30 zones supports that would risk deeper pullback towards 96.00/95.67 (Fibo 50% and 61.8% retracement respectively).
Res: 97.42; 97.78; 98.00; 98.20.
Sup: 96.75; 96.45; 96.30; 96.00.
Dollar Stands Tall, Stocks Rescued by Dip Buyers
- Dollar defends gains, awaits barrage of US economic data
- Stocks bounce back, yen retreats as nerves calm down
- Three major central bank meetings and tech earnings lie ahead
Risk tone improves
Market volatility has returned with a vengeance this month. A sharp repricing in the trajectory for interest rates has sent nervous investors scrambling to insulate their portfolios from any further damage, mostly by reducing leverage and moving higher along the quality spectrum.
Money markets have fully priced in five quarter-point rate increases by the Fed for this year and a similar path for economies like the United Kingdom, Canada, Australia, and New Zealand. This has propelled yields on government bonds much higher, which acts like gravity for riskier assets, knocking the wind out of the stock market.
The good news is that this correction reflects changing views about market conditions, not the real economy. Central banks are trying to raise rates precisely because their economies are solid enough to withstand that, so even though investors might protest, it is ultimately a healthy sign.
As long as recession alarms are not going off, any correction in equities seems like a longer term opportunity in a market that is still starved for yield, especially with valuations becoming more reasonable. This might be what helped Wall Street bounce back on Friday to close the week higher, along with some cheerful earnings from Apple.
Dollar remains elevated, yen retreats
The dollar has been a natural winner in this environment, benefiting both from bets that the Fed will take a sledgehammer to inflation and from the general flight to safety.
Traders have started to flirt with the idea that the Fed could kick off its tightening cycle in March with a shock-and-awe rate hike of 50 basis points after policymakers refused to rule that out. As such, this week’s data releases could be crucial for the greenback, with Friday’s employment report likely to steal the show.
Meanwhile, the beaten-down commodity currencies are enjoying a rare show of strength to start the week while the defensive Japanese yen is on the ropes, mirroring the improvement in risk sentiment. Even the beleaguered euro managed a small rebound after Mario Draghi stayed on as Italian prime minister, fueling hopes he might get to implement a growth-friendly agenda.
China slows, central bank fiesta ahead
Over the weekend, Chinese business surveys painted a grim picture of the world’s second largest economy as the draconian responses to covid outbreaks held back demand and exacerbated supply shocks.
Chinese markets will stay closed for the entire week in celebration of the Lunar New Year, along with other financial hubs across Asia in the next few days. This implies that liquidity will be even thinner during the Asian trading session, putting traders on alert for sharp moves or even flash crashes.
There isn’t much on the agenda for today but the rest of the week promises to be very entertaining with central bank meetings in Australia, the Eurozone, and United Kingdom, the latest edition of nonfarm payrolls, and earnings results from tech heavyweights like Google and Amazon. The Reserve Bank of Australia will get the show rolling early on Tuesday.
With the economy improving, there is growing speculation the RBA will end asset purchases immediately and signal that rate hikes are on the menu this year. However, that might not be enough to lift the aussie, as policymakers could also warn that the five rate hikes currently priced into markets by December are excessive.
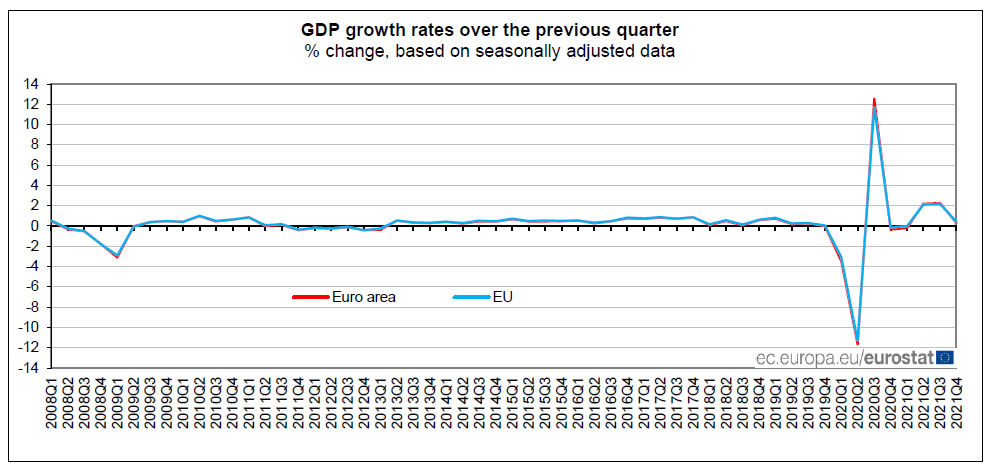
Eurozone GDP grew 0.3% qoq in Q4, EU up 0.4% qoq
Eurozone GDP grew 0.3% qoq in Q4, slightly below expectation of 0.4% qoq. EU GDP grew 0.4% qoq. The 2021 annual growth was at 5.2% based on first estimation for both Eurozone and EU.
Among the EU Member States for which data are available, Spain (+2.0%) recorded the highest increase compared to the previous quarter, followed by Portugal (+1.6%) and Sweden (+1.4%). Declines were recorded in Austria (-2.2%), Germany (-0.7%) and in Latvia (-0.1%). The year on year growth rates were positive for all countries.
Aussie Storms Higher, RBA Next
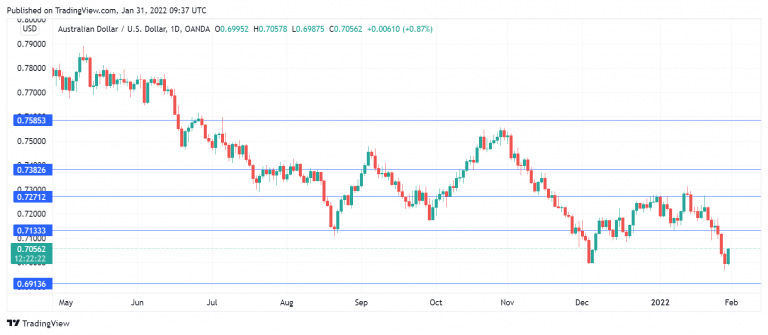
We continue to see significant volatility from the Australian dollar. Last week, AUD/USD plunged 2.51%, its worst week since mid-August. After three straight days of losses, the currency has roared back with gains of close to 1% and is back above the symbolic 0.70 level.
The RBA meets on Tuesday and is expected to maintain the Cash Rate at a record low of 0.10%. Still, it will be a significant meeting, as the central bank will wind up its QE programme after 15 months and also revise upwards its inflation forecast.
The Australian recovery continues to gather steam. The labour market has strengthened and inflation continues to rise, although not at the levels we’re seeing in the US and the UK. The unemployment rate has dropped to 4.2% and core CPI has climbed to 2.6%. These are good numbers, but not quite good enough to justify a rate hike in the eyes of the RBA. Governor Lowe has stated that he wants to see unemployment at 4.0% and inflation “sustainably” around 2.5% before he will press the rate trigger. The main factor restraining the RBA from a hike remains wage growth, which is around 2.2%. Lowe has said wages must rise to 3% before a rate move; otherwise, the rise in inflation is temporary.
The RBA had said it would not raise rates until 2024 but has been forced to bring forward its forecast, with unemployment falling and inflation rising more quickly than the bank expected. The most likely scenario is liftoff in the third quarter of 2022 and the markets hope to get more insight from Lowe at Tuesday’s meeting.
In the US, the Fed’s favorite inflation metric, the Core PCE Price Index, rose in December 4.9% y/y, up from 4.7% and above the forecast of 4.8%. This marks the highest gain since 1983 and reinforces expectations that the Fed will act aggressively to curb surging inflation. The markets have priced in five rate hikes in 2022, with the CME Group’s FedWatch pricing in a March hike of a quarter-point at 85%.
AUD/USD Technical
- AUD/USD faces resistance at 0.7133. Above, there is resistance at 0.7271
- There is support at 0.6913 and 0.6831
NZDUSD Reached 16-month Low; Bearish Forces Linger
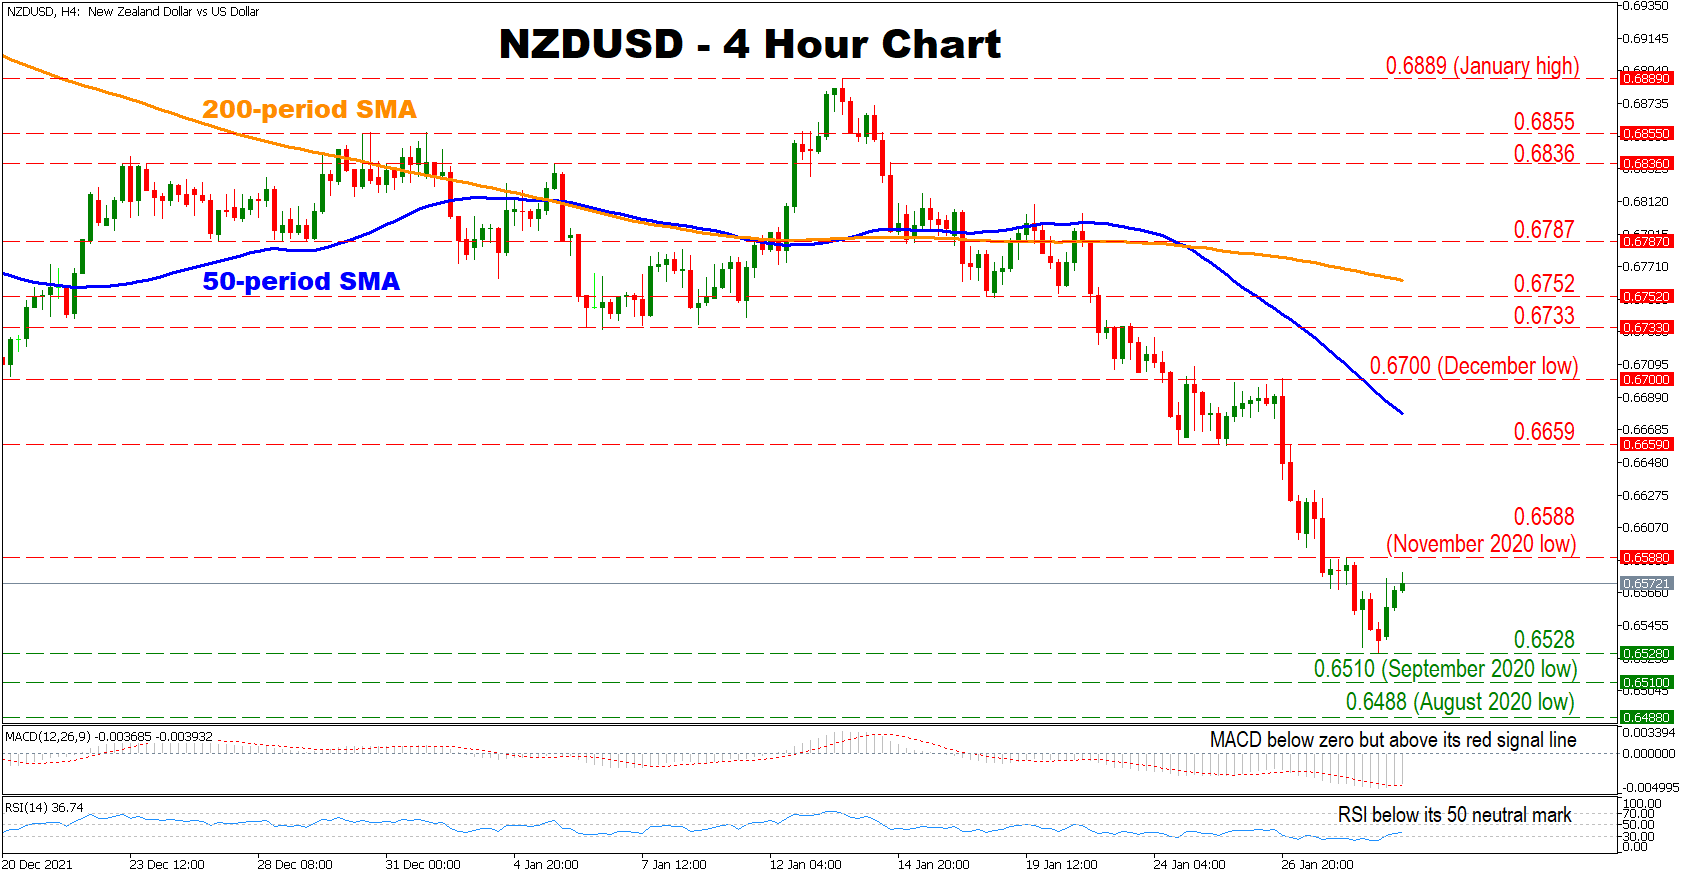
NZDUSD continued its retreat in January reaching a 16-month low amid strong negative forces. Moreover, the pair is currently trading way below its 50- and 200-period simple moving averages (SMA), with the former crossing below the latter, reinforcing fears of a sustained bearish outlook.
Short-term momentum indicators are reflecting a mixed picture as the RSI is located below its 50 neutral mark. However, the MACD is found above its red signal line despite being in negative territory, which indicates that the negative momentum might be fading.
Should the bears maintain control, initial support might be found at the 0.6528 hurdle. Crossing below this point could intensify selling pressures, opening the door towards the September 2020 low at 0.6510. A break below the latter might shift seller’s attention towards the August 2020 low at 0.6488.
On the flip side, initial resistance might be found at the November 2020 low at 0.6588, before buyers eye the 0.6659 obstacle. A decisive move above this point could send the price to test the 50-period SMA currently at 0.6679. Surpassing the latter could turn the fortunes around for the pair, sending the price to test the December low at 0.6700 and the 0.6733 barrier, consecutively.
In brief, the short-term outlook for the pair is bearish. For sentiment to change, buyers would need to break above the 50-period SMA.
Gold’s Collapse Subsides but Downside Risks Remain
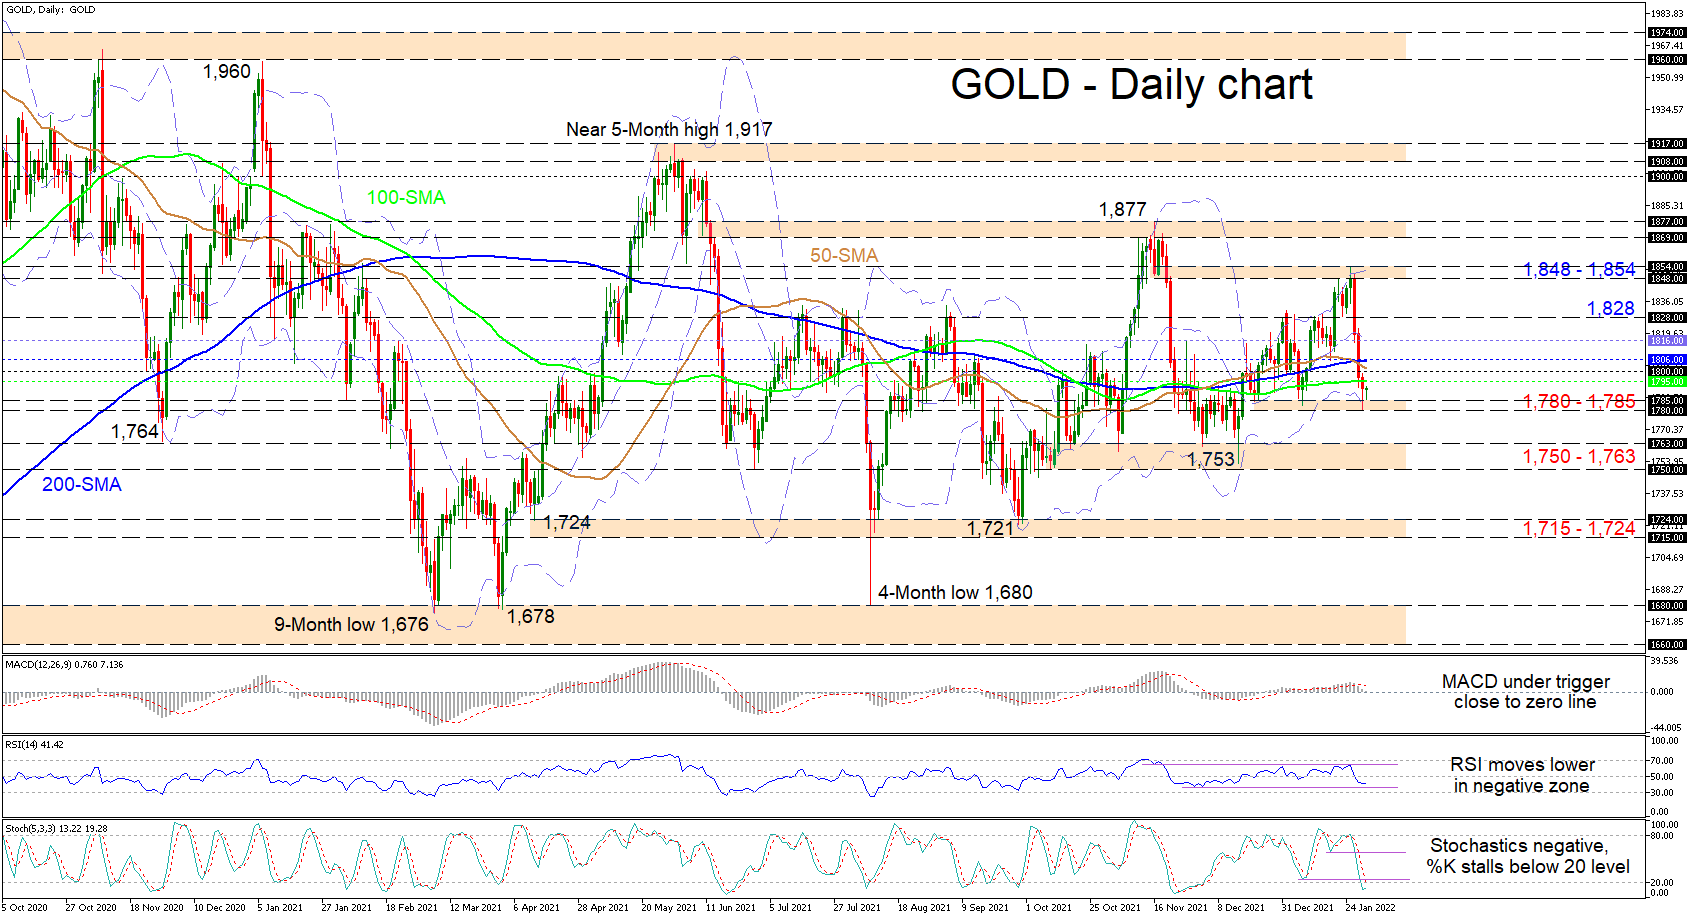
Gold has found some footing in the vicinity of the lower Bollinger band and recent trading session troughs, following a freefall in the commodity - due to a more aggressive message from the Federal Reserve regarding rate hikes in 2022 - from 1,854, which extended below the simple moving averages (SMAs) and the 1,800 handle. The dipping 50-day SMA is reflecting that the trend in the commodity has become increasingly negative.
The short-term oscillators are skewed to the downside but have yet to fully validate that bearish momentum could continue to run hot. The MACD is falling below its red trigger line but has yet to pierce beneath the zero threshold, while in oversold territory, the stochastic %K line, is hinting that negative pressures have become somewhat frail for now. Nonetheless, the RSI is diving in bearish regions, promoting growing downside momentum in the commodity.
In the negative scenario, support could originate from the 1,780-1,785 area, where the lower Bollinger band also resides. If selling interest intensifies again, the price may then tackle the 1,750-1,763 support barricade, which began to take shape around October 2021. A breach of this medium-term base could then cheer sellers to aim for the 1,715-1,724 border that has opposed negative pressures since April 2021.
On the other hand, if buyers manage to find some traction off the lower Bollinger band, an initial zone of resistance could start to emerge from the 100-day SMA at 1,795 until the 200-day SMA at 1,806. Overstepping this crowded section of obstacles, the upside momentum may then stall around the mid-Bollinger band at 1,816. However, if the bulls remain energized, they could drive the price past the inside swing low of 1,828 and challenge the 1,848-1,854 resistance barrier.
Summarizing, gold is sustaining a neutral bias despite recent significant selling. That said, buyers could regain an upper hand if the price pilots above the mid-Bollinger band, while sellers would take the lead should the price slide below 1,780-1,785. Furthermore, the precious metal has been oscillating for more than half a year between 1,715 and 1,877.
EURUSD Recoups Some Losses from 20-Month Low; Broader Outlook is Bearish
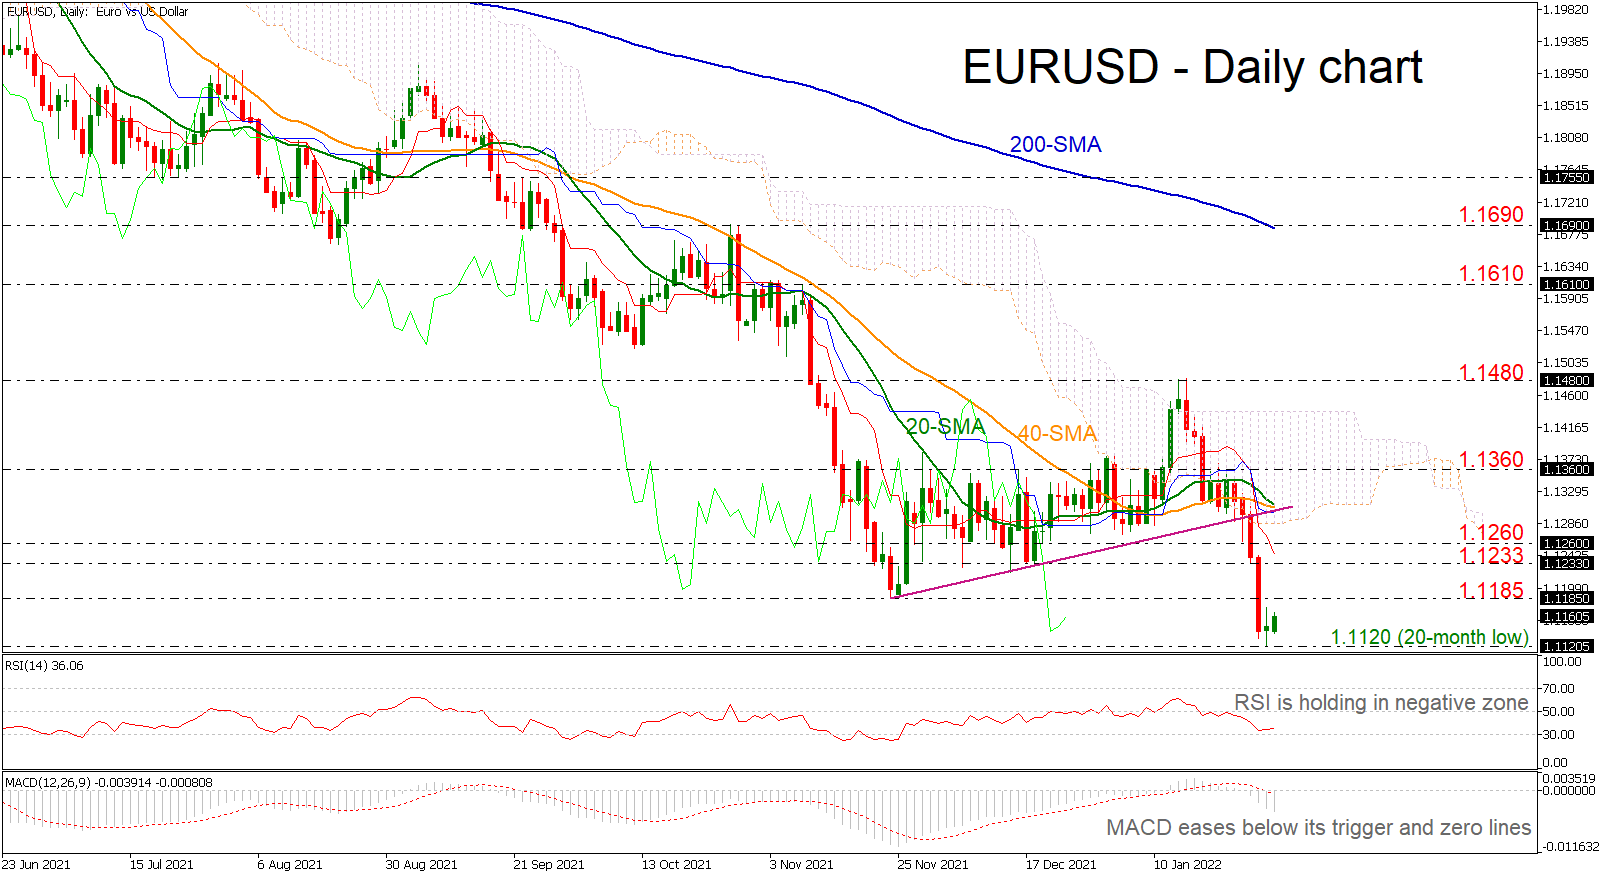
EURUSD rebounded off the 20-month low of 1.1120 that it posted in the previous week after the aggressive downside move below the short-term ascending trend line.
Technically, the 20- and 40-day simple moving averages (SMAs) are ready for a bearish cross in the short-term, and the MACD oscillator is extending its bearish structure below its trigger and zero lines. However, the RSI indicator is pointing upwards in the negative region.
A successful move higher, may find immediate resistance at the 1.1185 barrier ahead of the 1.1233-1.1260 restrictive zone. Surpassing these levels, the bulls may re-challenge the lower surface of the Ichimoku cloud at 1.1290, which stands near the rising line and the short-term SMAs. If the bulls retake charge, the 1.1360 barrier could come in focus.
In the negative scenario, if there is a drop below the latest low of 1.1120, the currency pair could slip until the 1.1015 support, taken from the inside swing low of April 2020. Steeper declines could open the way for a dive until the 1.0765 hurdle, registered in May 2020.
All in all, EURUSD has been in a somewhat upside recovery over the last couple of days, but the broader outlook has shifted to bearish after the new lower low.