Sample Category Title
Fed George: Appropriate to move earlier on the balance sheet
Kansas City Fed President Esther George said Fed's policy normalization approach could be more aggressive on balance sheet reduction, rather than faster rate hikes.
"What we do on the balance sheet is likely to affect the path of policy rates and vice versa," George said during an event "For example, if we took more aggressive action on lowering, pulling down that balance sheet, it might allow for fewer interest rate increases."
He added that raising short-term interest rate while maintaining a large balance sheet "could flatten the yield curve", and lead to "reach-for-yield behavior from long-duration investors."
"All in all, it could be appropriate to move earlier on the balance sheet relative to the last tightening cycle," she said.
Elliott Wave View: Bitcoin (BTCUSD) Recovery In Progress
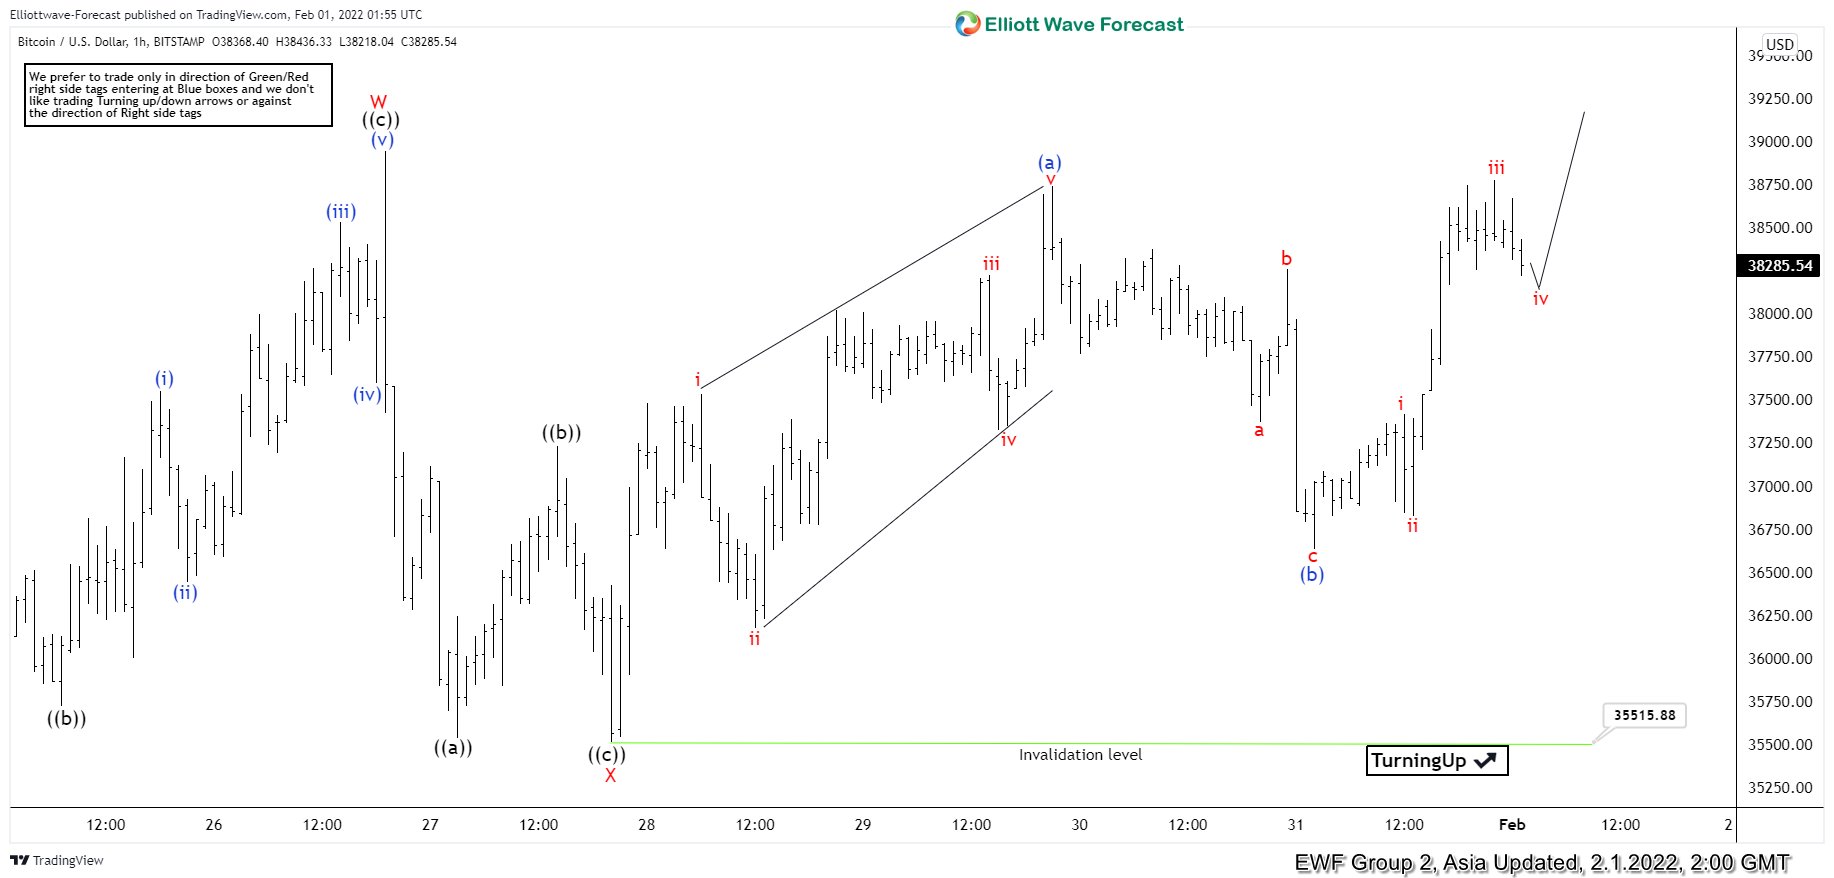
Short Term Elliott Wave view in Bitcoin (BTCUSD) suggests the rally from January 24, 2022 low is in progress as a double three Elliott Wave structure. Up from January 24 low, wave W ended at 38946 and pullback in wave X ended at 35511.32. Wave X has a zigzag structure subdivision as the 1 hour chart below shows. Down from wave W, wave ((a)) ended at 35535, wave ((b)) ended at 37230 and wave ((c)) ended at 35515.88. Wave Y is currently in progress with internal subdivision as a double three in lesser degree.
Up from wave X, wave i ended at 37534.15 and wave ii ended at 36173.98. Wave iii ended at 38225.27, wave iv ended at 37327.79, and wave v ended at 38741.67. This completed wave (a) in higher degree. Wave (b) pullback ended at 36631.66 with internal subdivision as a zigzag. Down from wave (a), wave a ended at 37372.59, wave b ended at 38262.55, and wave c ended at 36631.66. Wave (c) higher is in progress with potential target of 100% – 161.8% Fibonacci extension of wave (a). This area comes at 39862.01 – 40624.37 where wave (c) of ((w)) may end. Near term, as far as pullback stays above 35515.88, expect Bitcoin to extend the recovery higher.
Bitcoin 1 Hour Elliott Wave Chart
GBP/USD Could Recover If It Clears 1.3500
Key Highlights
- GBP/USD started a major decline from well above 1.3600.
- A key bearish trend line is forming with resistance near 1.3480 on the 4-hours chart.
- EUR/USD is attempting a recovery wave above 1.1180.
- The US ISM Manufacturing Index could decline from 58.7 to 57.5 in Jan 2022.
GBP/USD Technical Analysis
The British Pound declined heavily below 1.3600 against the US Dollar. GBP/USD even traded below the 1.3550 support level to enter a bearish zone.
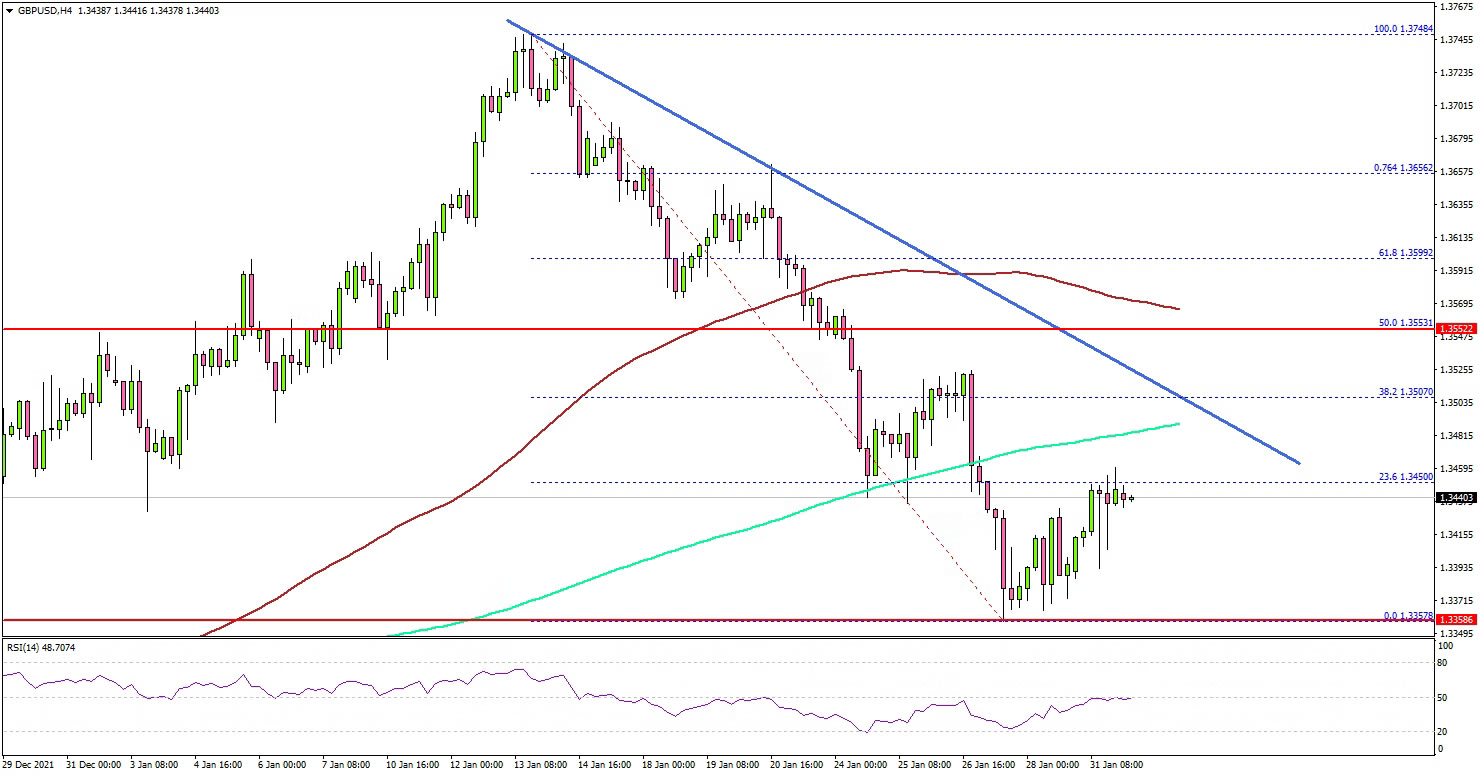
Looking at the 4-hours chart, the pair gained below the 1.3500 level, the 100 simple moving average (red, 4-hours), and the 200 simple moving average (green, 4-hours).
Finally, there was a move below the 1.3400 level and a low is formed near 1.3357. It is now correcting higher and trading above 1.3400. An immediate resistance is near the 1.3480 level. The first major resistance is near the 1.3500 zone.
There is also a key bearish trend line forming with resistance near 1.3480 on the same chart. Any more gains could send the pair towards the 50% Fib retracement level of the downward move from the 1.3748 swing high to 1.3357 low.
If there is no upside break above 1.3500, the pair could start another decline. An immediate support is near the 1.3380 level. The next major support is near the 1.3365 level, below which it could test 1.3280.
Looking at EUR/USD, the pair could recover if there is a clear move above the 1.1220 resistance zone in the near term.
Economic Releases
- Germany’s Manufacturing PMI for Jan 2022 - Forecast 60.5, versus 60.5 previous.
- Euro Zone Manufacturing PMI for Jan 2022 – Forecast 59.0, versus 59.0 previous.
- UK Manufacturing PMI for Jan 2022 – Forecast 56.9, versus 56.9 previous.
- US Manufacturing PMI for Jan 2022 – Forecast 55.0, versus 54.0 previous.
- US ISM Manufacturing Index for Jan 2022 – Forecast 57.5, versus 58.7 previous.
ECB Policy Meeting: Dovish Tune with Hawkish Beats
The euro has been brutally knocked down by the US dollar lately and the big question now is whether the Eurozone's impelling calendar events could help the common currency find its feet this week. The European Central Bank’s policy announcement will be the major highlight on Thursday at 12:45 GMT. Although no changes are expected, traders will be eagerly looking for any hawkish language twists, especially if those follow stonger-than-expected preliminary CPI inflation readings and a smaller unemployment rate on Tuesday. Retail sales will be next watched on Friday, but the US nonfarm payrolls could steal the show later in the day.
ECB to stay out of the hawkish club
While several major central banks have unwrapped or have already put their rate hike plans into action, the ECB is among the few which are still not willing to join the hawkish club. Although Eurozone's inflation topped at a historically high of 5.0% y/y in December and policymakers project an above-target average rise of 3.2% this year, ECB chief Christine Lagarde has clearly telegraphed that an increase in interest rates is unlikely in 2022. Of course, she underlined that the central bank would do its job if its “inflation criteria are satisfied”, but as long as its forecasts point to a slowdown below 2.0% in 2023 and 2024, there is no need for discussion yet.
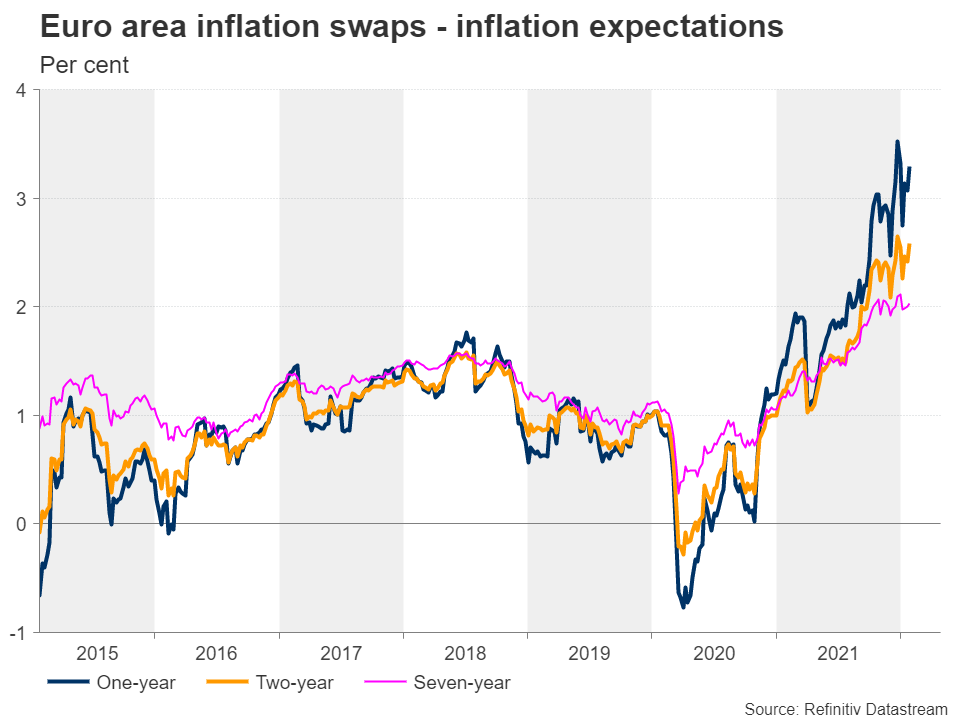
Investors, however, are not very convinced. Despite some stabilization in inflation expectations for the next year and for the following two and five years as reflected in inflation swap rates, they believe that two rate hikes of 10-basis-point modest rate hikes of up to 20 basis points are possible this year, starting in September the earliest, while some others bet that interest rates will crawl up to 0% by the end of 2023.
Inflation may keep teasing monetary policy in the future
Well, perhaps markets are right and reasonably influenced by some key dovish ECB policymakers who have recently said that investors should not attach too much importance to the prospect of price growth falling below the 2% goal in 2023 and 2024.
In addition, the key driver behind the price acceleration is the elevated cost of energy products, marking a 26% annual growth in December. Besides the prolonged boost from the pandemic related supply constraints, the European Union’s seven-year Next Generation programme, which aims to make the bloc the world’s first carbon-neutral region by 2050, could also contribute to higher prices if member states face tougher carbon-energy taxation.
In the financial world, the eurozone's bond market could face more damage if higher interest rates in other regions encourages investors to move their funds out of the bloc. Hence, a wide divergence from other central banks could leave the ECB at a disadvantageous position. Simultaneously, the euro may keep trending downwards in the face of a dovish ECB, making imports more expensive. The latter could result in additional inflation pressures.
Economic recovery in focus
Still, the above could be a longer-term problem. At the current juncture, the eurozone's economic recovery is lagging other advanced regions and is far from certain. Unlike US GDP, which surpassed its pre-pandemic levels during the summer, expansion in the 19-nation bloc has not breached that threshold yet. Of course, the unemployment rate has returned to normal levels, but it is still well above the ones in the UK and the US, while its trade balance has sharply deteriorated, posting a deficit in November for the first time in more than eight years.
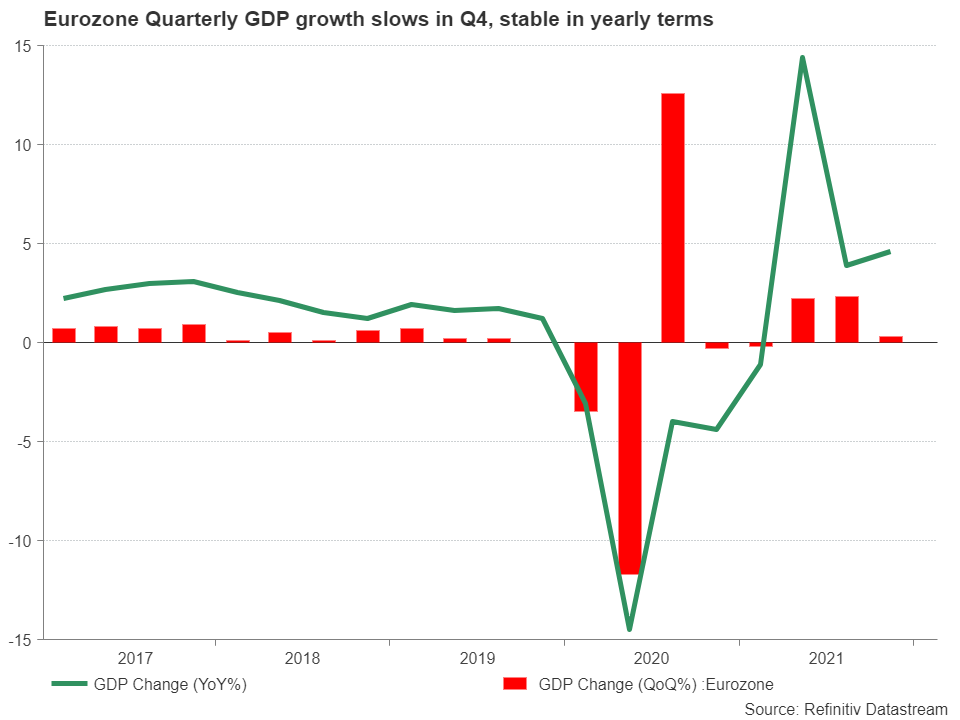
Not to mention its political landscape, which could face more hiccups later in the year when the French election takes place, while rising tension in Eastern Europe could generate more anxiety.
Same dovish tune but some hawkish beats could move the euro
Hence, the central bank could sing the same dovish tune for now to keep markets calm, but it could balance its tone with some hawkishness to count for the inflation uncertainty, perhaps by reiterating December's statement that monthly regular asset purchases will be diminishing after the pandemic-led PEPP program ends in March but adding that a faster pace of reductions will also be considered if the inflation situation worsens.
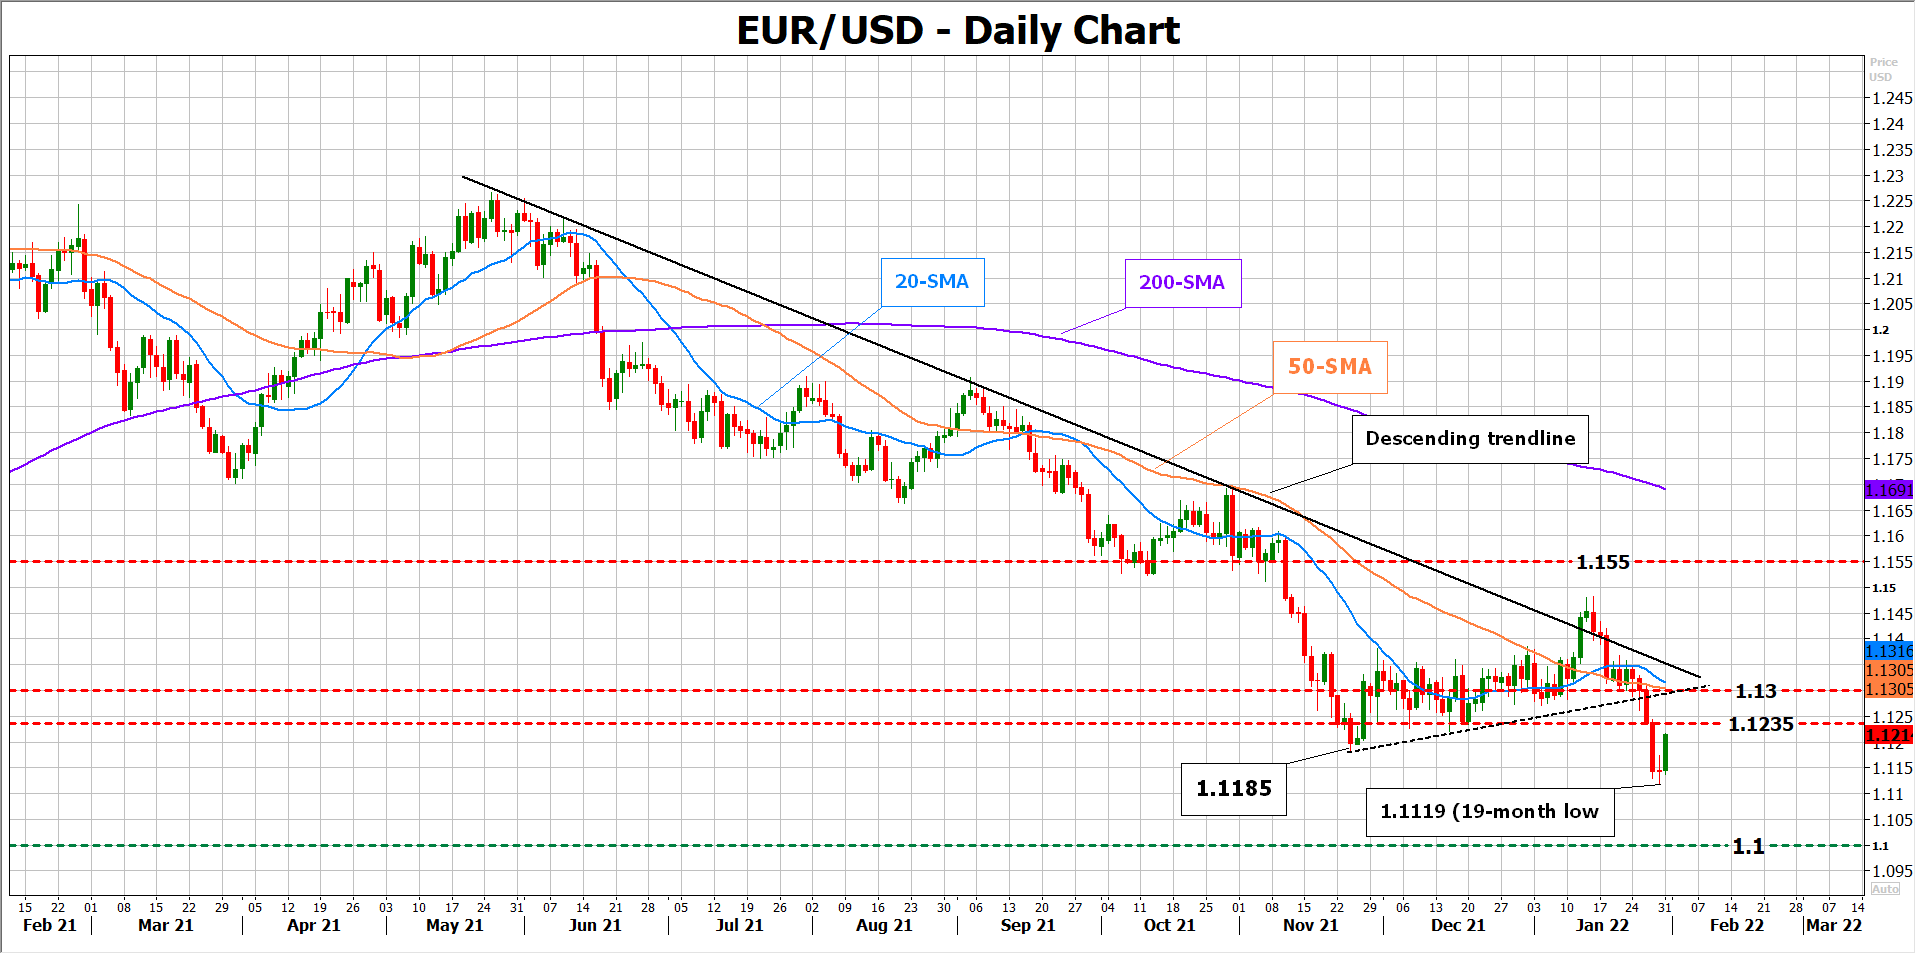
Turning to FX markets, unless investors translate some of the language into new hawkish twists, a steady policy by the ECB may not aggressively move the euro. Nevertheless, Wednesday’s CPI inflation figures for January could send some earlier signals about the central bank’s stance, likely creating some volatility ahead of the meeting. Expectations point to a slowdown to 4.3% y/y from 5.0% before, though an upside surprise cannot be excluded given the faster-than-expected growth in German flash CPI readings. If forecasts are right, inflation would still be among the highest over the past three months, but the pullback in CPI measures could still justify an accommodative attitude, with the euro likely extending its weakness towards the 1.1000 level against the dollar in the aftermath.
Otherwise, if the data come in stronger than expected, with the unemployment rate declining below the 7.1% forecast, the ECB may find it hard to control investors’ rate hike projections. In this case, euro/dollar may attempt to crawl above 1.1185 and run towards the 1.1235 nearby barrier. Higher, the focus will turn to the 1.1300 mark.
Future Looks Gloomy for Crypto Market
The crypto market had a rough start of the year, declining by more than 20% due to the hawkish Federal reserve statements. As a result, the crypto market's capitalization lost 45% and fell to $1.64 trillion, the lowest since August 2021.
Altcoins are falling increasingly faster than the first cryptocurrency, causing an increase in the share of BTC, which is already 42.3% against 39.3% lows in mid-January. Bitcoin's 40% share looks like a turning point that triggered a correction in the crypto market twice before.
The correction is not over
It is well-known the crypto market has a strong positive correlation with the US stock market. This fact should reduce optimism among crypto investors as of the end of trading Tuesday, January 25, 2022, is now, officially, the worst-ever start in the history of the S&P 500.
Some traders hold a belief, called the January barometer, the investment performance of the S&P 500 in January can predict its performance for the rest of the year. If this belief turns out to be true, the crypto market will face a rough year.
Reasons for the pressure
The first reason is macroeconomic news from the USA. According to the Fed's January meeting, the US regulator can raise interest rates faster and earlier. The market is pricing five rate hikes up to 1.5%. Technology companies will remain under pressure with this market trend, dragging the cryptocurrency market into a deeper correction.
The instability of the situation with the cryptocurrencies regulation in Russia also pressures the market. The Russian Central Bank announced that trading and mining cryptocurrencies would be prohibited. Fortunately, later, President Vladimir Putin joined the discussion and offered to regulate cryptocurrencies operations instead of blocking them.
Russia is the third country in the world by mining hash rate. Therefore, the crypto market is highly dependent on the final decision of the Russian government.
Technical analysis
BTC/USD, weekly chart
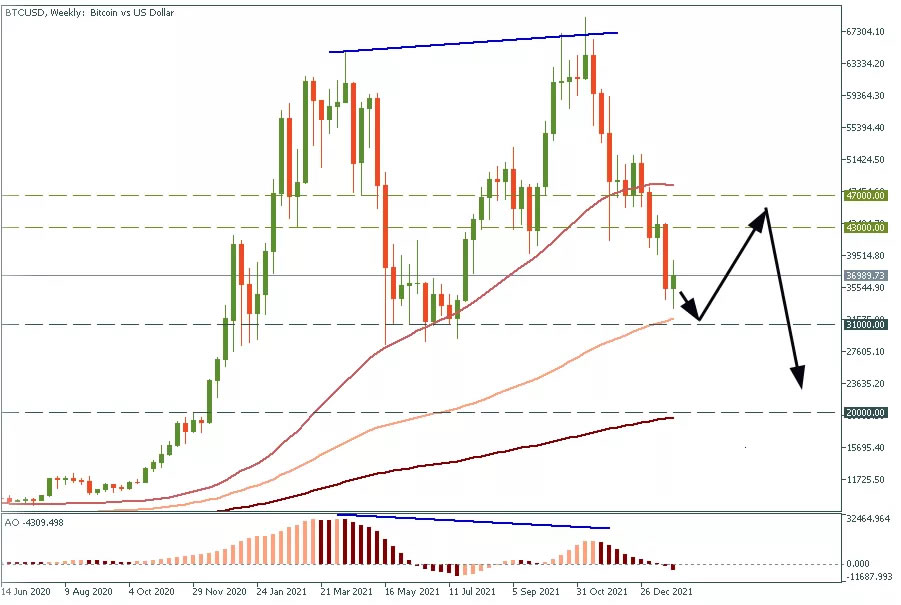
The bearish divergence appeared on the weekly Bitcoin chart. At the moment, the price is trading above the key support level of $30 000. However, we expect Bitcoin not to break this support through right away. Instead, it will rise to $43 000 - $47 000, form a bull trap, and crush down to $20 000 as the Federal Reserve increases the interest rate.
ETH/USD, monthly chart
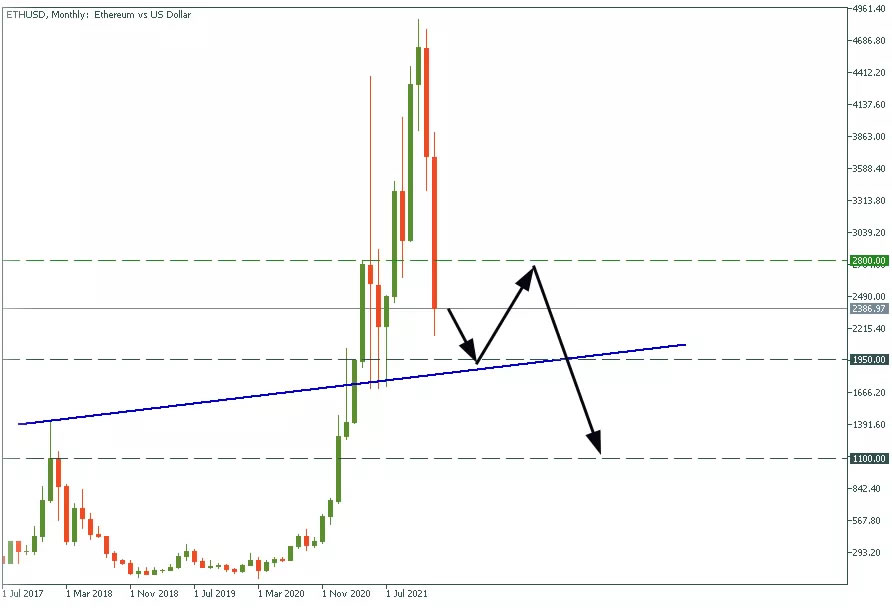
Ethereum will follow "the big brother" and decline down to $1900 first with a solid bounce up to $2800 after. Then, when the price finishes the head-with-shoulders pattern, it will decline to $1100.
BNB/USD, weekly chart
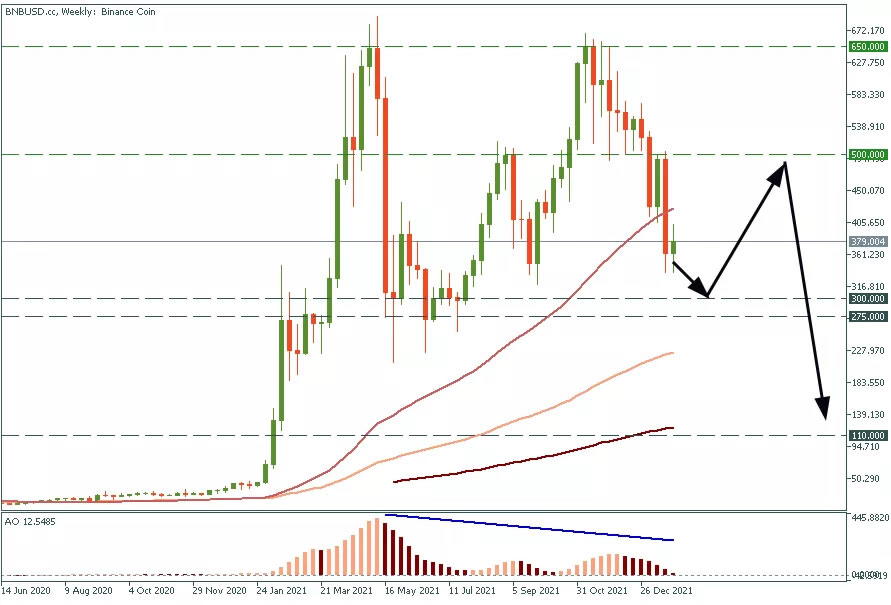
Binance coin can decline to the $275-300 support range. After that, the price might rise as high as $500. As well as Ethereum, BNB/USD might form a head-with-shoulder pattern and drop down to $110 afterward.
Conclusion
The immediate future of the crypto market looks rather gloomy. Fortunately, FBS traders can trade both sides, long and short, and earn the same on bull and bear markets.
Gold Wave Analysis
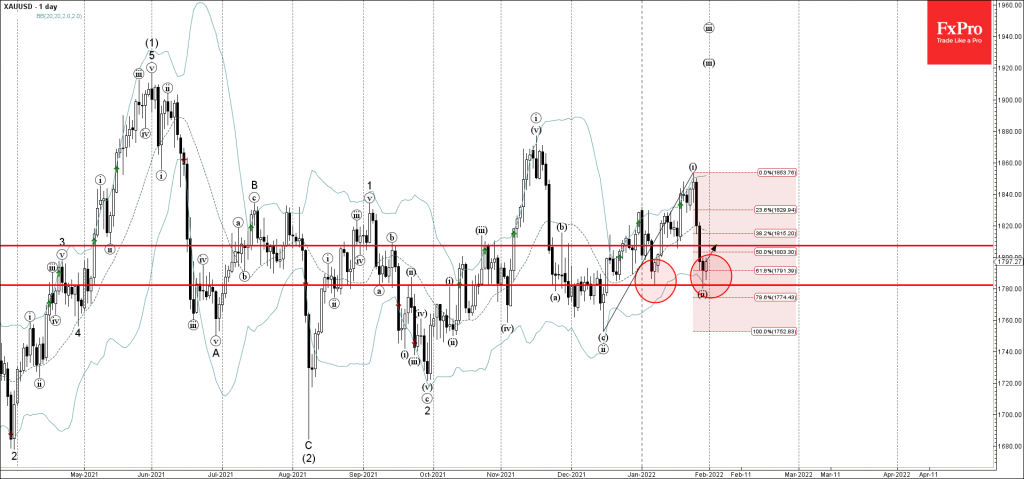
- Gold reversed from support zone
- Likely to rise to resistance level 1810.00
Gold recently reversed up from the support zone lying between the key support level 1780.00 (which reversed the pair at the start of January) and the lower daily Bollinger Band.
The upward reversal from this support zone stopped the earlier minor corrective wave (ii).
Given the strength of the aforementioned support zone – Gold can be expected to rise further toward the next resistance level 1810.00 (former support from the middle of January).
Sunset Market Commentary
Markets
Spanish January inflation numbers and German (regional) data soon sent the same message: European inflation won’t fall back as much as thought at the start of the year. The Spanish setback, related to a sharp rise in the electricity bill in January last year, was compensated for by rising core prices such as food and utilities. Downward tax-related German price pressure was partly offset by soaring energy prices and rising costs of services. Spanish and German national readings (EU harmonized) came in at respectively 6.1% Y/Y (from 6.6% vs 5.5% expected) and 5.1% Y/Y (from 5.7% vs 4.3% expected) and pose significant upside risks to Wednesday’s EMU reading. Consensus currently expects an easing from 5% Y/Y to 4.4% Y/Y. Simultaneously, it makes it harder for the ECB to defend its very accommodative monetary policy stance at Thursday’s policy meeting. We nevertheless only expect a U-turn to the ostrich politics in combination with updated inflation forecasts (i.e. March the earliest). Bond markets side with the view that the ECB will forced to acknowledge the inflation problem sooner than later. Today’s price action is testament to that view. German Bunds underperform US Treasuries and UK Gilts. German yields add 7.7 bps (3-yr) to 5.6 bps (30-yr) in a gentle bear flattening move. The German 2-yr yield moved above -0.55% for the first time since March 2019. Key resistance stands around -0.50% which are the 2018/2019 tops. A move above means the highest German 2y rate since January 2016. The German 10-yr yield returned to positive territory. Important resistance kicks in at 0.15% which is 62% retracement on the 2018/2019 decline. The European 10-y swap rate posts a new recovery high at 0.47% with similar resistance at 0.59% (62% retr.). European money markets keep pulling forward expectations on positive 3-month Euribor rates to currently around March next year. 10-yr yield spreads vs Germany narrow by up to 5 bps for Italy after President Mattarella was re-elected, thereby keeping PM Draghi in charge of the fragile government of national unity and avoiding a snap poll in the key reform year 2022. The US yield curve bear steepens today with yields rising by 1.9 bps (3-yr) to 4.3 bps (30-yr). The euro slightly benefits against the dollar and sterling from today’s front end interest rate support. EUR/USD currently changes hands just below the 1.12 handle, coming from an open near 1.1150. EUR/GBP rises from the low 0.83-zone towards 0.8330. European stock markets started on a strong footing, but gradually returned gains as the sell-off on bond markets intensified. Main indices currently trade near Friday’s closing levels. Losses/gains for main US benchmarks at the start of trading vary between -0.3% (Dow) and +0.9% (Nasdaq). Brent crude extends its steep march since mid-December, to currently trade above $91/barrel. The stalemate in the Russia/Ukraine conflict remains.
News Headlines
The IMF’s financial counsellor and head of the monetary and capital markets department Tobias Adrian warned cryptocurrencies are causing “destabilizing” capital flows in emerging markets. Adrian said it is posing ‘immediate and acute risks” with crypto being used to replace traditional, existing currencies (“cryptoisation”). He also flagged the closer correlation between the performance of cryptos and other financial assets in developed countries. IMF officials believe that significant crypto selloffs are increasingly feeding into stock markets. It urged global regulators start building a consistent supervisory framework.
US 30y mortgage rates trade at their highest since the early days of the pandemic. The average bank rate currently stands at 3.74% vs the all-time low at 2.82% in February 2021. It is also a steep increase from the 3.27% just one month ago. MBS have been underperforming USTs lately, pushing spreads substantially higher too. Mortgage rates are generally rising as the Fed prepares to normalize its policy. One of the steps includes reducing the $2.7tn big mountain of mortgage backed securities, almost double the amount compared to before the pandemic.
USD/JPY Mid-Day Outlook
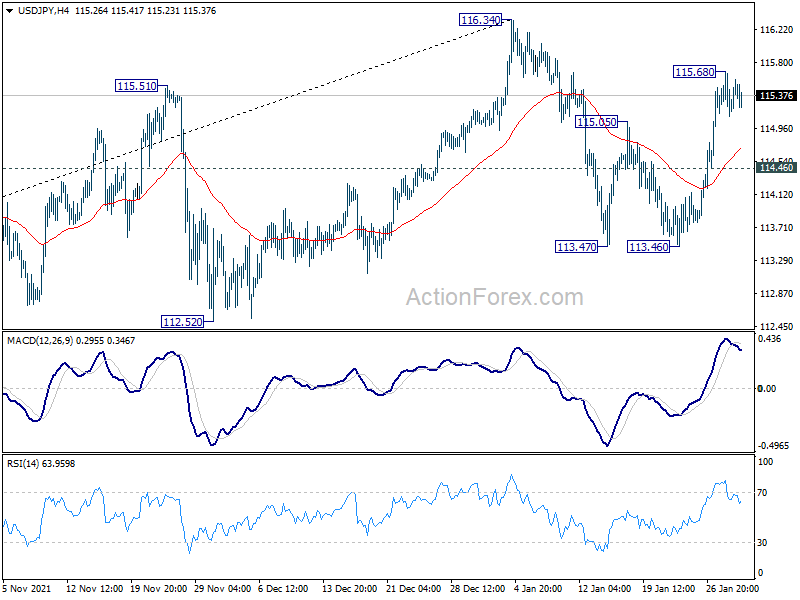
Daily Pivots: (S1) 115.01; (P) 115.35; (R1) 115.58; More...
Intraday bias in USD/JPY is turned neutral with current retreat. But further rise is expected as long as 114.46 minor support holds. Above 115.68 will target 116.34 high first. Decisive break there will resume larger up trend for 118.65 long term resistance next. On the downside, break of 114.46 will turn bias back to the downside for retesting 113.46 support instead.
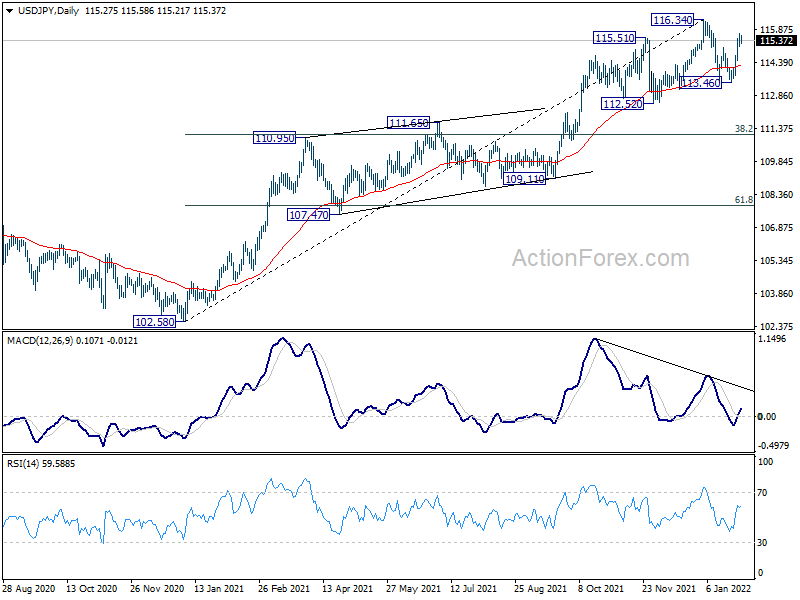
In the bigger picture, no change in the view that rise from 102.58 is the third leg of the up trend from 101.18 (2020 low). Such rally should target a test on 118.65 (2016 high). Sustained break there will pave the way to 120.85 (2015 high) and raise the chance of long term up trend resumption. This will remain the favored case as long as 55 week EMA (now at 111.07) holds.
USD/CHF Mid-Day Outlook
Daily Pivots: (S1) 0.9291; (P) 0.9310; (R1) 0.9331; More....
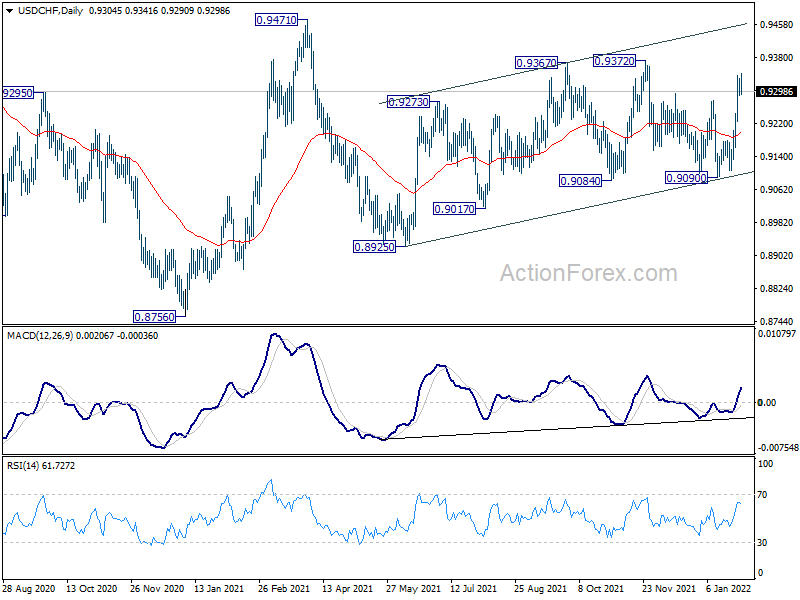
Intraday bias in USD/CHF is turned neutral with current retreat. Overall, with 0.9090 support intact, choppy rise from 0.8925 should extend higher. On the upside, above 0.9341 will target 0.9372 and then 0.9471. However, break of 0.9342 minor support will turn bias back to the downside for 0.9090 support.
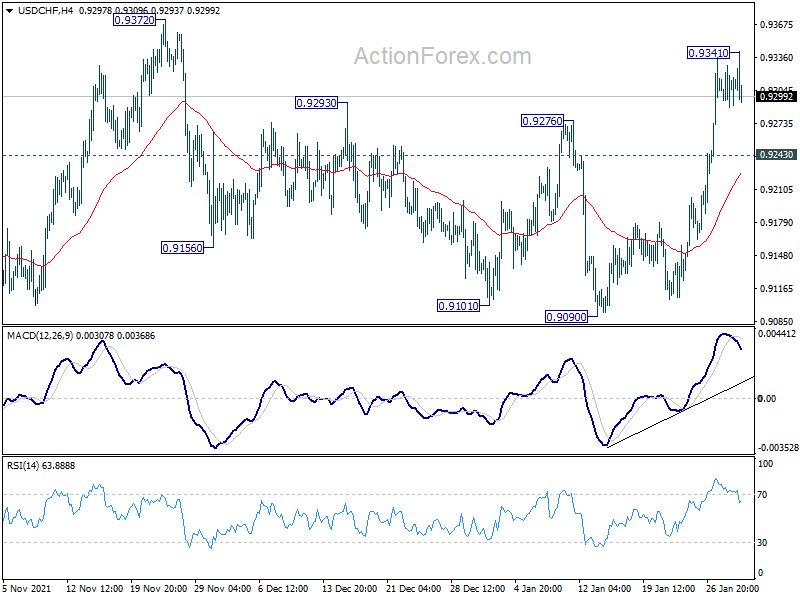
In the bigger picture, medium term outlook will be neutral at best as long as 0.9471 resistance holds. Larger down trend could still extend through 0.8756 (2021 low). However, firm break of 0.9471 will argue that the trend has already reversed and rebound the rally from 0.8756 with another impulsive move.