

Sample Category Title
EUR/GBP Daily Outlook
Daily Pivots: (S1) 0.8320; (P) 0.8340; (R1) 0.8374; More...
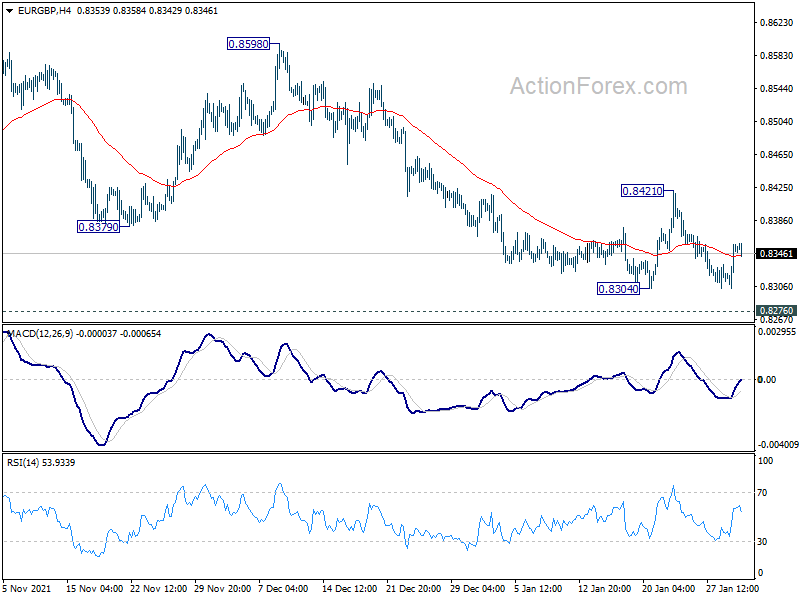
Intraday bias in EUR/GBP is turned neutral as it recovered after touching 0.8304 support. Near term outlook stays bearish as long as 0.8421 resistance holds. Break of 0.8304 will resume larger down trend towards 0.8276 key long term support. However, break of 0.8421 resistance will be a sign of bullish reversal. Further rise would be seen back to 0.8598 structural resistance next.
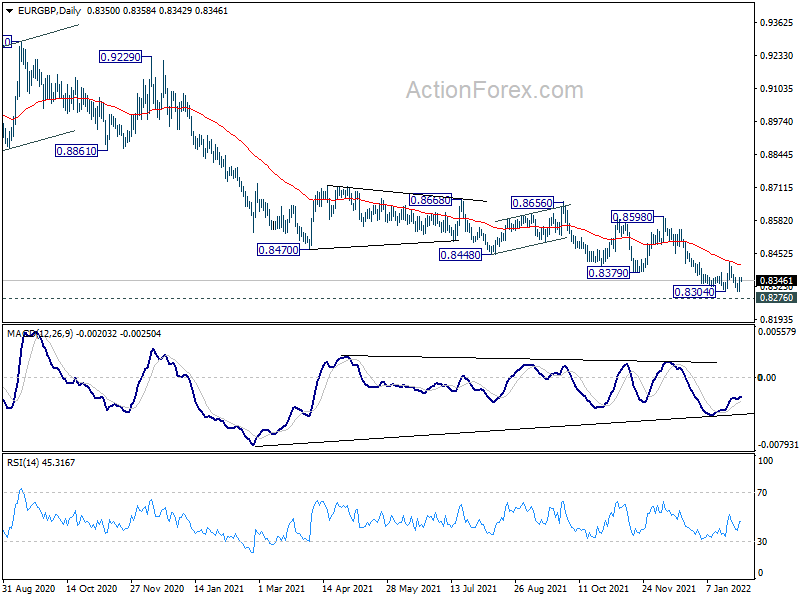
In the bigger picture, price actions from 0.9499 (2020 high) are still seen as developing into a corrective pattern. Deeper fall could be seen as long as 0.8598 resistance holds, towards long term support at 0.8276. We'd look for bottoming signal around there to bring reversal. Meanwhile, firm break of 0.8598 will now be an early sign of medium term bottoming and bring stronger rebound. However, sustained break of 0.8276 will argue that the long term trend has reversed.
EUR/AUD Daily Outlook
Daily Pivots: (S1) 1.5822; (P) 1.5887; (R1) 1.5960; More...
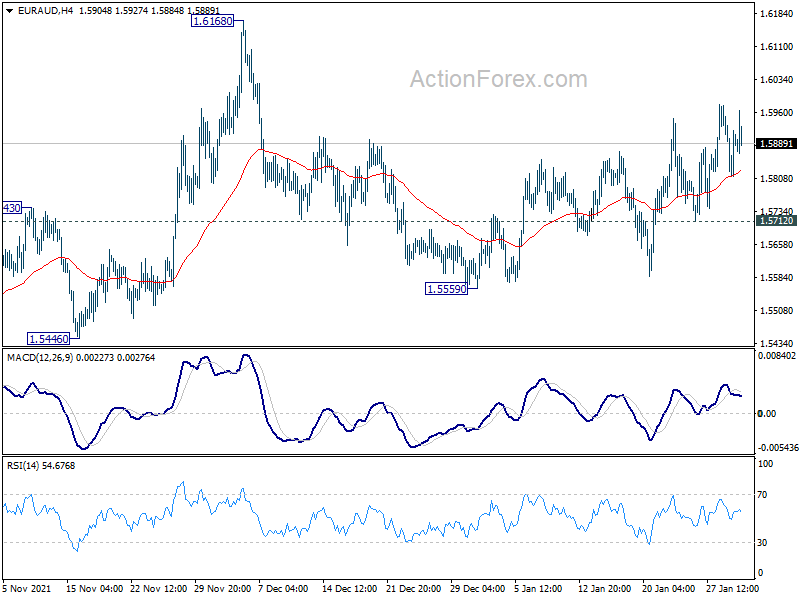
EUR/AUD is losing upside momentum as seen in 4 hour MACD. But further rise is mildly in favor with 1.5712 support intact. Rebound from 1.5559 would target 1.6168 resistance next. However, on the downside, break of 1.5712 support will turn bias back to the downside for 1.5559 support instead.
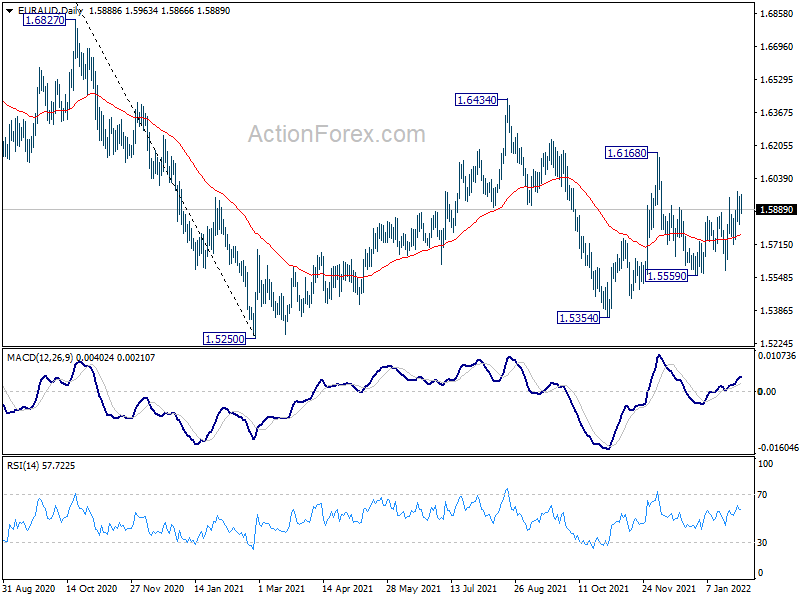
In the bigger picture, rise from 1.5354 is seen as the third leg of the corrective pattern from 1.5250 low. Further rise cannot be ruled out, but even in that case, strong resistance should be seen at 38.2% retracement of 1.9799 to 1.5250 at 1.6988. Larger down trend from 1.9799 is in favor to extend through 1.5250 at a later stage.
EUR/CHF Daily Outlook
Daily Pivots: (S1) 1.0370; (P) 1.0405; (R1) 1.0448; More....
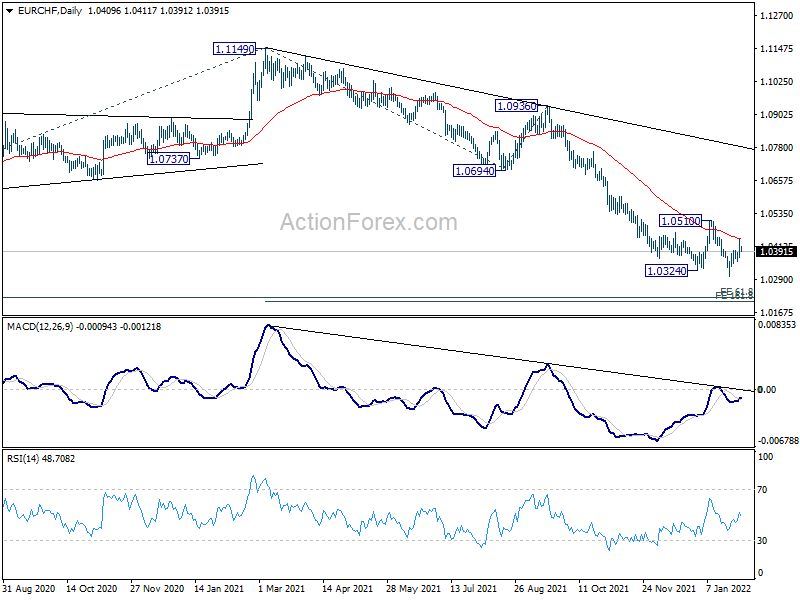
EUR/CHF is staying in the corrective pattern from 1.0298 and outlook is unchanged. Intraday bias remains neutral at this point. Upside should be limited well below 1.0510 resistance. On the downside, break of 1.0298 will extend the down trend from 1.1149 to 161.8% projection of 1.1149 to 1.0694 from 1.0936 at 1.0200 next.
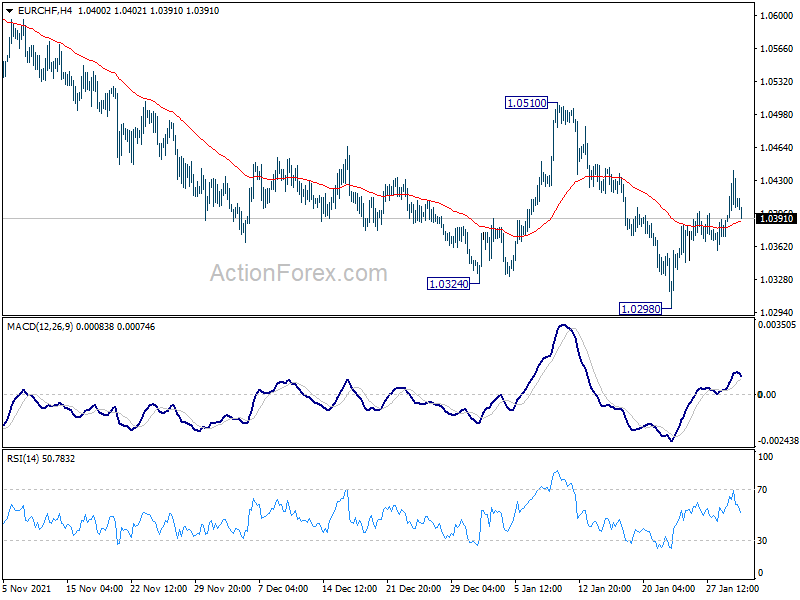
In the bigger picture, long term down trend from 1.2004 (2018 high) is still in progress. Next target is 61.8% projection of 1.2004 to 1.0505 to 1.1149 at 1.0223. On the upside, firm break of 1.0505 support turned resistance is needed to be the first sign of medium term bottoming. Otherwise, outlook will remain bearish even in case of rebound.
Can We Call the End of the Selloff?
The S&P500 finished January with a strong two-day rally, but the index is still more than 5% lower than where it kicked off the year, having recorded its worst month since March 2020. Nasdaq closed yesterday’s session up by more than 3% for the second day in a row.
A part of the rally is explained by dip-buying from those who believe that the stocks hit a bottom as a result of an aggressive hawkish Fed pricing across the market and a part of it is explained by some short covering, which got traders to buy back the shares that they initially bet against to close their positions.
Nasdaq is already up by almost 9% from the January dip. Yet, 3-4% gains are often sign of high volatility and stress, and they could easily melt down in no time. What we need to see now is smaller but more sustainable gains to call the end of the January selloff.
Good news is that some Federal Reserve (Fed) officials are finally out trying to sooth investors’ nerves saying that they still want to avoid unnecessarily disrupting the US economy. The softish remarks help easing the worry of seeing a 50bp hike in FOMC’s March meeting. But does it really matter? The rates and the yields are so low that the difference between a 25 and 50 basis-point hike is only in the head of investors. What will really make the difference is the Quantitative Tightening and given the steep rise in Fed’s balance sheet since March 2020, even halting the growth would be an abrupt change for the market conditions.
US index futures traded slightly in the negative in Asia, while the European indices gained with the Eurostoxx futures adding up to 1% in the overnight trading session.
The DAX index successfully held ground above the 15000 mark in January despite the data showing a slowing German recovery and the rising inflation. The European stocks are set to outperform their American peers with the European Central Bank (ECB) doves nowhere to be found.
The EURUSD is back above the 1.12 mark, and the move is mostly driven by a broadly stronger US dollar than a more bullish pricing on the euro.
Elsewhere, the Reserve Bank of Australia (RBA) maintained its rates unchanged at today’s meeting but decided to stop its A$ 275 billion bond buying program while insisting that the decision doesn’t imply an imminent rate hike. Interestingly, the Australian dollar used to be a high-yield currency, and now it’s about to find itself yielding less than the US dollar. This means that a move below the 70 cents mark in AUDUSD wouldn’t be necessarily short-lived even with the recovery in iron ore prices which is fundamentally positive for the Aussie.
EUR/USD Daily Outlook
Daily Pivots: (S1) 1.1165; (P) 1.1207; (R1) 1.1274; More...
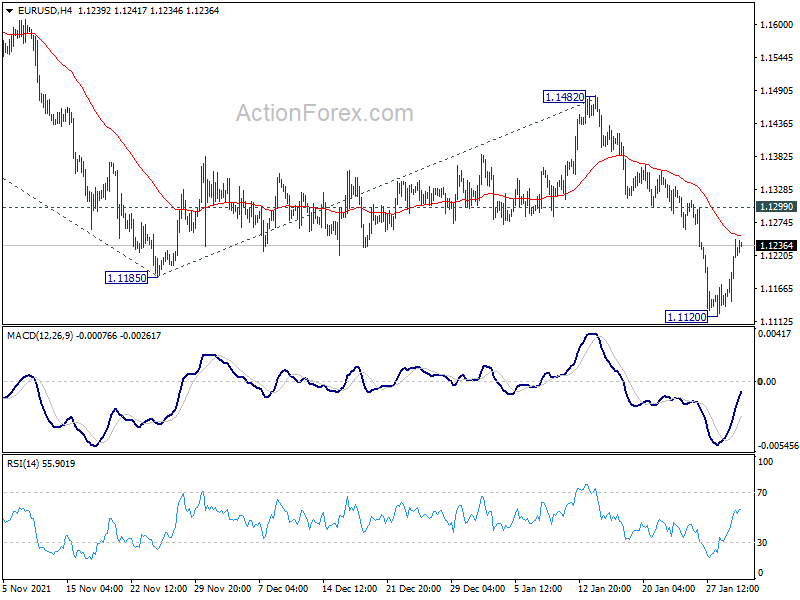
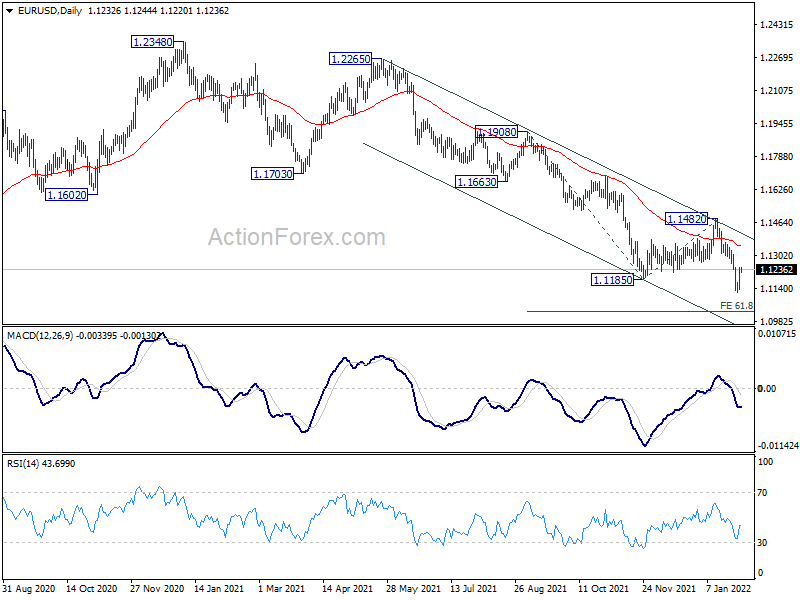
Intraday bias in EUR/USD remains neutral for consolidation above 1.1120 temporary low. Further fall is expected as long as 1.1299 minor resistance holds. On the downside, break of 1.1120 will resume larger down trend to 61.8% projection of 1.1908 to 1.1185 from 1.1482 at 1.1035. Break will target 100% projection at 1.0759. However, break of 1.1299 minor resistance will bring stronger rebound back towards 1.1482 structural resistance.
In the bigger picture, the strength of the the decline from 1.2348 (2021 high) suggests that it's not a corrective move. But still, it could be the fourth leg of a sideway pattern from 1.0339 (2017 low), or resuming long term down trend. In any case, outlook will now stay bearish as long as 1.1482 resistance holds. Next target would be 1.0635 low.
GBP/USD Daily Outlook
Daily Pivots: (S1) 1.3400; (P) 1.3431; (R1) 1.3475; More...
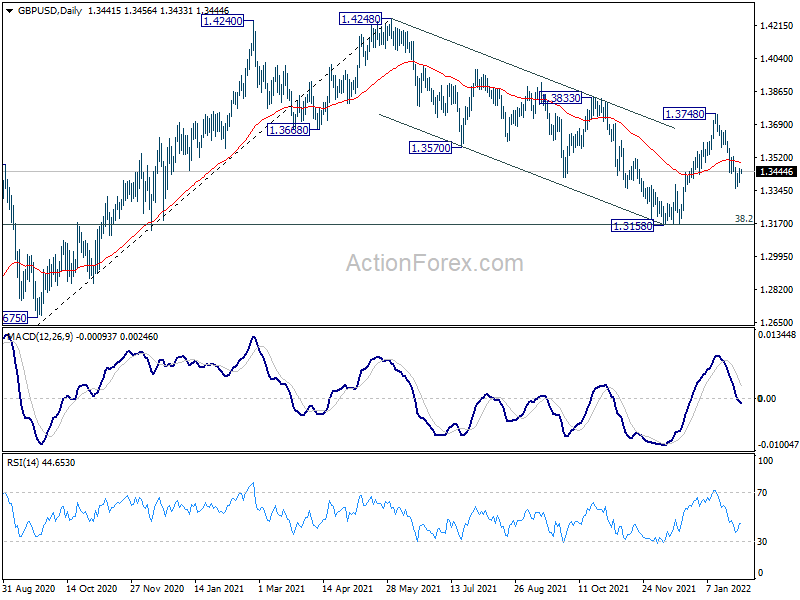
Intraday bias in GBP/USD remains neutral for consolidation above 1.3356 temporary low. Further decline is expected with 1.3523 minor resistance intact. As noted before, rebound from 1.3158 has completed at 1.3748 already, and down trend from 1.4248 is not over yet. Break of 1.3356 will resume the fall from 1.3748 to retest 1.3158 low. On the upside, though, above 1.3523 minor resistance will turn bias back to the upside for retesting 1.3748.
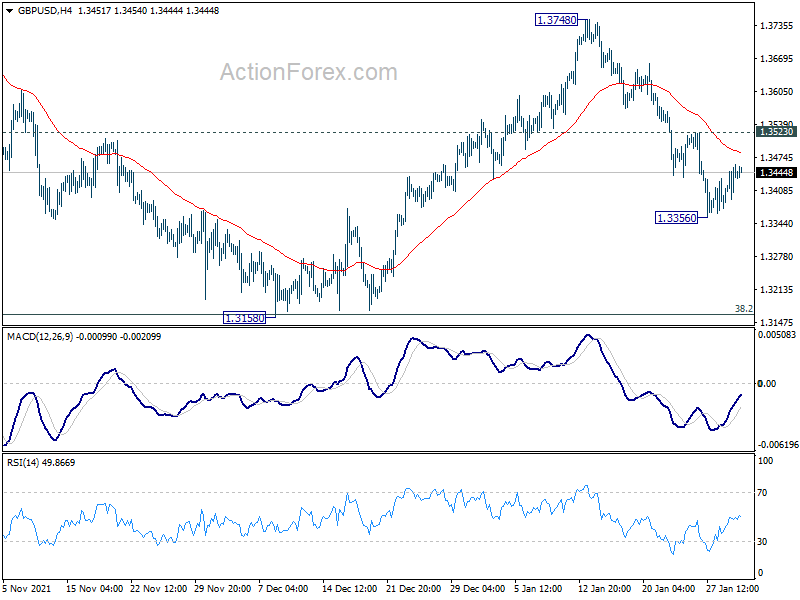
In the bigger picture, as long as 38.2% retracement of 1.1409 to 1.4248 at 1.3164 holds, up trend from 1.1409 (2020 low) is still in progress. On resumption, next target will be 38.2% retracement of 2.1161 to 1.1409 at 1.5134. Nevertheless sustained break of 1.3164 will argue that whole rise from 1.1409 has completed and bring deeper fall to 61.8% retracement at 1.2493.
USD/CHF Daily Outlook
Daily Pivots: (S1) 0.9233; (P) 0.9288; (R1) 0.9324; More....
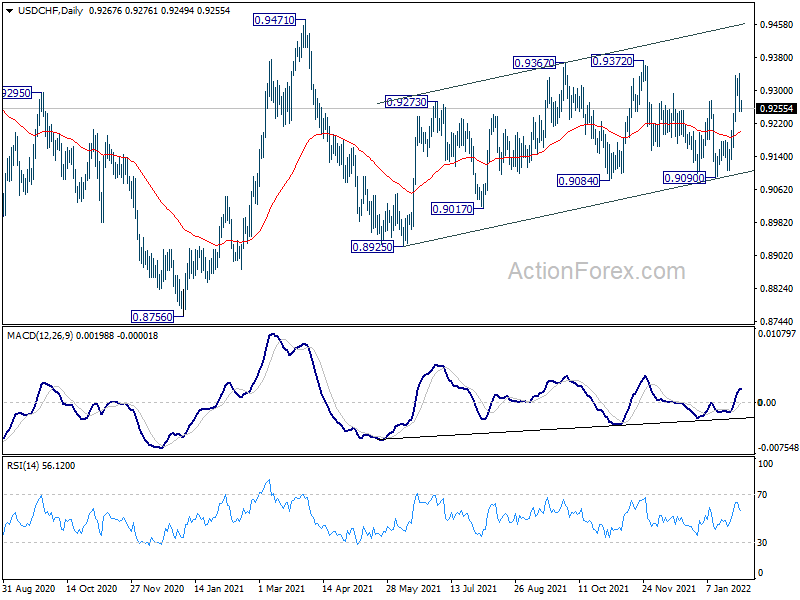
Intraday bias in USD/CHF remains neutral for the moment. Overall, with 0.9090 support intact, choppy rise from 0.8925 should extend higher. On the upside, above 0.9341 will target 0.9372 and then 0.9471. However, break of 0.9342 minor support will turn bias back to the downside for 0.9090 support.
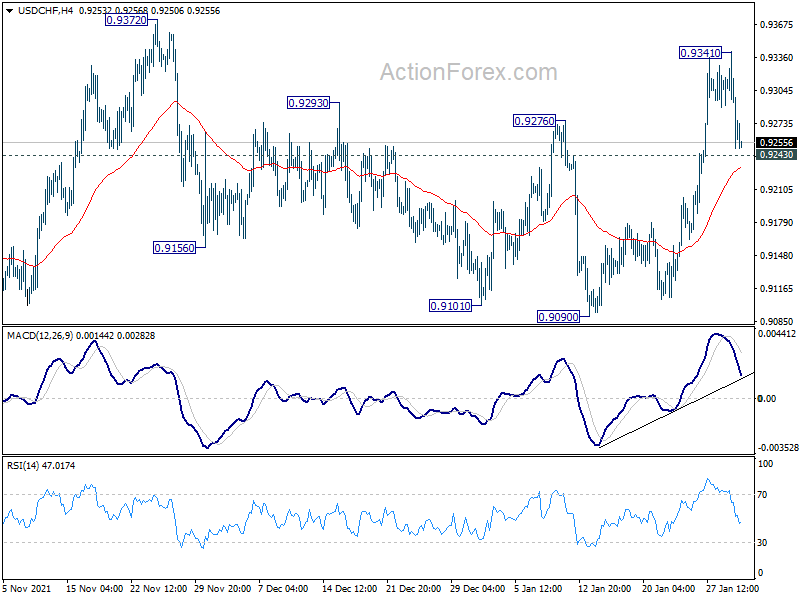
In the bigger picture, medium term outlook will be neutral at best as long as 0.9471 resistance holds. Larger down trend could still extend through 0.8756 (2021 low). However, firm break of 0.9471 will argue that the trend has already reversed and rebound the rally from 0.8756 with another impulsive move.
USD/JPY Daily Outlook
Daily Pivots: (S1) 114.84; (P) 115.21; (R1) 115.50; More...
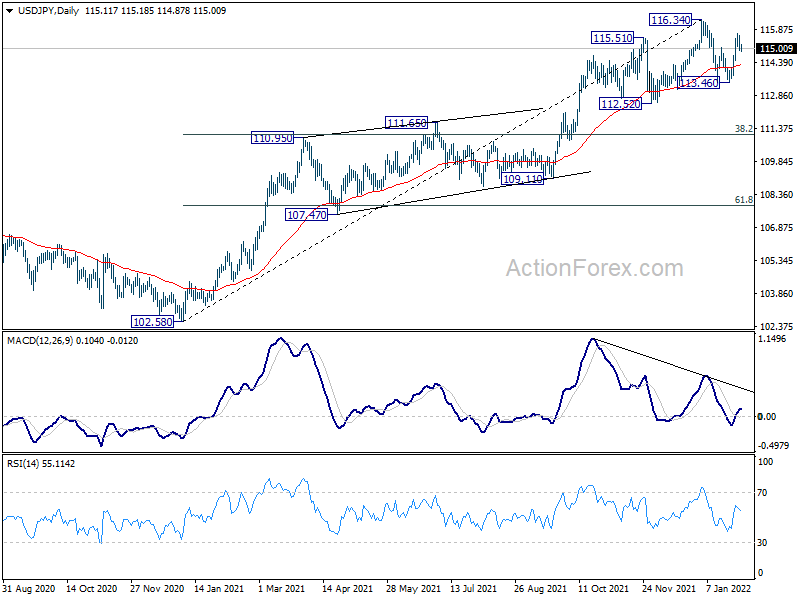
Intraday bias in USD/JPY remains neutral for consolidation below 115.68 temporary top. Further rally is expected with 114.46 minor support intact. On the upside, break of 115.68 will target 116.34 high first. Decisive break there will resume larger up trend for 118.65 long term resistance next. On the downside, break of 114.46 will turn bias back to the downside for retesting 113.46 support instead.
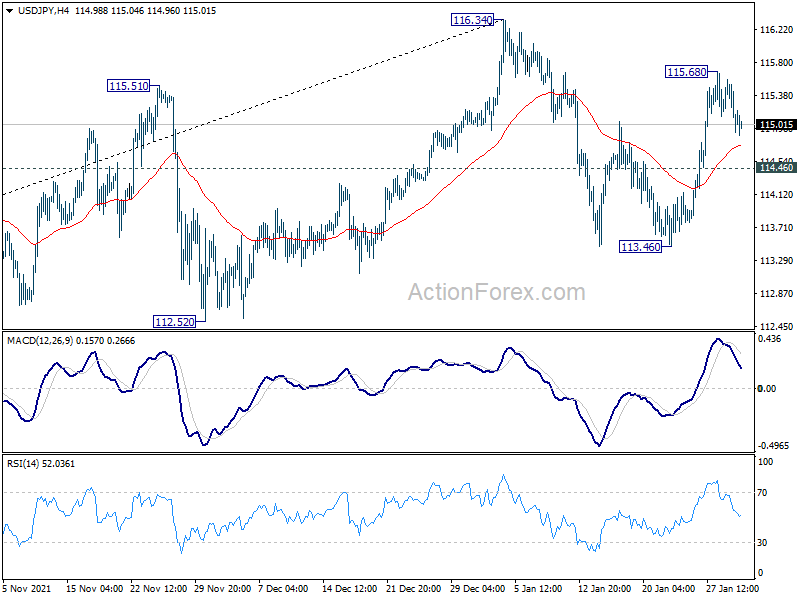
In the bigger picture, no change in the view that rise from 102.58 is the third leg of the up trend from 101.18 (2020 low). Such rally should target a test on 118.65 (2016 high). Sustained break there will pave the way to 120.85 (2015 high) and raise the chance of long term up trend resumption. This will remain the favored case as long as 55 week EMA (now at 111.07) holds.
USD/CAD Daily Outlook
Daily Pivots: (S1) 1.2661; (P) 1.2726; (R1) 1.2769; More...
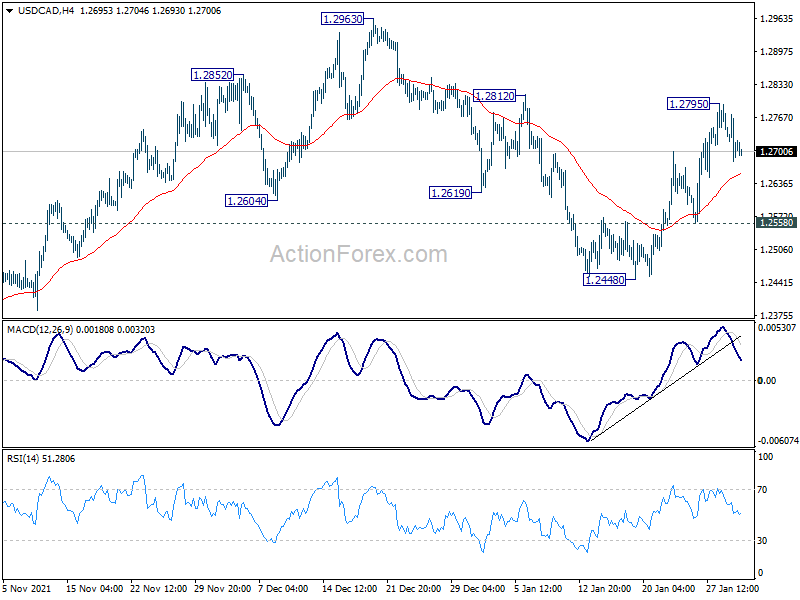
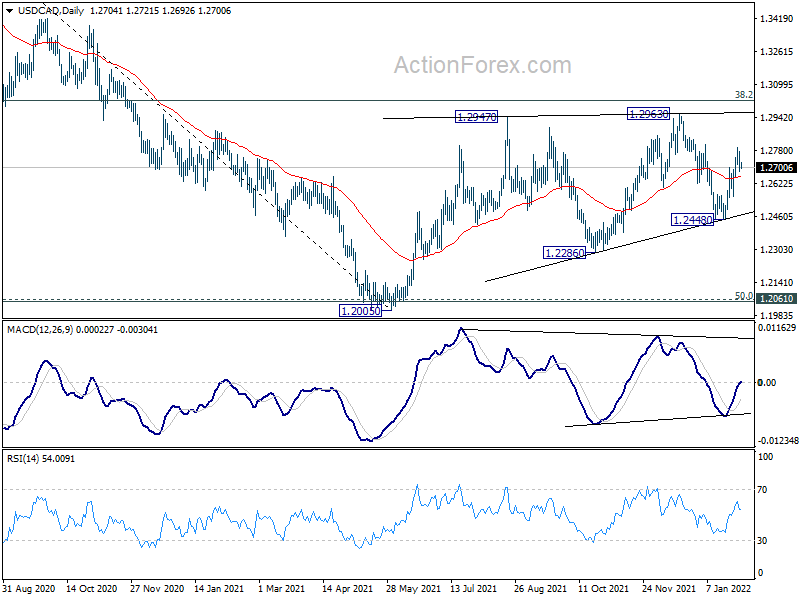
Intraday bias in USD/CAD remains neutral for consolidation below 1.2795 temporary top. Further rise is expected with 1.2558 support intact. On the upside, break of 1.2795 will target 1.2812 and then 1.2963 resistance. However, break of 1.2558 minor support will turn bias back to the downside for 1.2448 instead.
In the bigger picture, focus stays on 38.2% retracement of 1.4667 (2020 high) to 1.2005 (2021 low) at 1.3022. Sustained break there should confirm that the down trend from 1.4667 has completed after defending 1.2061 long term cluster support. Further rise would then be seen towards 61.8% retracement at 1.3650. However, rejection by 1.3022 will maintain medium term bearishness. Break of 1.2005 will resume the down trend from 1.4667 and that carries larger bearish implications too.
RBA Board Ceases Bond Purchases – Lifts Inflation Forecast
The Board has ceased the bond purchase program and significantly lifted its inflation forecasts but the Governor maintains the line that the sustainability of its inflation forecasts can only be achieved with much clearer evidence around wages growth. This is likely to preclude an “early” rate hike but does not dissuade us from our August call.
As expected, the Reserve Bank Governor announced that the Board has decided to cease further purchases under the bond purchase program.
The Board has decided to consider the issue of the reinvestment of the proceeds of future bond maturities at its meeting in May. Readers will be aware that the purchase program was initiated in November 2020 with maturities around the 5 to 10 year spectrum. Consequently, it will be some time before decisions will need to be made about the original bond purchase program.
On the other hand, the Governor did announce the Yield Curve Control Policy on March 19 2020 where 3 year government bonds (April 2023 maturity) were targeted – decisions on those bond maturities will be needed in early 2023.
We are always interested in the Bank’s revised forecasts and this Statement usually includes a number of key observations prior to the full list of forecasts being released on February 4.
The Bank has reduced its forecast for GDP growth in 2022 from 5.5% to 4.25% and from 2.5% to 2% in 2023.
The main source of the reduction in 2022 is likely to be the early evidence that consumer spending contracted in January due to the impact of the Omicron virus on consumers – Westpac has reduced its forecast for GDP growth in the March quarter to zero from 2.2% to reflect exactly that factor and has shaved around 1 ppt from its growth forecast for 2022.
It is also pertinent to recall that the Bank’s forecasts are based on market pricing for the cash rate. With the market forecasting a cash rate of around 2% by end 2023 (higher than in November) it is not surprising to see a growth downgrade in both 2022 and 2023.
The forecast for underlying inflation has been lifted significantly. The expected peak in coming quarters has been lifted from 2.25% (in November) to 3.25% while the forecast is that it will drift back to 2.75% by end 2023 compared to 2.5% in November.
Despite higher rates and lower growth, the forecasts for the labour market have been boosted. The unemployment rate is forecast to fall to “below 4% later in the year” reaching 3.75% at the end of 2023. That compares with 4.25% and 4% respectively in November ‘s forecasts.
The Governor’s rhetoric does not seem to be consistent with the forecasts.
He states, “While inflation has picked up, it is too early to conclude that it is sustainably within the target band.” And yet underlying inflation is currently 2.6%; is forecast by the RBA to increase to 3.25% in 2022 and still be at 2.75% by the end of 2023.”
That is inflation is forecast to hold in the upper half of the target band for at least two years!
These tactics are clearly to dissuade markets from getting too far ahead of themselves in anticipating higher rates.
Note that the has not put a date on the timing of the first move since the October meeting last year when he referred to “this condition will not be met before 2024.”
However, in speeches he maintained the “not in 2022” line as recently as December 16. The most important part of his speech tomorrow to the National Press Club will be whether he retains that” not in 2022” guidance – I would be very surprised if he chooses to do that!
The Governor gives two arguments against the sustainability of the recent inflation increase – “uncertainties about the outlook for supply side problems” and “it is likely to be some time yet before aggregate wages growth is at a rate consistent with inflation being sustainably at target.”
The choice of “aggregate” wages growth would appear to emphasise the Wage Price Index. Recall that its last three quarterly prints have been 0.6%; 0.4%; and 0.6%. The next print will be on February 23 to be followed by May 18.
To get any where near the 3% target at the next release the Index would need to print an unlikely 1.4% - that incredibly high hurdle, coupled with the Governor’s statement today should knock out any expectation of a May rate hike.
Westpac expects that the next two WPI’s will show “aggregate” wages growing at around 2.5% with a 3% 6 month annualised pace – enough, along with the sustained lift in underlying inflation, and 13 year low in the underemployment rate, to justify the August move.
Conclusion
We remain comfortable with our August call for the first move.
Predictably, the Governor has attributed the wages story as the key for the RBA concluding that their revised forecasts (which are consistent with higher rates) are still uncertain and more evidence is required before it can act.