Sample Category Title
Cliff Notes: Labour Market to Determine Pace of Policy Adjustment
Key insights from the week that was.
In Australia, the RBA Monetary Policy Board (MPB) unanimously decided to cut the cash rate by 25bps, a move that came as no surprise to market participants. This week’s decision chalks up a cumulative 75bps of rate cuts since February, highlighting the MPB’s intent to gradually reduce policy restrictiveness as underlying inflation settles sustainably at the mid-point of the target range. The MPB continued to emphasise a “heightened level of uncertainty”, meaning incoming data will remain critical to the pace at which policy is eased towards neutral.
In a video update midweek, Chief Economist Luci Ellis discussed the August decision and the RBA’s updated forecasts. Outside of the downgrade to the RBA’s productivity assumption – which fed into a lower growth profile without any consequences for inflation – key forecasts were broadly unchanged. Underlying inflation is expected to remain flat at 2.6%yr for the next two years before dropping to 2.5%yr in Dec-27 while the unemployment rate holds at 4.3%. These forecasts are predicated on a cash rate path similar to our own, so we remain comfortable calling for a further 75bps of easing to 2.85% on a quarterly pace to May 2026.
With inflation now largely under control, labour market developments are poised to receive a larger weight in the RBA’s reaction function. This week’s labour force data confirmed a gradual softening trend is re-emerging, with July’s around-average employment gain of +24.5k barely able to offset two months of essentially zero net job creation. The unemployment rate has also started to lift above the 4% mark. The fact that its recent rise has been driven by an increase in youth unemployment – a labour market cohort more sensitive to changes in the business cycle – signals a broader lift in total unemployment is likely in coming months.
The shifting balance of risks was also evident in the Q2 Wage Price Index. The 0.8% (3.4%yr) gain was in line with consensus and the RBA’s forecasts and suggests the labour market is no longer a source of material upside risk for inflation. The softening trend in employment was also evident in the NAB business survey despite an improvement in conditions (up to +5 in July). Private businesses are likely to limit their appetite for additional labour until a sustainable and broad-based uptrend in growth becomes evident.
Offshore, the major event was President Trump’s decision to extend the 90-day tariff truce between the US and China for another term. This follows the sharp escalation post-Liberation Day, where US tariffs surged to 145% before being scaled back to 30% under the initial truce, which China responded to with a tariff reduction to 10%. Talks continue toward a lasting agreement, with rare earth minerals and China’s access to technology the focus.
Comments from FOMC officials continued to focus on inflation risks and the latest price data provided justification. Headline consumer prices rose 0.2% in July, consistent with the average pace over the first half and expectations for this release. However, underlying pressures firmed, the core CPI lifting 0.3% in the month – the strongest monthly gain since January. Within the detail, services inflation accelerated to 0.4%mth, led by a sharp 4.0%mth rise in airline fares, alongside firmer prints for recreational, education, and medical services. Core goods inflation was contained at 0.2%, but the pickup in the 6-month annualised pace from 0% in December 2024 to an average of 1.2% in June/July makes clear tariff costs are slowly being passed through. Overnight the producer price detail also highlighted a combination of capacity constraints and tariff passthrough, core goods prices up 0.4% and services 1.1%.
China’s consumer inflation pulse is, in contrast, non-existent, the annual CPI unchanged over the year as producer prices fell 3.6%. Excess industrial capacity and soft consumer demand are the cause of this price weakness and, until supply tightens meaningfully, this trend is likely to remain entrenched. Authorities in China continue to provide incremental support to the consumer, this week through a subsidised consumer credit scheme which has capacity to support a broad array of purchases. But, as made clear by the credit and deposit trends, consumers remain extremely cautious on their finances and are therefore reticent to ramp up discretionary purchases. If confidence in the outlook amongst households does not strengthen, our 4.6% forecast for GDP growth in 2026 is likely to face downside risks. Further detail on our expectations for China can be found in Westpac Economics’ August Market Outlook, due for release later today on Westpac IQ.
Finally, data for the UK this week was constructive. UK GDP beat expectations, gaining 0.3% in Q2 after a strong 0.7% result in Q1. Though the Q2 result was principally due to support from public demand, with household consumption up just 0.1% and investment down 1.1%. The latest labour market data also showed tentative signs of improvement. The unemployment rate held at 4.7% in June, unchanged from the prior month, as employment growth accelerated to a nine-month high of +238k. Together these outcomes suggest a robust flow of new entrants into the labour force in response to robust labour demand. In such circumstances, wage growth is likely to maintain a robust pace, rising 4.8%yr over the three-months to June compared to 4.9%yr in May.
China’s growth momentum fades as July data misses forecasts
China’s July economic activity slowed more than expected, with industrial production rising 5.7% yoy, short of the 6.0% yoy forecast and easing from June’s 6.8% yoy. Retail sales growth also disappointed, up 3.7% yoy versus the 4.6% yoy expected, marking a slowdown from 4.8% yoy in the prior month.
From January to July, fixed asset investment grew just 1.6% yoy, well below the 2.7% yoy forecast and down from 2.8% previously yoy, marking the weakest pace since September 2000. The persistent downturn in the property sector remains a major drag, with property investment contracting -12% yoy over the first seven months.
Japan’s GDP extends growth streak to fifth quarter on strong investment and exports
Japan’s economy expanded 0.3% qoq in Q2, topping expectations of 0.1% qoq. Q1 figures were also revised up to 0.1% qoq growth from a prior estimate of contraction. On an annualized basis, GDP rose 1.0% , marking a fifth consecutive quarter of expansion—a sign of steady, if moderate, momentum.
Capital investment increased 1.3% qoq, extending its growth streak to five quarters, reflecting resilient corporate spending. Exports also provided a boost with a 2.0% rise, outpacing the 0.6% gain in imports, which act as a drag on GDP. The combination of solid external demand and firm investment highlights a balanced growth profile.
Private consumption, which accounts for more than half of Japan’s economic activity, inched up 0.2% qoq. The soft household spending highlights the need for wage growth and consumer confidence to strengthen if Japan is to build on its investment-led momentum and secure a more balanced recovery.
NZ BNZ PMI back in growth zone as new orders surge
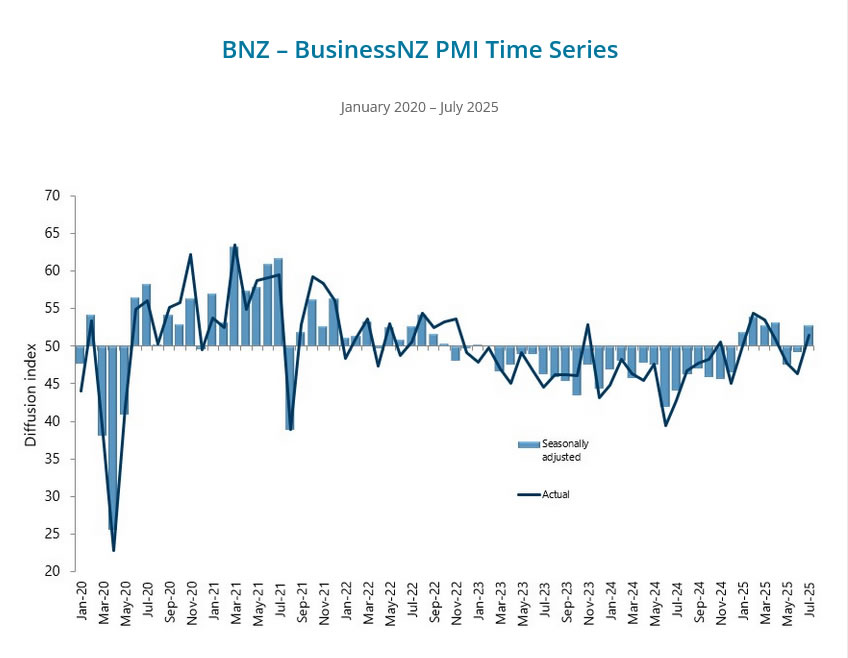
New Zealand’s manufacturing sector returned to growth in July, with the BusinessNZ Performance of Manufacturing Index rising from 49.2 to 52.8, moving back above the historical average of 52.5.
All five sub-indices registered expansion, led by New Orders at 54.2—its highest since March 2022—and Production at 53.6, the strongest since August 2022. Finished Stocks and Deliveries of Raw Materials also posted modest growth, while Employment (50.1) edged back above the no-change level after two months of contraction.
Despite this encouraging turnaround, sentiment among manufacturers remains guarded. The share of negative comments fell to 58.6% from June’s 65.5%.
Respondents continued to highlight weak demand, rising costs, and ongoing economic uncertainty. Tariffs, subdued construction activity, and soft consumer spending were cited as key headwinds, with many firms noting delayed projects and a tendency for customers to place only essential orders.
USD/JPY Fight for Momentum: Can Bulls Break Through?
Key Highlights
- USD/JPY extended losses and tested the 146.20 support.
- It now faces hurdles near 147.80 and 148.50 on the 4-hour chart.
- EUR/USD struggled to continue higher above the 1.1740 pivot zone.
- GBP/USD revisited the key resistance at 1.3590.
USD/JPY Technical Analysis
The US Dollar started a fresh decline from 148.50 against the Japanese Yen. USD/JPY traded below a key bullish trend line and 146.80.
Looking at the 4-hour chart, the pair tested the 146.20 zone and recently started a recovery wave. There was a move above the 146.50 and 146.70 levels. The pair climbed above the 38.2% Fib retracement level of the downward move from the 148.51 swing high to the 146.21 low.
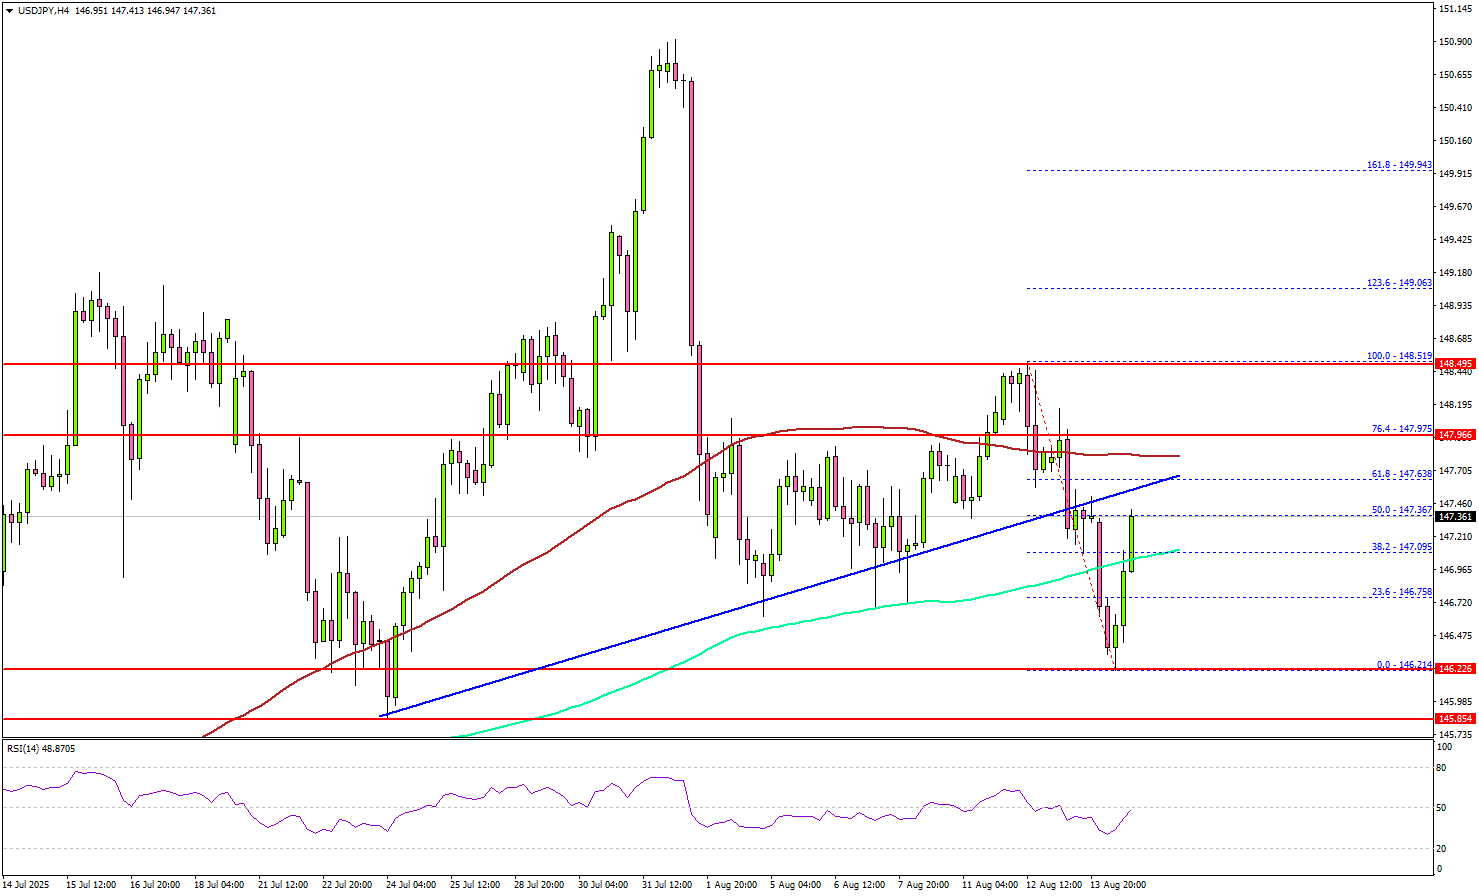
On the upside, the pair now faces resistance near the 100 simple moving average (red, 4-hour) at 147.80. The next key resistance sits near 148.00. A close above 148.00 could set the pace for another increase.
In the stated case, the pair could rise toward 148.50, above which the bulls could aim for a move toward 148.80. If the pair fails near 147.80, there could be another decline.
On the downside, immediate support is 146.50. The next key support sits at 146.20. Any more losses could send the pair toward the 145.50 support zone.
Looking at EUR/USD, the pair started a recovery wave above 1.1650, but the bears were active above the 1.1720 level.
Upcoming Key Economic Events:
- US Retail Sales for July 2025 (MoM) – Forecast +0.5%, versus +0.6% previous.
- Michigan Consumer Sentiment Index for Aug 2025 (Prelim) – Forecast 62.0, versus 61.7 previous.
Fed’s Musalem: 50bps cut unsupported by current conditions
St. Louis Fed President Alberto Musalem said on CNBC that his outlook has shifted in recent months, with inflation risks revised "slightly lower" and potential labor market weakness assessed "slightly higher".
Musalem stressed that his views remain fluid and will continue to evolve ahead of the September FOMC meeting. He avoided committing to a September rate cut but was clear that a 50bps move is “unsupported” by current conditions.
On tariffs, Musalem said any inflationary impact is likely to fade within two or three quarters.
Separately, Richmond Fed President Thomas Barkin said the Fed is still weighing whether high unemployment or sustained inflation poses the greater risk to its dual mandate.
"High unemployment is, in fact, disinflationary. Or is inflation high enough or sustained enough that it's going to put inflation expectations at risk? And I think that's the trade-off you're trying to manage," Barkin said.
Imminent Profit-Taking in Cryptocurrencies – What’s the Story
Cryptocurrencies are volatile investment assets, in case people forget.
After multiple weeks of sensational rallying, particularly in altcoins, Cryptocurrencies have started to find some profit-taking from their renewed highs.
Bitcoin originally led the way higher, marking its own ATH towards the last days of July (initially around $123,200). Hence, a $10,000 consolidation range followed, creating perfect conditions for altcoins to catch up—and Ethereum did not lose the opportunity, rising up to 33% in 12 days.
Multiple headwinds had caused Cryptos to surge higher: between the US opening investment and regulations for institutions and the masses to invest much more freely in digital assets, the 2025 USD fall prompting diversification (especially if you add the increasing global government deficits), and a huge appetite for risk assets amid the AI/Tech boom, there was a lot to digest for people not exposed to cryptos.
But this morning, some bad news knocked at the door of investors: Tariff-led inflation is starting to appear in the data.
This morning's PPI report has scared markets, but equities are holding decently well compared to cryptos.
For those who have not seen the preceding cycles, cryptocurrencies, being volatile and one of the most recent asset classes, tend to be sold off in advance, particularly as market levels and positioning reach some extreme form.
It doesn't mean that the Bull market is over yet, but there are some signs of hesitancy from Market participants.
Expect volatility to rise. and stay high.
Let's take a look at the Daily picture for the Crypto market and then a few intra-day charts for some major cryptos with the ongoing selloff.
A daily overlook on the Crypto Market
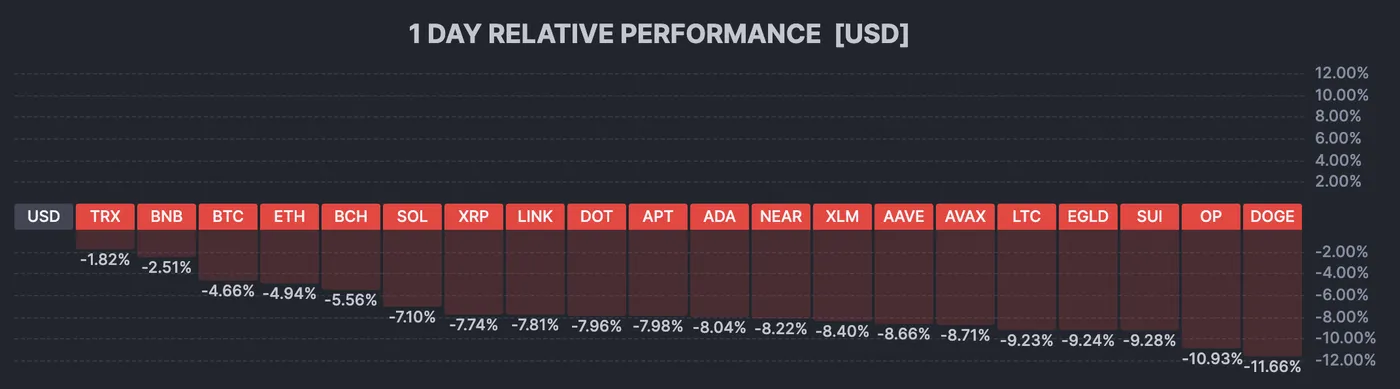
Crypto Daily Performance, August 14, 2025 – Source: Finviz
The picture is bloody – watch your risk. Cryptos have seen bigger moves than this in the past, up or down.
The move is still decently high in terms of % change, prompting some consolidation.
A few Cryptocurrencies intraday charts including BTC, ETH, XRP and SOL
Bitcoin 8H Chart
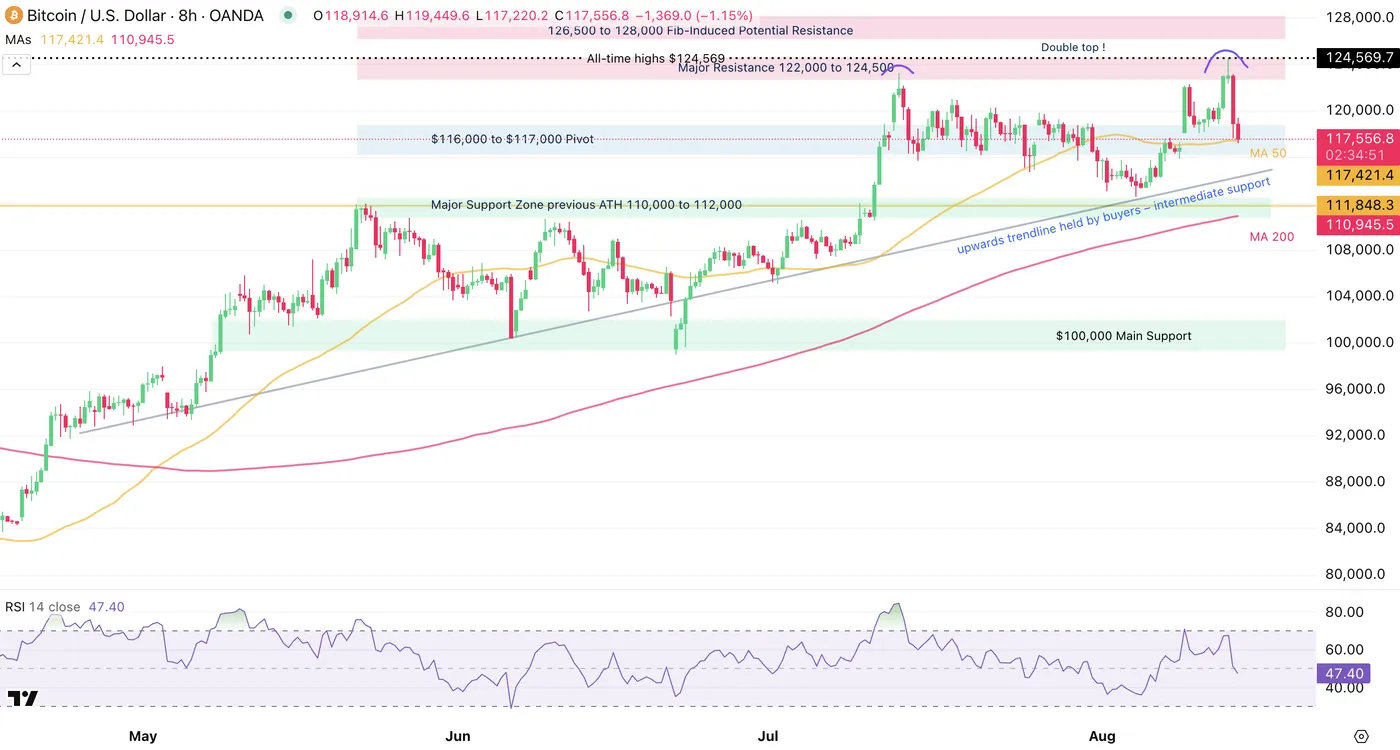
Bitcoin 8H Chart, August 14, 2025 – Source: TradingView
Bitcoin is seeing some heavy-selling, down around $7,000 from its most recent highs that got attained just yesterday evening.
8H RSI momentum is back to neutral but we will need to track if this is enough to stop the ongoing selling.
Prices are currently entering the $116,000 to $117,500 Pivot Zone and with the MA 50, it will be key to watch if some dip buyers enter.
If they don't the strength of the ongoing selling could point to a retest of the $110,000 Support.
Levels for BTC trading:
Support Levels:
- $116,000 to $117,000 Pivot
- $110,000 to $112,000 previous ATH support zone
- $100,000 Main support at psychological level
Resistance Levels:
- Current all-time high $124,596
- Major Resistance $122,000 to $124,500
- $126,500 to $128,000 Fib-extension potential resistance (1.382% from April to May up-move)
Ethereum 8H Chart
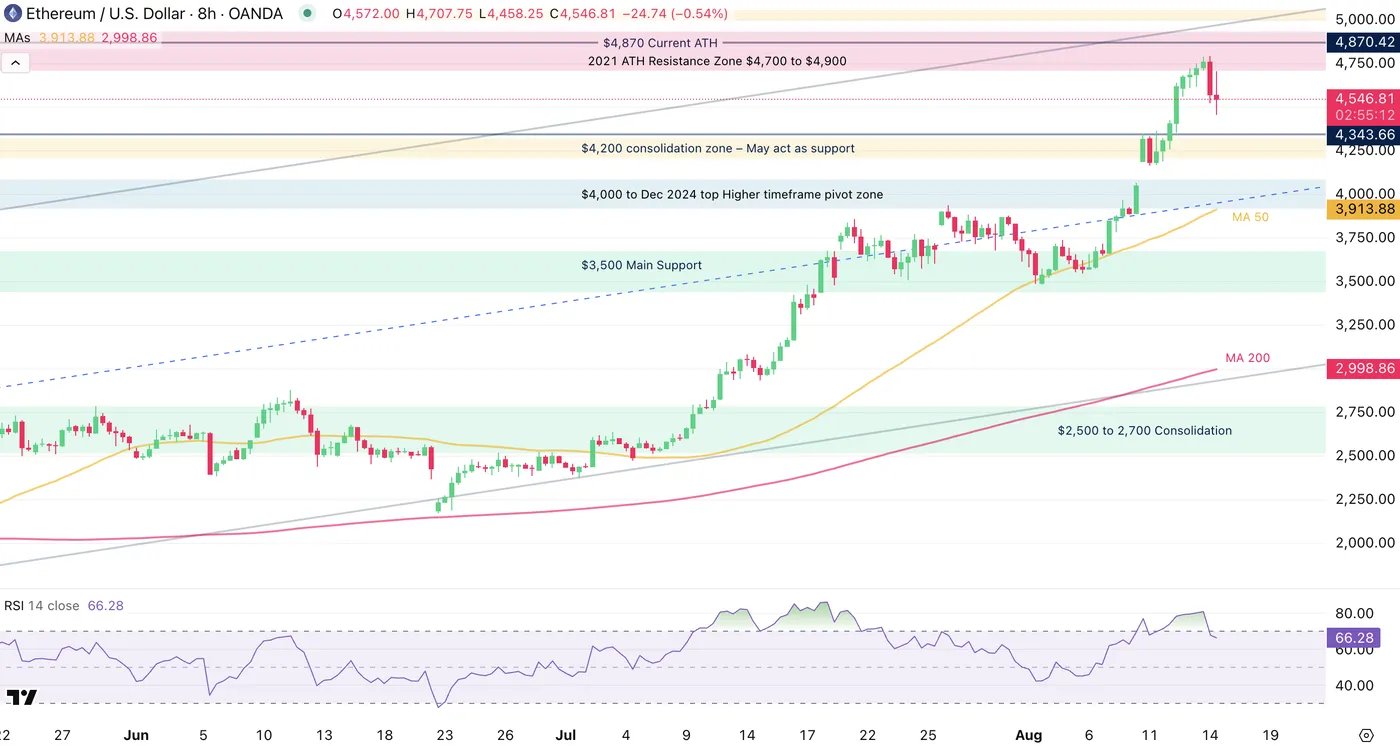
Ethereum 8H Chart, August 14, 2025 – Source: TradingView
Looking at this chart really shows a strong picture, but profit-taking is not too surprising at these levels – particularly as we come at the target of a measured move of the first impulse post Israel-Iran War lows.
Do watch out for euphoric leveraged longs that have accumulated throughout the highs which may magnify the correction. For now, we are at 23.6% of the second move up or 13.6% of the total move.
Watch the $4,200 level that served as consolidation before the run-higher for potential dip buying, but the way overbought RSI would need to get closer to neutral.
Another key point to look at is a retest of the $3,900 – $4,000 pivot, a 61.8% of the whole move.
Levels for ETH trading:
Support Levels:
- $3,500 Support zone
- $4,000 Main pivot
- $4,200 consolidation zone
Resistance Levels:
Current highs $4,793
- $4,700 to $4,900 All-time high resistance zone
- $4,870 2021 record
- Potential resistance at 1.618% Fibonacci extension of April to July up-move
Solana 8H Chart
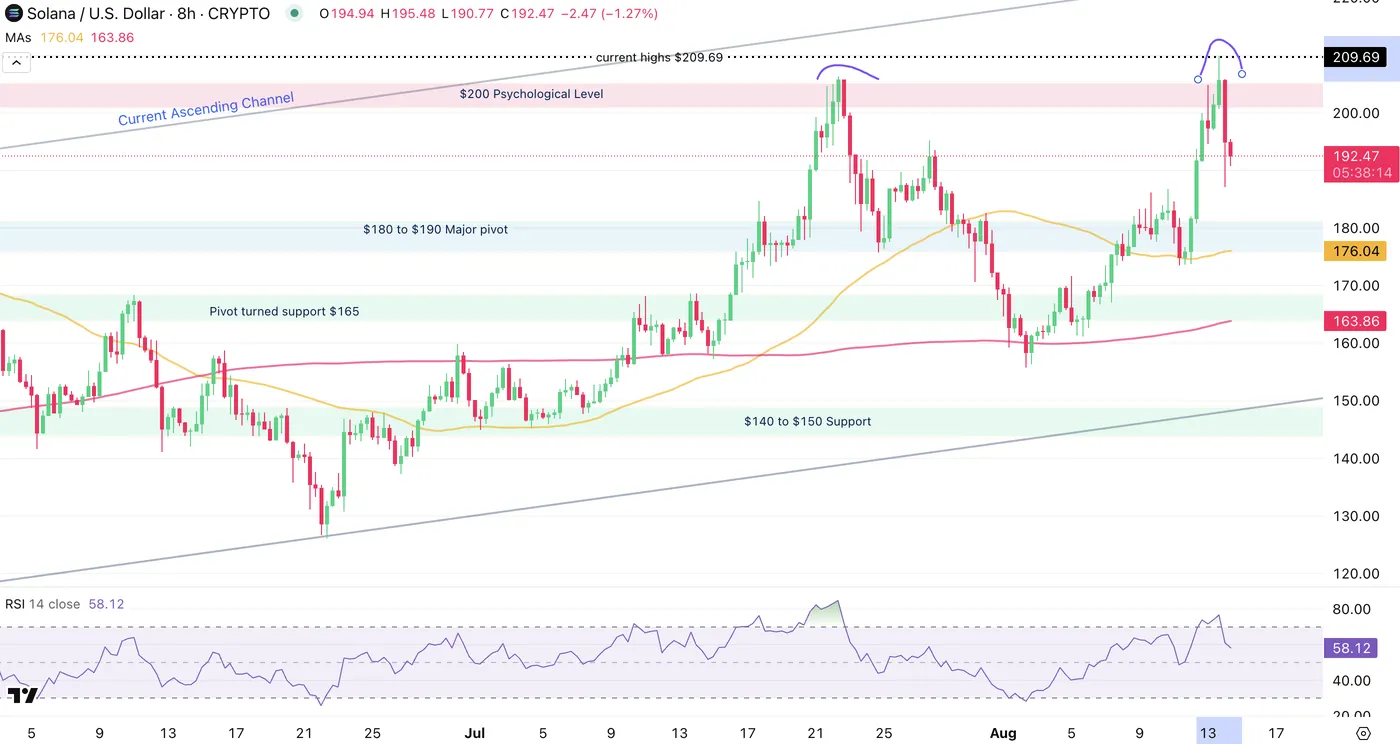
Solana 8H Chart, August 14, 2025 – Source: TradingView
Watch for the most recent double top around $200.
Levels for SOL trading:
Support Levels:
- $180 to $190 Major pivot
- Pivot turned support $165
- $140 to $150 Main support
Resistance Levels:
- Current highs $209,69
- $200 Psychological Level
- $295 January 2025 All-time highs
XRP 8H Chart
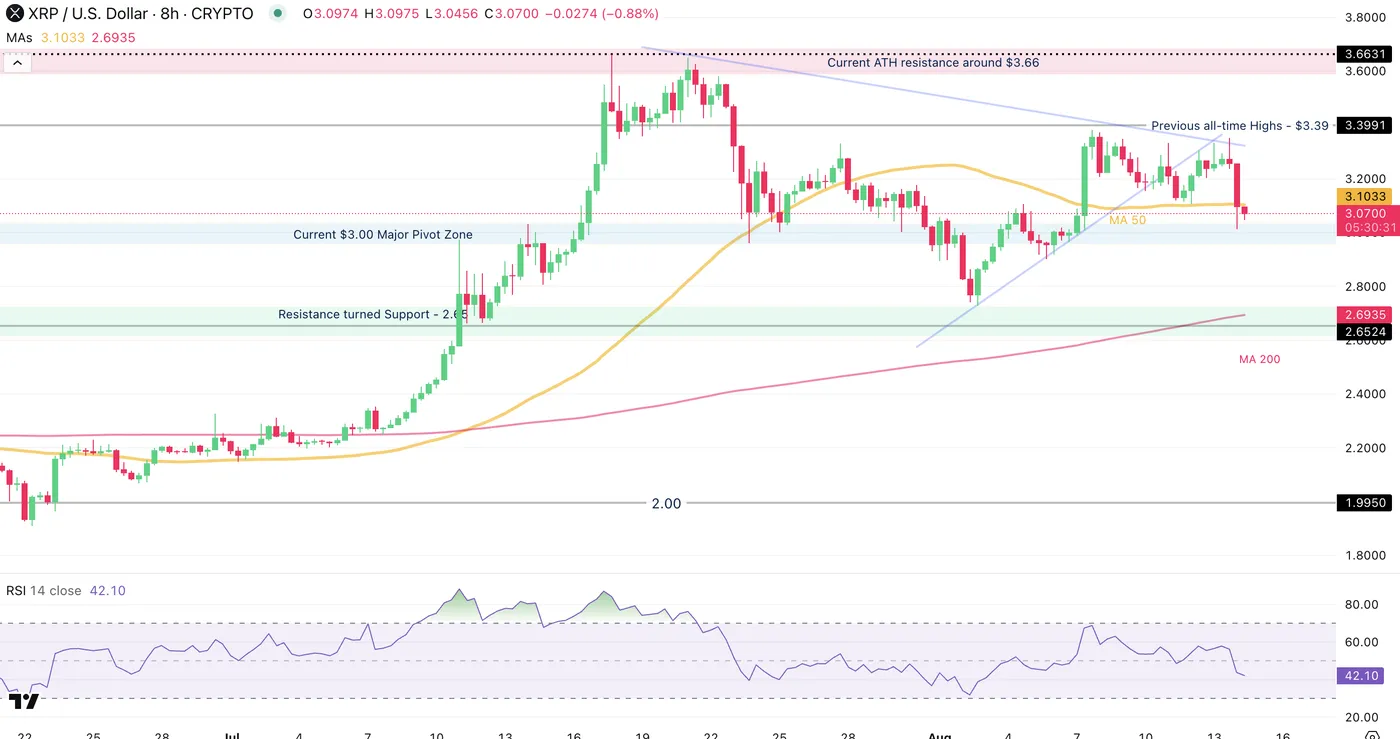
XRP hasn't been able to hold the bullish support of the triangle formation mentioned in our last market overview.
Watch momentum as it starts to get in bearish territory.
Holding around $3.00 or just around it is still a decent sign and could be good for pullback buying if there are signs of rebound from here.
However keep in mind that XRP is up 500% since November 2024 and 90% since April 2025, so further correction could be into play.
Levels for XRP trading:
Support Levels:
- Previous all-time Highs - $3.39 imminent resistance
- Current ATH resistance around $3.66
- $4.00 to $4.30 Potential Resistance
Resistance Levels:
- Current $3.00 Major Pivot Zone (Confluence with 4H MA 50 and 200)
- Resistance turned Support - 2.65
- May support 2.20 to $2.30
Safe Trades!
Bitcoin Wave Analysis
Bitcoin: ⬇️ Sell
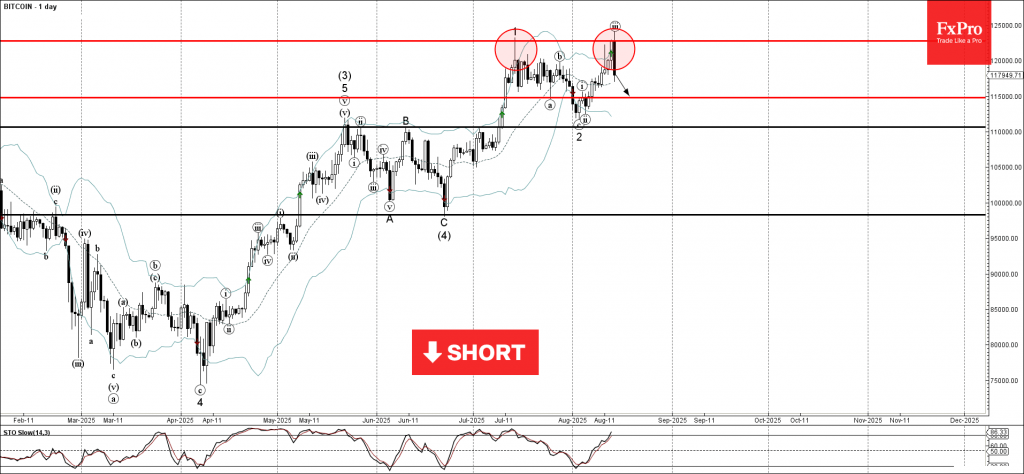
- Bitcoin reversed from the strong resistance 122770.00
- Likely to fall to support level 115000.00
Bitcoin today recently reversed down with the Bearish Engulfing from the strong resistance level 122770.00 (which stopped the previous minor impulse wave 1 at the start of July).
The resistance zone near the resistance level of 122770.00 was strengthened by the upper daily Bollinger Band.
Given the strength of the resistance level 122770.00 and the overbought daily Stochastic, Bitcoin can be expected to fall to the next support level 115000.00.
AUDCAD Wave Analysis
AUDCAD: ⬇️ Sell
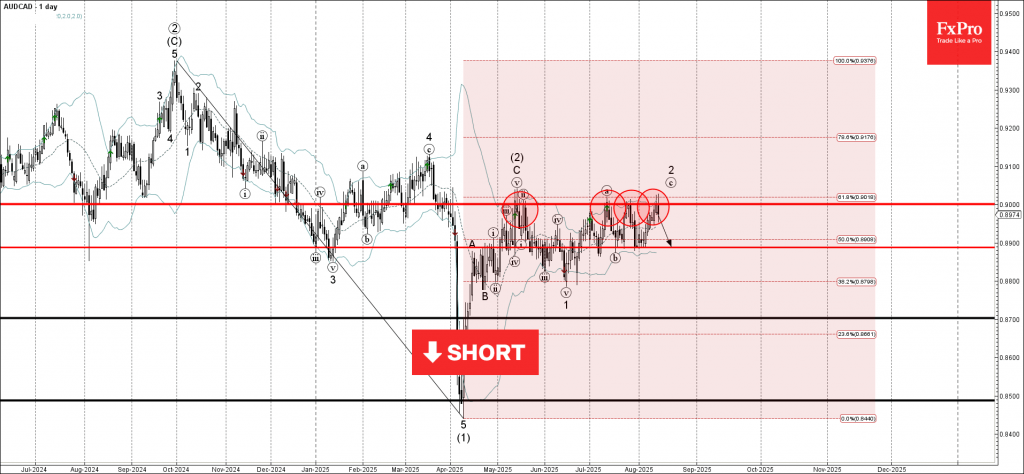
- AUDCAD reversed from the round resistance level of 0.9000
- Likely to fall to support level 0.8900
AUDCAD currency pair recently reversed from the round resistance level of 0.9000 (which has been steadily reversing the price from the start of May).
The resistance zone near the resistance level of 0.9000 was strengthened by the upper daily Bollinger Band and by the 61.8% Fibonacci correction of the downward impulse from October.
AUDCAD currency pair can be expected to fall to the next support level 0.8900, which has reversed the pair from the start of July.
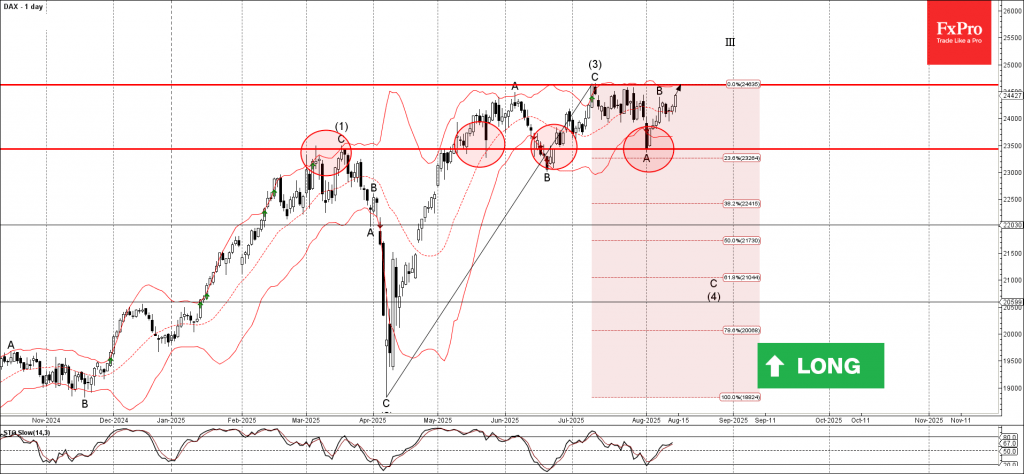
DAX Wave Analysis
DAX: ⬆️ Buy
- DAX reversed from the support level of 23500.00
- Likely to reach resistance level 24625.00
DAX index recently reversed up from the support level of 23500.00 (which has been reversing the price from May), standing near the lower daily Bollinger Band.
The upward reversal from the support level of 23500.00 started the active short-term impulse wave B.
Given the clear daily uptrend, the DAX index can be expected to rise to the next resistance level 24625.00, which stopped the previous impulse wave (3).