Sample Category Title
Switzerland’s KOF Economic Barometer Surprisingly Fell In June
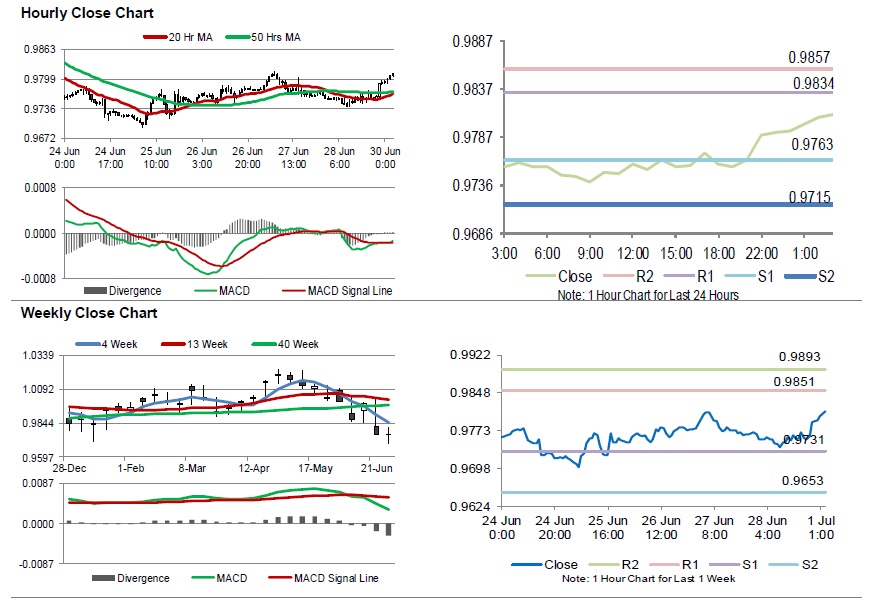
For the 24 hours to 23:00 GMT, the USD declined 0.08% against the CHF and closed at 0.9762 on Friday.
On the macro front, Switzerland's KOF economic barometer unexpectedly slid to a level of 93.6 in June, defying market consensus for a gain to a level of 94.8. In the previous month, the KOF economic barometer had registered a revised reading of 93.8.
In the Asian session, at GMT0300, the pair is trading at 0.9810, with the USD trading 0.49% higher against the CHF from Friday's close.
The pair is expected to find support at 0.9763, and a fall through could take it to the next support level of 0.9715. The pair is expected to find its first resistance at 0.9834, and a rise through could take it to the next resistance level of 0.9857.
Moving ahead, investors would keep an eye on Switzerland's real retail sales for May and the Markit manufacturing PMI for June, scheduled to release in a while.
The currency pair is trading above its 20 Hr and 50 Hr moving averages.
Canada’s GDP Growth Surpassed Expectations In April
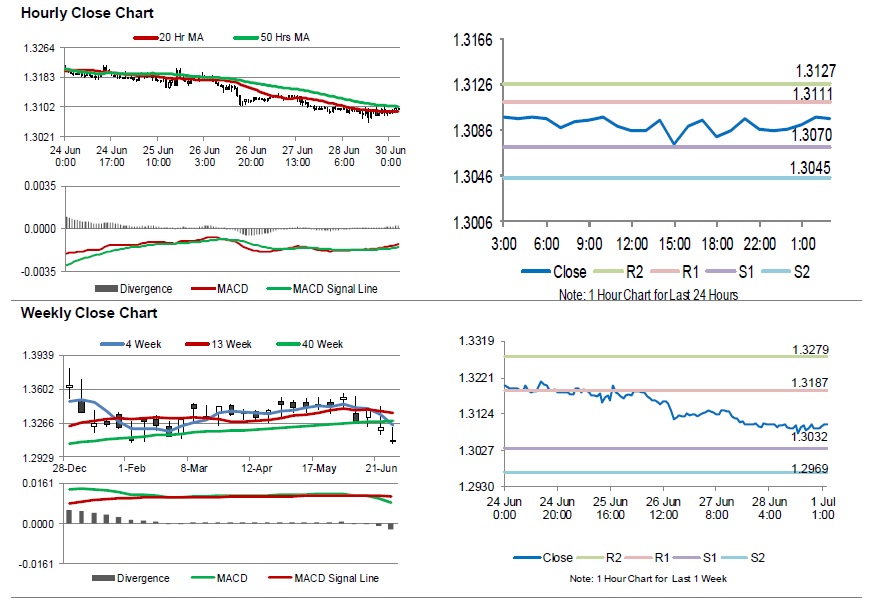
For the 24 hours to 23:00 GMT, the USD slightly declined against the CAD and closed at 1.3096 on Friday.
Data showed that Canada's gross domestic product (GDP) advanced 0.3% on a monthly basis in April, more than market expectations for a rise of 0.2%. In the previous month, the GDP had registered a rise of 0.5%.
In the Asian session, at GMT0300, the pair is trading at 1.3096, with the USD trading flat against the CAD from Friday's close.
The pair is expected to find support at 1.3070, and a fall through could take it to the next support level of 1.3045. The pair is expected to find its first resistance at 1.3111, and a rise through could take it to the next resistance level of 1.3127.
The currency pair is trading above its 20 Hr moving average and showing convergence with its 50 Hr moving average.
Aussie Reverses Its Gains In The Asian Session
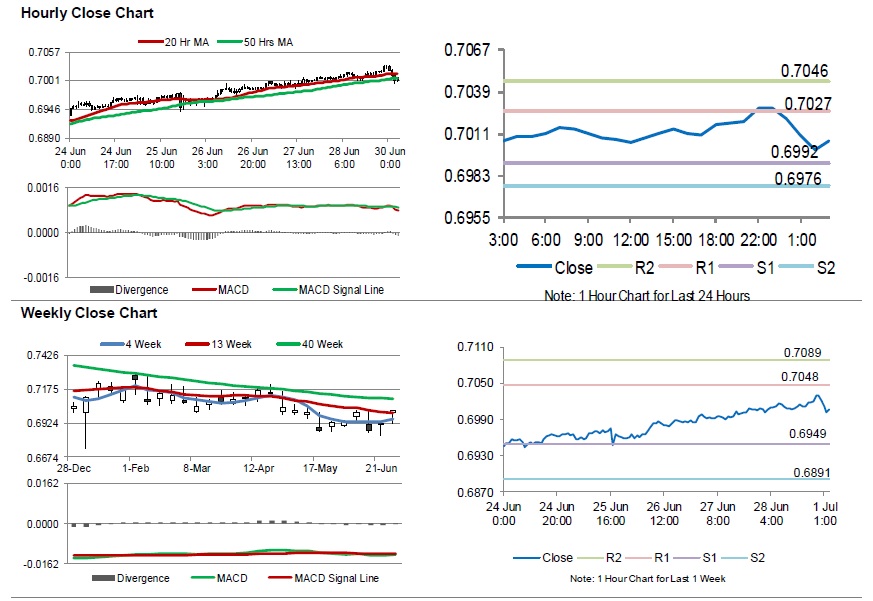
For the 24 hours to 23:00 GMT, the AUD rose 0.21% against the USD and closed at 0.7020 on Friday.
LME Copper prices rose 0.3% or $18.5/MT to $5972.0/MT. Aluminium prices declined 0.5% or $8.5/MT to $1773.5/MT.
In the Asian session, at GMT0300, the pair is trading at 0.7007, with the AUD trading 0.19% lower against the USD from Friday’s close.
Overnight data showed that, in Australia, the AiG performance of manufacturing index fell to a level of 49.4 in June, compared to a reading of 52.7 in the previous month. Meanwhile, in China, Australia’s largest trading partner, the Caixin/Markit manufacturing PMI contracted to a level of 49.4 in June, compared to a reading of 50.2 in the prior month.
The pair is expected to find support at 0.6992, and a fall through could take it to the next support level of 0.6976. The pair is expected to find its first resistance at 0.7027, and a rise through could take it to the next resistance level of 0.7046.
Going forward, traders would keep an eye on the Reserve Bank of Australia’s interest rate decision, set to release early morning tomorrow.
The currency pair is trading below its 20 Hr moving average and showing convergence with its 50 Hr moving average.
Gold: Yellow Metal Reverses Its Gains In The Asians Session
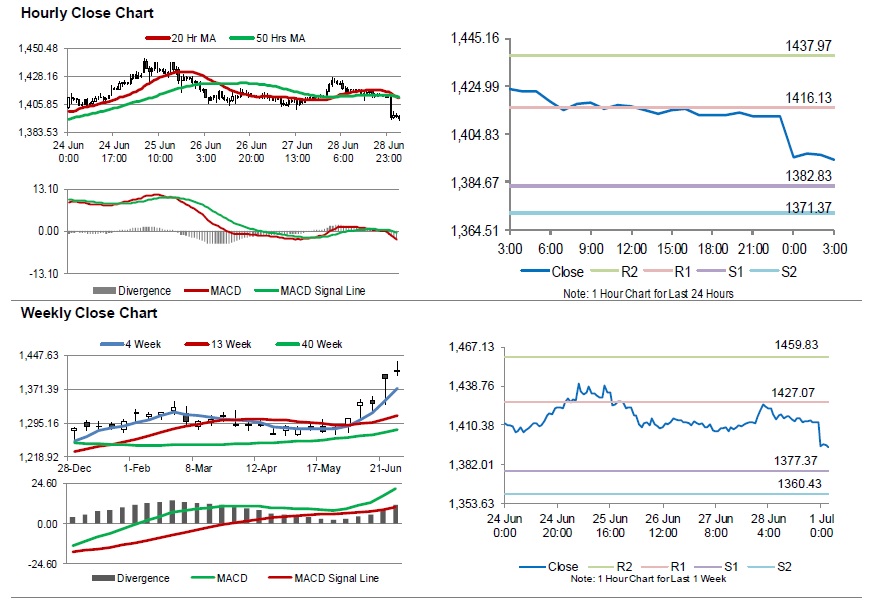
For the 24 hours to 23:00 GMT, Gold rose 0.08% against the USD and closed at USD1413.00 per ounce on Friday, amid weakness in the greenback.
In the Asian session, at GMT0300, the pair is trading at 1394.30, with gold trading 1.32% lower against the USD from Friday’s close.
The pair is expected to find support at 1382.83, and a fall through could take it to the next support level of 1371.37. The pair is expected to find its first resistance at 1416.13, and a rise through could take it to the next resistance level of 1437.97.
The yellow metal is trading below its 20 Hr and 50 Hr moving averages.
Silver: White Metal Trading On A Weaker Footing This Morning
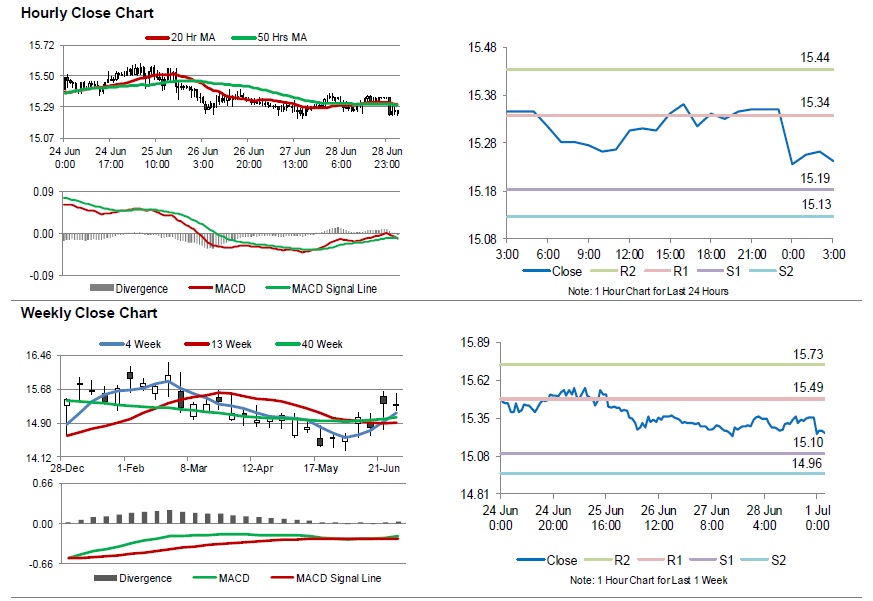
For the 24 hours to 23:00 GMT, Silver rose 0.36% against the USD and closed at USD15.35 per ounce on Friday, tracking gains in gold prices.
In the Asian session, at GMT0300, the pair is trading at 15.25, with silver trading 0.68% lower against the USD from Friday’s close.
The pair is expected to find support at 15.19, and a fall through could take it to the next support level of 15.13. The pair is expected to find its first resistance at 15.34, and a rise through could take it to the next resistance level of 15.44.
The white metal is trading below its 20 Hr and 50 Hr moving averages.
Crude Oil: Oil Trading Higher In The Morning Session
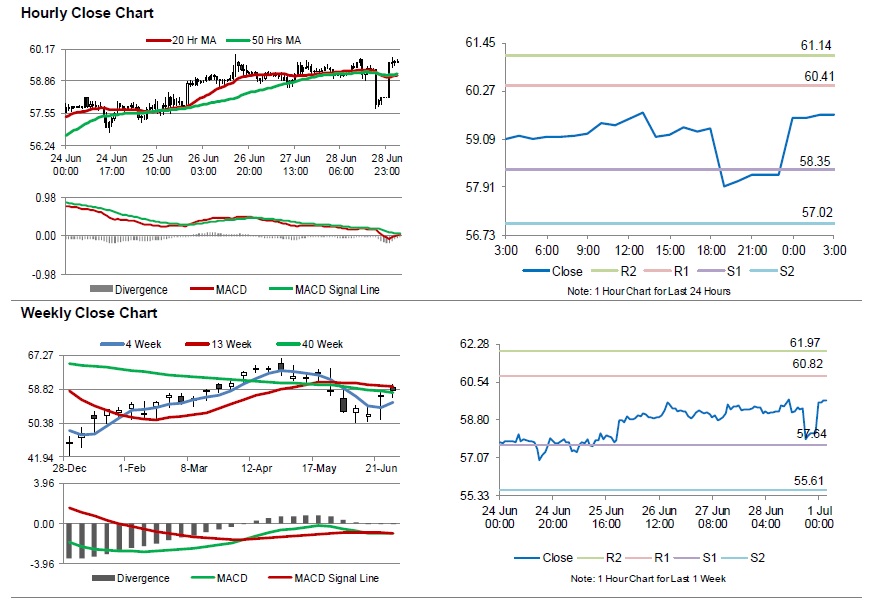
For the 24 hours to 23:00 GMT, Crude Oil declined 2.14% against the USD and closed at USD58.06 per barrel on Friday, after fresh figures from Baker Hughes disclosed that the number of active oil rigs advanced by 4 to 793 for the week ended 28 June.
In the Asian session, at GMT0300, the pair is trading at 59.68, with oil trading 2.79% higher against the USD from Friday’s close.
The pair is expected to find support at 58.35, and a fall through could take it to the next support level of 57.02. The pair is expected to find its first resistance at 60.41, and a rise through could take it to the next resistance level of 61.14.
Crude oil is trading above its 20 Hr and 50 Hr moving averages.
China Caixin PMI manufacturing dropped to 49.4, second lowest since Jun 2016
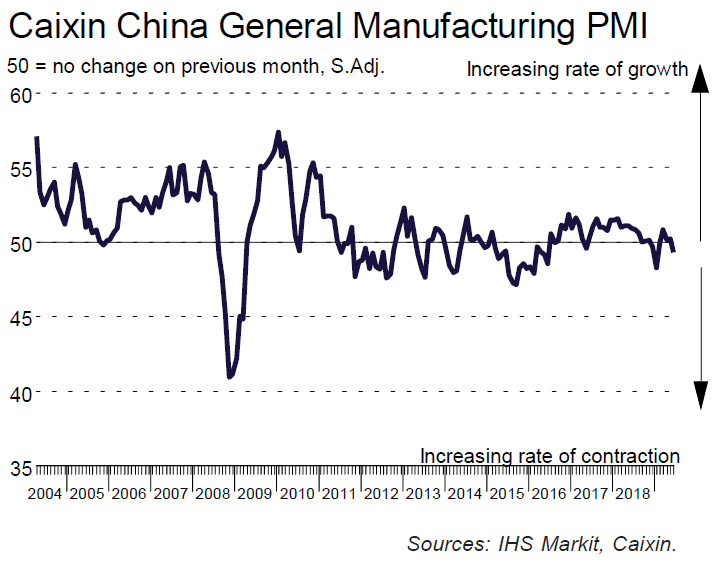
China Caixin PMI Manufacturing dropped to 49.4 in June, down from 50.2, and missed expectation of 50.1. It's also the second lowest since June 2016, and below neutral 50-mark dividing expansion from contraction again. It's noted that output and new work intakes declined for first time since January. There was renewed reduction in export sales while goods producers cutback input purchasing and payroll numbers
Zhengsheng Zhong, Director of Macroeconomic Analysis at CEBM Group said: "Overall, China's economy came under further pressure in June. Domestic demand shrank notably, foreign demand was still underpinned by front-loading exports, and business confidence fell sharply. It's crucial for policymakers to step up countercyclical policies. New types of infrastructure, high-tech manufacturing and consumption are likely to be the main policy focuses."
Also released over the weekend, the official China PMI Manufacturing was unchanged at 49.4 in June, below expectation of 49.5. Official PMI Non-Manufacturing dropped to 54.2, down from 54.3, matched expectations.
Market Morning Briefing: Aussie Is Likely To Test 0.7050
STOCKS
Risk appetite is back into the market as the US and China agree not to levy any more tariffs and also to resume trade talks. Asians indices have risen sharply higher and the Dow Futures (26799.5, +206.5, +0.78%) is up over 200 points indicating a positive open for the US markets as well today. Our broader bullish view on the equities will remain intact. Indices like the Dow which have corrected slightly last week are likely to resume their uptrend in-line with our expectation.
As expected the support at 26450 had held very well on the Dow (26599.96, +73.38, +0.28%) last week. The index can resume its uptrend now targeting 27200 and 27500 in the coming days.
DAX (12398.80, +127.77, +1.04%) had started to reverse higher last week itself and the recent positive developments over the weekend can boost the momentum. DAX can sure to 12600-12800 on a break above the immediate resistance level of 12435. Support for the index is in the 12200-12170 region which has held very well last week as expected.
Nikkei (21655.97, +380.05, +1.79%) has surged breaking above 21500 as expected. The bullish view intact to test 21750 on the upside..
Shanghai (3041.38, +62.50, +2.10%) has risen above its resistance at 3020 and keeps our bullish view intact for a rise to 3050-3100. On a bigger picture, Shanghai could be now gearing up to test 3200 over the medium term.
Sensex (39394.64, -191.77, -0.48%) and Nifty (11788.85, -52.70, -0.45%) lost pace towards the end of last week. If they manage to bounce today taking cues from the Asian markets and breach their resistance levels of 39750 (Sensex) and 11900 (Nifty) there is possibility of seeing fresh rally in the coming days. In that case Sensex can target 40000-40500 and the Nifty can rise to 12000-12150. Else they can remain range bound between 11600-11900 (Nifty) and 38900 and 39800 (Sensex) for some more time.
COMMODITIES
Crude prices trade higher ahead of the OPEC+ policy meet today and the meeting with OPEC producers tomorrow. While the market has factored in a possible extension of supply cuts till end of this year and possibly early 2020, the markets await the outcome from the meeting to derive further information. Gold and Silver trades lower while Copper has moved up sharply after US and China agreed to continue negotiations.
Brent Crude (66) is trading higher but below our mentioned resistance near 67. While 67 holds, Brent could decline towards 63 again. Above 67, crucial resistance is seen at 69.
Nymex WTI (59.62) has also moved up. Note immediate resistance near 60 which is likely to hold in the near term producing a rejection towards 56. There is som possibility of range trade within 60-56 in the next few weeks. We would watch price action near 60 closely as a break on the upside could be an important bullish signal for the longer term.
Gold (1395.60) has dropped sharply after news on Saturday stated that US and China would restart trade talks and till the negotiations are on the fresh imposition of tariffs would remain suspended. Gold has support near 1390/80 and could trade within 1450/60-1390/80 in the medium term. For now, a bounce from 1390/80 looks likely.
Silver (15.25) is trading lower too and could test 15 before bouncing back from there. Very near term is bearish.
Copper (2.7435) rise sharply to make fresh highs within the current move as US-China agreed to resume trade talks. While above 2.70, Copper is bullish towards 2.76/79 in the near term.
FOREX
Dollar Index (96.35) has risen slightly and could test 96.50/70 on the upside from where another short dip is likely.
Euro (1.1352) is stuck between 1.1345 and 1.1415. Euro could test 1.1325 on a break below 1.1345 before bouncing back sharply from there. But if a bounce from here itself takes place, Euro could rally once again towards 1.1400 and higher in the medium term.
Dollar-Yen (108.22) has risen sharply and is trading above 108 just now. While the currency pair sustains above 108, it could test 108.50-108.80 on the upside. Very near term looks bullish.
Euro-Yen (122.88) has risen as expected but has immediate resistance above current levels near 123 which is likely to push the pair back to lower levels near 121.50-121.00.
Aussie (0.7006) is likely to test 0.7050 before coming off from there. Very near term looks bullish.
Pound (1.2699) has room to rise towards 1.2784 before coming back from there in the near term. Near term looks bullish.
USDCNY (6.8382) could test 6.83 from where a rise towards 6.85 again looks likely. A break below 6.83, if seen would make the pair bearish for the medium term towards 6.81. Preference is for a bounce from current levels towards 6.90.
USDINR (69.02) tested immediate support near 68.87 on Friday from where it bounced to close near 69. Another attempt to test 69.80/90 is on the cards but the current bounce has scope to extend towards 69.20/25 before resuming the fall in the medium term. On a sustained break below 68.80, we would bring in 68.60/50 into the picture.
INTEREST RATES
The positive outcome of the US and China meeting over the weekend may give a breather to the yields which have been on a strong downtrend. A sideways consolidation or a mild corrective rally is possible in the near-term before the broader downtrend resumes.
The US Yields have bounces across tenors. The 2Yr (1.78%) and 5Yr (1.80%) are up 3 bps while the 10Yr (2.03%) and 30Yr (2.55%) are up 2 bps each. The yields have been consolidating sideways for more than a week now. The can continue to trade sideways for some more time within their overall downtrend. The 30Yr yield can trade between 2.53% and 2.60% in the coming days before a fresh fall to 2.50% and 2.48%. The 10Yr can remain range bound between 2% and 2.10%.
The German Yields remains subdued. The 2Yr (-0.77%) has dipped more than other and can test -0.80% in the near term after which a bounce is possible. The 5Yr (-0.67%) and 10Yr (-0.33%) have dipped slightly. The 5Yr can move further lower towards -0.73% in the coming days. The 30Yr (0.26%) remains stable and can consolidate between 0.24% and 0.30%.
The 10Yr GOI (7.00%) was stuck in a narrow range on Friday. The near-term outlook is mixed. However, we expect the yield to fall within its 6.90%-7.10% sideways range towards 6.90% in the coming days. The broader view also remains bearish for the 10Yr to break the range below 6.90% and fall to 6.80% and 6.75% in the coming weeks.
GBP/USD And EUR/GBP: British Pound Could Gain Traction
GBP/USD settled above the key 1.2650 and 1.2660 support levels, with a positive bias. EUR/GBP started a major downside correction and broke a major support near 0.8960.
Important Takeaways for GBP/USD and EUR/GBP
- The British Pound is trading nicely above the key 1.2660 support area.
- There is a connecting bearish trend line forming with resistance near 1.2718 on the hourly chart of GBP/USD.
- EUR/GBP formed a short term top near the 0.8991 level and recently declined below 0.8980.
- There was a break below a major bullish trend line with support near 0.8958 on the hourly chart.
GBP/USD Technical Analysis
The British Pound started a decent upward move after it broke the 1.2600 resistance area against the US Dollar. As a result, the GBP/USD pair gained momentum above the 1.2620 and 1.2640 levels.
Moreover, there was a close above the key 1.2660 pivot level and the 50 hourly simple moving average. It traded towards the 1.2780 level on FXOpen and recently started a downside correction.
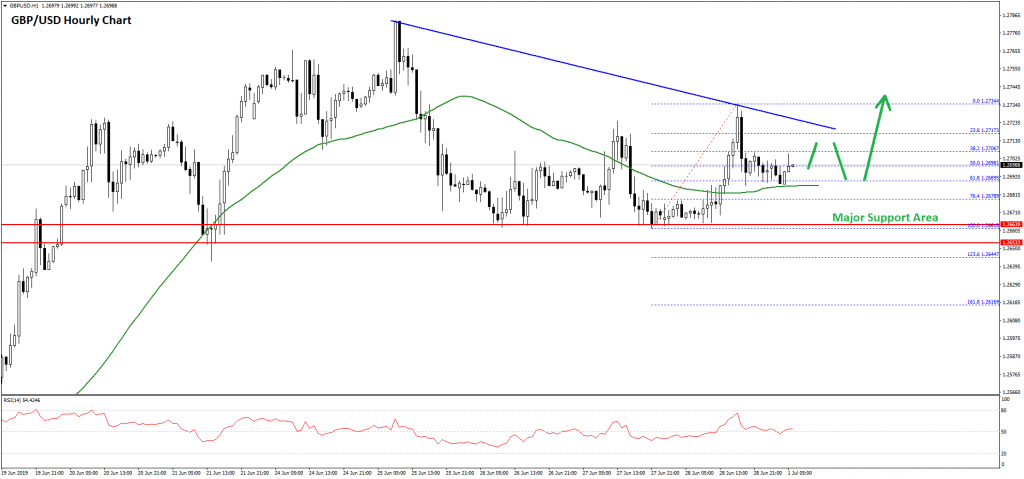
However, the previous resistance near the 1.2650 and 1.2660 levels acted as a strong support. There were many attempts to clear the 1.2650 level, but sellers failed to gain control. The last swing low was near 1.2661 before the price climbed towards the 1.2734 level
It is currently correcting below the 1.2700 level and the 50% Fib retracement level of the last wave from the 1.2661 low to 1.2734 high. However, the 1.2690 level and the 50 hourly simple moving average are acting as a strong support.
Moreover, the 61.8% Fib retracement level of the last wave from the 1.2661 low to 1.2734 high is acting as a support. On the upside, there is a strong resistance forming near 1.2720 and 1.2730.
There is also a connecting bearish trend line forming with resistance near 1.2718 on the hourly chart of GBP/USD. Therefore, a successful break above the trend line and 1.2730 is needed for a fresh increase towards the 1.2780 or 1.2800 level.
On the downside, the main support is near the 1.2650 and 1.2660 levels. If there is a downside break below 1.2650, GBP/USD could decline back towards the 1.2600 support.
EUR/GBP Technical Analysis
The Euro climbed higher steadily this past week and broke the 0.8920 and 0.8950 resistance levels against the British Pound. The EUR/GBP pair even broke the 0.8980 level and traded close to the 0.9000 level.
However, the pair struggled to continue higher and a short term top was formed near the 0.8991 level. Later, the pair started a downside correction below the 0.8980 and 0.8975 levels.
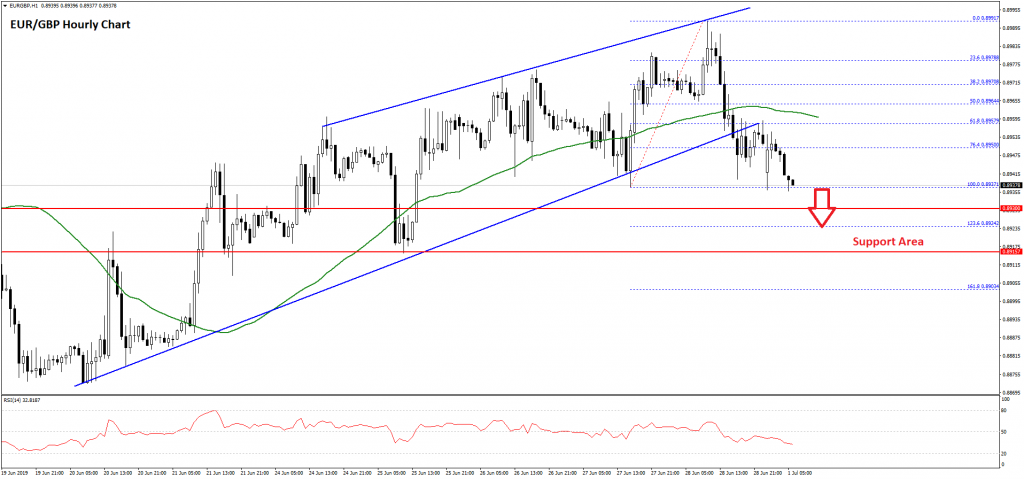
There was a break below a major bullish trend line with support near 0.8958 on the hourly chart. Moreover, the pair broke the 61.8% Fib retracement level of the last wave from the 0.8937 low to 0.8991 high.
Finally, there was a close below 0.8950 and the 50 hourly simple moving average. The price is now trading below the 0.8940 level and it is testing the last swing low.
If there is a downside break, EUR/GBP could slide towards the 0.8930 support or the 1.236 Fib extension level of the last wave from the 0.8937 low to 0.8991 high at 0.8924.
On the upside, there is a strong resistance near the 0.8960 level and the 50 hourly SMA. A successful close above 0.8960 might start a fresh increase towards the 0.9000 level.
Japan Tankan large manufacturing index dropped to near three year low
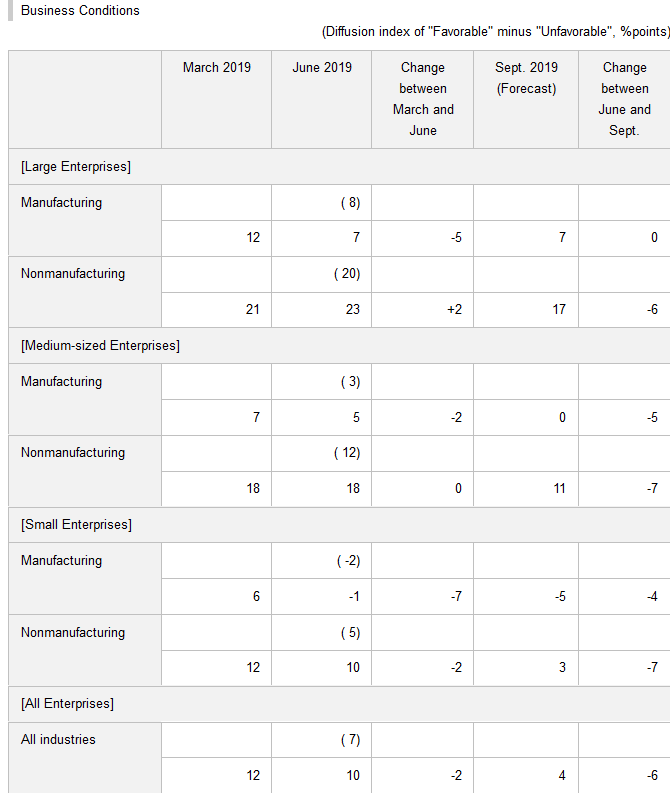
Japan Q2 Tankan survey showed large manufacturing index deteriorated to the worst level in nearly three years. But, improvements was seen in the non-manufacturing sector. Capital expenditure also held up well. Overall, the set of data argues that while the economy is stagnating, it's not falling off the cliff. And, BoJ will likely maintain its baseline of moderate expansion.
- Large Manufacturing Index dropped to 7, down from 12 and missed expectation of 9, lowest since September 2016.
- Large Manufacturers Outlook dropped to 7, down from 8, but beat expectation of 6.
- Large Non-Manufacturing Index rose to 23, up from 21, beat expectation of 20.
- Large Non-Manufacturing Outlook dropped to 17, down from 20, missed expectation of 19.
- All industry capex rose 7.4%, up from 1.2% but missed expectation of 8.1%.