Sample Category Title
Elliott Wave Analysis: EURAUD Aiming For 1.6200
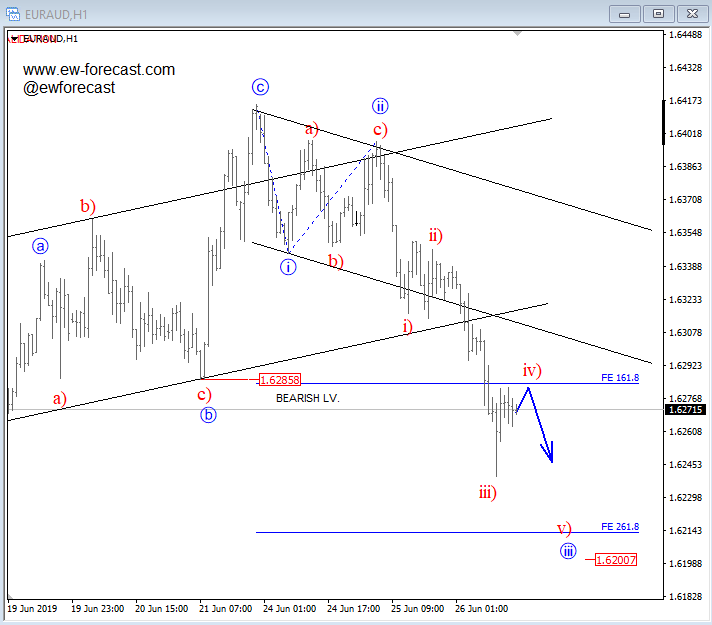
As expected, EURAUD broke below channel support line and 1.6285 region, so seems like trend is bearish confirmed, and it can be unfolding a new five-wave bearish cycle towards 1.6200 level or maybe even lower. That said, be aware of something more complex as well, but as long as price is trading below 1.6350 invalidation level, we remain bearish.
EURAUD, 1h
Hong Kong as Bargaining Chip in US-China Trade Talk?
Five years since the Umbrella Movement, Hong Kong has once again been in global spotlight. Just a week after a march by over a million protesters, about two million of Hongkongers took to the streets against the proposal of extradition bill amendment. The issue has caught so much international attention that Donald Trump views it as the ammunition for trade negotiations with China in the G20 summit. The US Congress has recently warned of amending the US-HK Policy Act which is critical not only to economic developments of Hong Kong, but also to mainland China, the world's second largest economy. Under the Policy Act, Hong Kong is considered as a non-sovereign entity distinct from China. Such consideration has also granted Hong Kong the status of a separate customs territory. Yet, the US Congress and the US President, by signing an executive order, have the right to suspend the application of any part of the Policy Act if Hong Kong is deemed to be "not sufficiently autonomous to justify treatment”. The world is closely- watching whether Trump would raise the Hong Kong problem in his meeting with Xi Jinping.
The proposed extradition bill amendment, if passed, would demolish the “one-country- two- systems” framework operating in Hong Kong since its handover from the UK to China in 1997. Such framework ensures that Hong Kong would continue to enjoy a high degree of autonomy, except for foreign and defence affairs. It is also entitled to independent executive, legislative and independent judicial power, including that of final adjudication. Notwithstanding its political nature, the “one-country- two- systems” framework has made enormous economic sense. It is not at all exaggerated to describe it as a cornerstone for mainland China’s skyrocketed economic and financial developments over the past decades.
Despite the promise of opening up its market for foreign investments as member of the WTO in 2001, the progress has been sluggish. In China, the deeply flawed legal and regulatory system, the lack of transparency in information transfer and the tight-grip control in the Communist Party leadership have been barriers to both foreign investments trying to tap the Chinese market, and Chinese capital to explore overseas opportunities. Hong Kong, with its special status, has helped resolve the problems by acting as a bridge of both sides. While being a part of China since 1997, Hong Kong has embraced economic freedom, a well-established financial infrastructure in compliance with international standard, and, most importantly, the rule of law upheld by the independent judicial system. These provide a secure environment for businesses and investments. While Chinese propaganda's angle of Hong Kong- China relations is solely on Hong Kong's reliance on China, Hong Kong, over the past decades, has acted as the largest provider of capitals for Chinese enterprises. It also helps lowering borrowing costs of Chinese firms while facilitating capitals from China to explore overseas investment opportunities. Needless to say, Hong Kong is the largest offshore renminibi hub, facilitating international use of China’s currency using long-built reputation of its own.
Largest Source of Capital for Chinese Firms
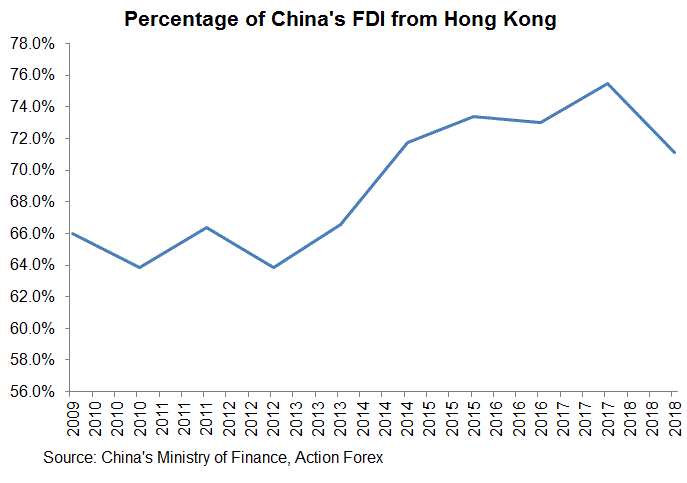
The Chinese economy has been benefiting from Hong Kong under the “one-country- two systems” framework. Hong Kong is the largest capital provider to Chinese companies, contributing about 70% of foreign direct investment (FDI) in China. Hong Kong is also the most popular place for Chinese companies to go public. As of December 2018, the number Chinese enterprises listed in the Hong Kong Exchange (HKEx) is 1146, encompassing H-shares, Red-chips and Mainland private enterprises in both the Main Board and GEM. This marks a 9% increase from a year ago. News that Alibaba will once again seek to get listed in Hong Kong, after the failure in 2014, is another evidence of attractiveness in the place. Hong Kong is the biggest source of bank loans to Chinese corporations. According to HKMA’ report, Hong Kong banks’ net claims on Chinese enterprises totaled at HK$713B in 2018. This represents 27% of the total net claims in Hong Kong.
Credit Rating Differential
Moreover, many Chinese firms have enjoying lower cost borrowing by registering themselves as “Hong Kong companies”. Credit ratings for Hong Kong are notches above those of China, in all three major rating agencies. In its latest report, Fitch maintained its credit rating for Hong Kong in AA+, a notch below the top AAA rating. China’s rating has stayed at A+, three notches below that of Hong Kong. At noted in the statement, Fitch suggested that the significant ratings differential between Hong Kong and China is hinged on the assumption that Hong Kong’s “governance standards, rule of law, policy framework, and business and regulatory environments remain distinct from that of mainland China”. Fitch also suggested that, citing the controversial extradition bill amendment, “a move towards greater alignment of institutional and regulatory frameworks” would ”diminish the autonomy of Hong Kong”. This could trigger the agency to review the rating differential.
Credit Ratings of Hong Kong and China
| S&P | Moody's | Fitch's | |
| Hong Kong | AA+ | Aa2 | AA+ |
| China | A+ | A1 | A+ |
“Going out” of Chinese Capitals
The special status of Hong Kong has also made it a gateway for Chinese capital to go abroad. While data provided by the Chinese government is susceptible to fraud. It is estimated that about 60% of China’s outward direct investments flow to Hong Kong, Cayman Islands and BVI. A large part of these capitals are channeled to other countries. Also, many Chinese corporations have benefited from becoming “Hong Kong companies”. The “separate customs territory” status enables these companies to avoid US tariff and export controls on certain products.
Renminbi internationalization
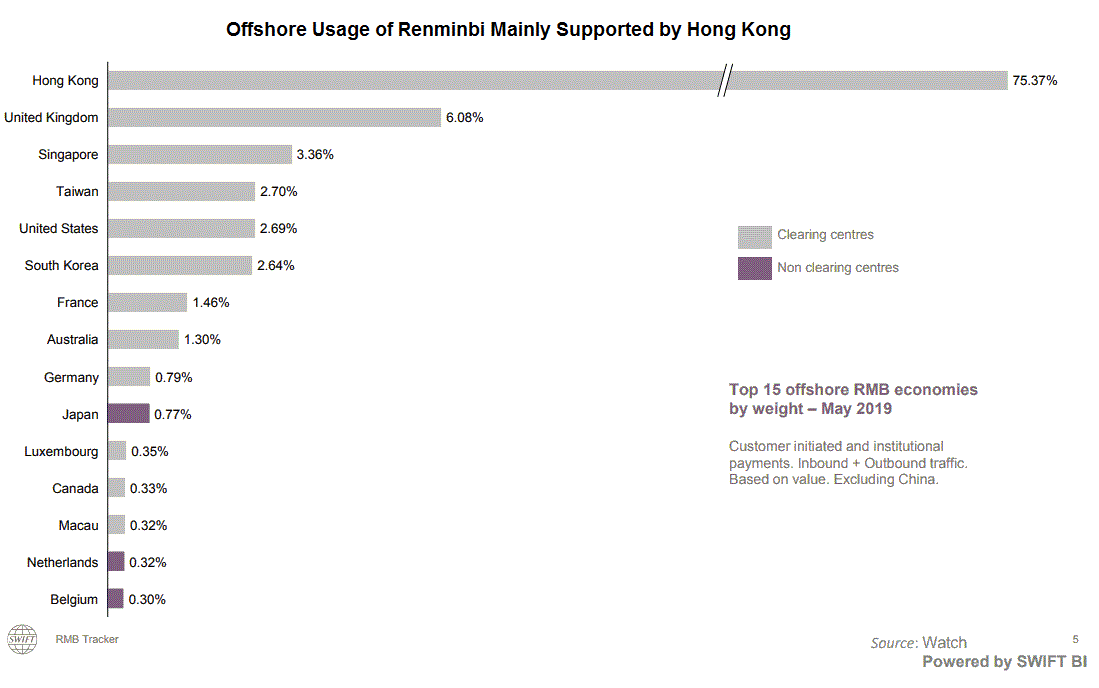
Replacing US dollar with renminibi as the world dominant reserve currency is not in China’s national interest. Yet, the authority would still seek to increase international use of renminibi and reduce dependence on USD. As such, certain degree of renminbi internationalization remains on the agenda. Hong Kong is the largest offshore renminbi market. Over the past decade, a number of channels have been developed in order to facilitate the international use of the renminbi. For instance, portfolio investments into China’s bond and equity markets can be made in renminbi via the Renminbi Qualified Foreign Institutional Investors (RQFII) scheme since 2011. The Shanghai-Hong Kong Stock Connect launched in 2014 and the Mainland-Hong Kong Mutual Recognition of Funds launched in 2015 have enhanced cross-border renminbi fund flows under portfolio investment. For 11th consecutive year, China has issued renminbi- denominated Treasury bonds in Hong Kong last week. Hong Kong has provided China a perfect environment to exercise its financial ambition, without the need to reform its own financial system.
Policy Act as Bargaining Chip in US-China as “One- Country- Two- Systems” is Critical for China’s Economic and Financial Developments
Back in the Deng Xiaoping era, one might have thought of using Hong Kong's special status as a "stepping stone" of China's economic liberalization for some just years. The rationale was that China's economic, legal and political systems would improve and eventually be in line with international standard. However, it is obvious that, although China has now become the world's second largest economy, the world largest importer and exporter, its developments in legal and political systems have been muted, if not retreating. As such, the special status of Hong Kong remains crucial in China.
The warning by China’s assistant minister of foreign affairs Zhang Jun that "no discussion of the topic is allowed in the G20 summit" has only proved the utmost importance of the topic to China, as well as the world. While the Policy Act can be a bargain chip in US-China trade negotiations, other countries should also ramp up pressure on China to defend the rights of Hong Kong. Appeasers of world order revisionist like China would eventually eat their own fruit.
Gold Eases from 6-Year High on Profit-Taking/Stronger Dollar
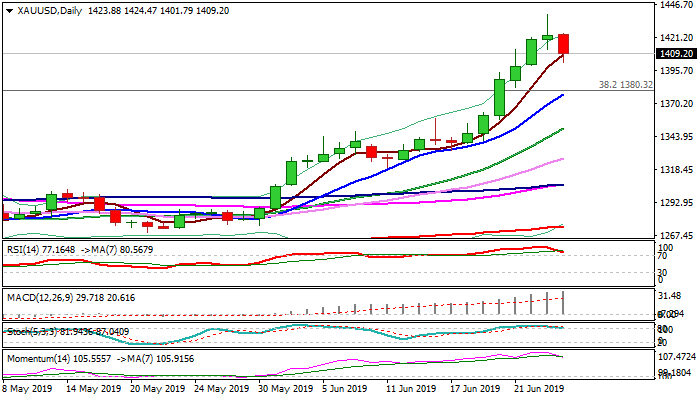
Spot gold eases on Wednesday and is on track for the first daily close in red after six days of uninterrupted rally.
Profit-taking after strong rally (boosted by geopolitical tensions and strong signals from Fed about rate cut that hit new six-years high at $1438) push the price lower.
Reversal pattern is forming on daily chart after Tuesday’s action ended in Doji with long upper shadow and subsequent easing generated negative signal.
The notion is supported by optimistic news about US/China trade talks which inflated dollar, as well as technical signals as daily RSI and stochastic turned south in overbought zone and momentum weakened.
Broken psychological $1400 support remains intact and limits pullback for now, however, further easing can be anticipated.
Overall picture remains bullish and current action can be seen as positioning, with extended dips to be contained at $1380/75 zone (broken Fibo 38.2% of larger $1920/$1046 fall / rising daily 10SMA / former top of July 2016) to keep bulls intact.
Res: 1424; 1433; 1438; 1450
Sup: 1400; 1396; 1385; 1380
MARKET WRAP: Stocks Moved Back In Positive Territory
Tech stocks supported the markets while the gold price remained above the 1400 mark for now
Stocks
- The S&P 500 Index recovered its losses and gained 0.21% as of 15:30 London time.
- The Stoxx Europe 600 Index failed to remain in the positive territory despite some strong economic numbers out of Germany. It fell 0.02%.
- The MSCI Emerging Market Index remained mostly neutral but recorded a small gain of 0.05%.
Currencies
- The Bloomberg Dollar Spot Index moved higher ahead of the Fed chairman’s speech. It climbed nearly 0.16%.
- The Euro struggled to stay above the 1.14 mark and fell 0.1% to $1.1388.
- The British pound remained weak as Carney points out to another stimulus package in case of no deal. The currency fell 0.09% to $1.2694.
- The Japanese yen dipped 0.35% to 107.62 per dollar.
Bonds
- The yield on 10-year Treasuries advanced three basis points to 1.98%.
- Germany’s 10-year yield soared by one basis point to -0.31%.
- Britain’s 10-year yield climbed two basis point to 0.811%.
Commodities
- West Texas Intermediate crude moved higher due to the heightened geopolitical tensions and gained 2.14% to $59.10 a barrel.
- Gold price dropped ahead of the Jerome Powell’s speech and remained at 1408. It lost nearly 1.24%.
WTI oil surges, pressing 60, as oil inventories dropped -12.8M barrels
US commercial crude oil inventories dropped sharply by -12.8M barrels in the week ending June 21. That's a much larger decline than expectation of -2.7M barrels. At 469.6M barrels, crude oil inventories are about 5% above the five year average for this time of year.
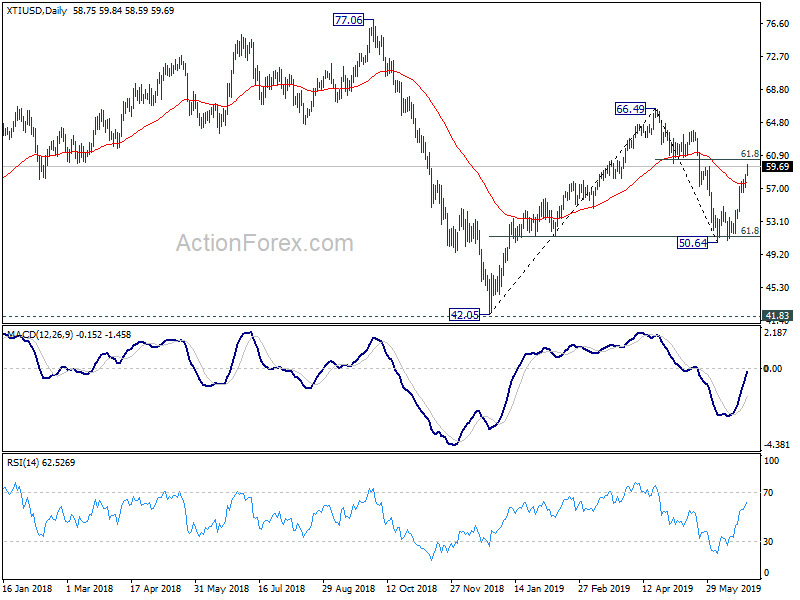
WTI crude oil jumps sharply to as high as 59.84 after the release. It's now in a strong resistance zone between 60.03 and 61.8% retracement of 66.49 to 50.64 at 60.34. We'd be cautious on strong resistance from there to limit upside. However, as there is upside re-acceleration above 55 day EMA, further rise would remain expected as long as 58.14 support holds.
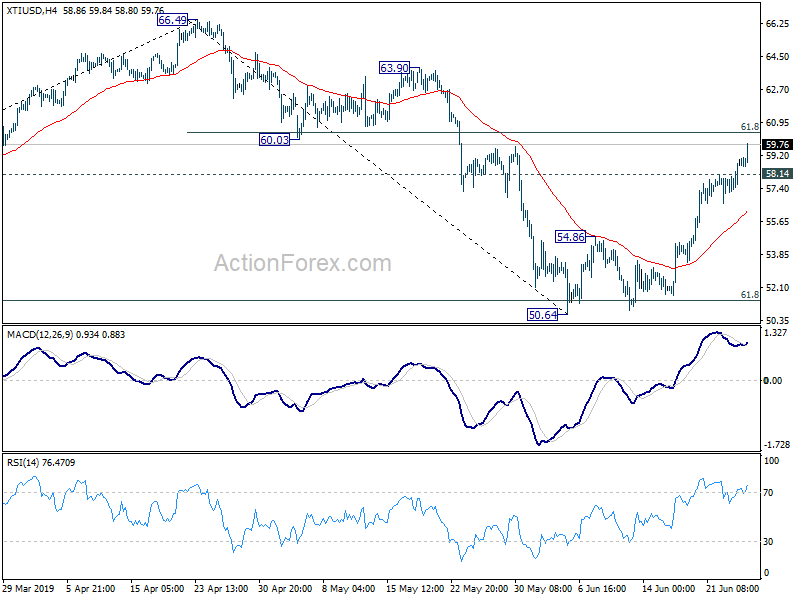
Sustained break of 60.34 will pave the way to retest 66.49 resistance. This will also add to the case that rise from 42.05 is resuming. Though, break of 58.14 will suggest rejection by the 60.03/34 resistance zone and turn near term outlook bearish for 50.64 support again.
Bitcoin – The Surge Goes On
It seems like only cryptocurrencies can experience the kind of rally that we’re currently seeing with bitcoin up almost 40% in just under a week and more than 200% since early April.
Bitcoin Daily Chart
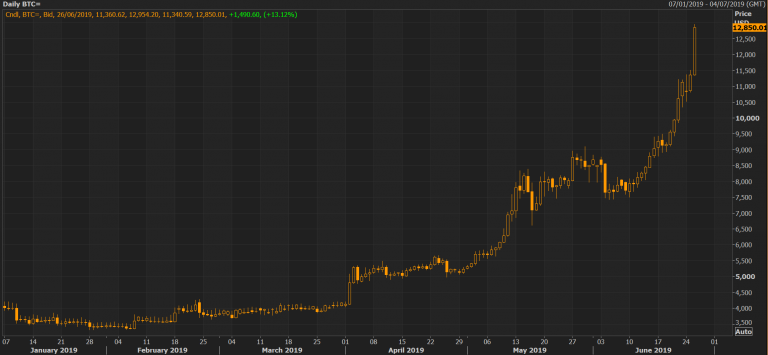
Any suggestion that the space has matured over the last 18 months and that this rally would be different has clearly been cast aside, with this showing no signs of easing up.
While I understand the excitement for the community that a company like Facebook, backed by other big names, has launched its own coin, this just feels a lot like last time and we all know what happened then.
Perhaps this time the drop off won’t be so bad as we are seeing more mainstream adoption but it may be naive to think that it can’t come crashing down again.
WTI Oil Outlook: Oil Price Extend Advance Through Strong 100/200SMA Barriers
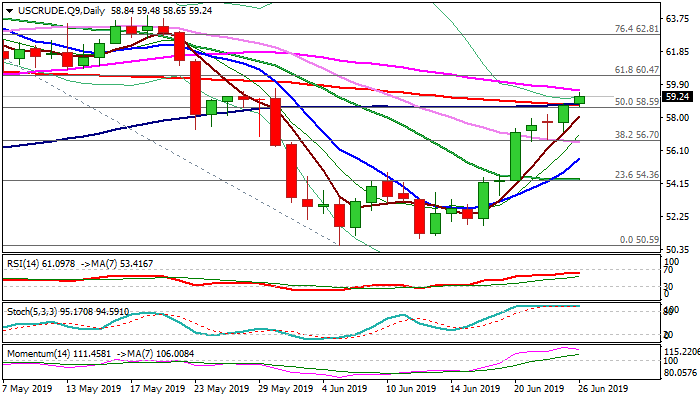
WTI oil maintains bullish firm bullish tone and extends advance through key barriers at $58.80 (converged 100/200SMA on track to form bull-cross) on Wednesday. The sentiment was boosted by strong draw in US crude stocks (API report on Tuesday showed draw of 7.5 mln bls vs previous week's draw of 0.8 mln bls) and positive tones from US/China trade talks, as recent tensions in the Middle East continue to inflate oil prices. Markets await release of US EIA crude inventories report, due later today (-2.5 mln bls f/c vs -3.1 mln bls previous week) which could further boost the price on stronger than expected drop in crude stocks. OPEC meeting about extension of production cut nears, with focus on the meeting of Russian President Putin and Saudi Crown Prince Mohammed Bin Salman on G20 meeting this weekend, when two leaders will discuss the extension of the deal. Bulls for now ignore overbought conditions and weaker momentum and pressure immediate resistance at $59.60 (falling 55SMA) which guards psychological $60 barrier, with stronger bullish acceleration expected to challenge pivotal Fibo barrier at $60.47 (61.8% of $66.58/$50.59). Daily cloud lays above and twists tomorrow, which would also attract bulls. Broken 100/200SMA's now reverted to supports ($58.80), followed by broken Fibo 50% barrier at $58.59, with daily close above 100/200SMA's needed to confirm bullish stance.
Res: 59.60; 60.00; 60.47; 61.00
Sup: 58.80; 58.59; 58.08; 57.19
USD/CAD Mid-Day Outlook
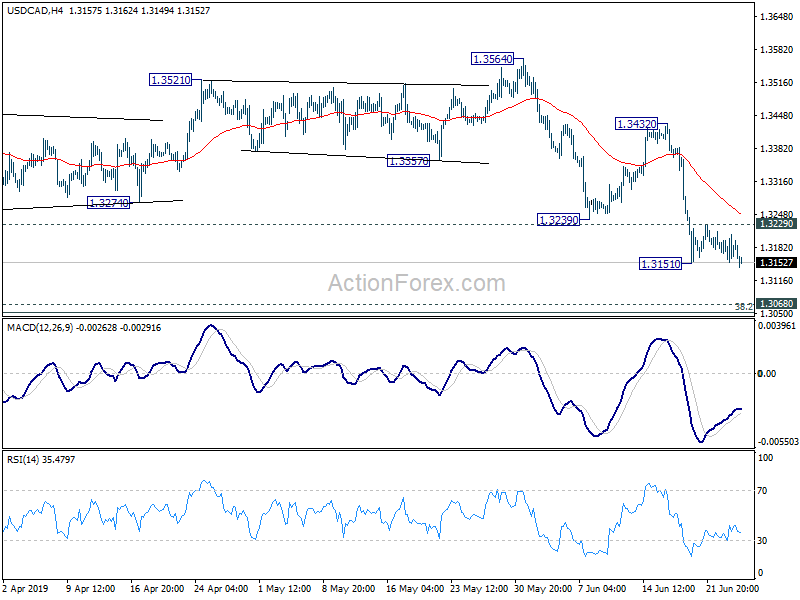
Daily Pivots: (S1) 1.3166; (P) 1.3191; (R1) 1.3206; More...
USD/CAD's break of 1.3151 suggests resumption of fall from 1.3564. Intraday bias is back on the downside for 1.3052/68 cluster support. On the upside, however, break of 1.3229 resistance will indicate short term bottoming and bring stronger rebound.
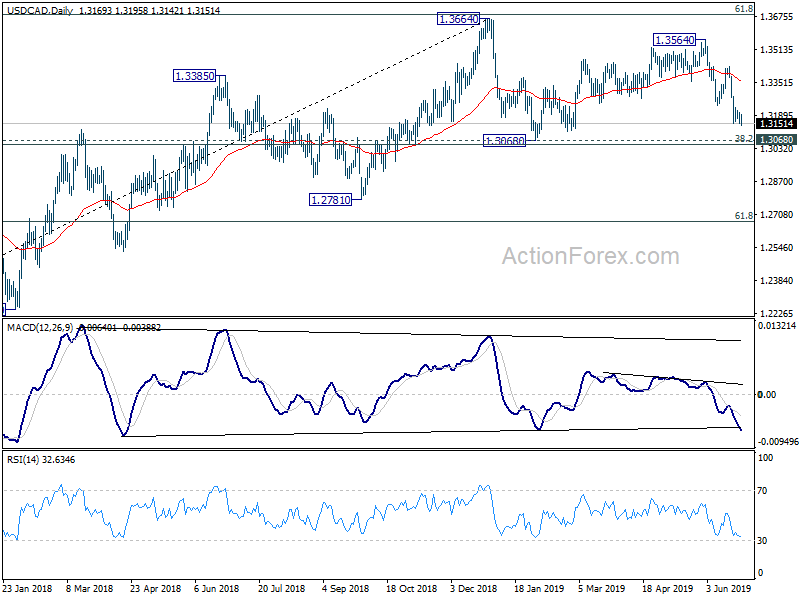
In the bigger picture, medium term outlook stays neutral for now even though the case of bearish reversal is building up. Decisive break of 1.3068 cluster support (38.2% retracement of 1.2061 to 1.3664 at 1.3052) will confirm completion of up trend from 1.2061 (2017 low). Further fall should be seen to 61.8% retracement at 1.2673 next. On the upside, sustained break of 61.8% retracement of 1.4689 (2016 high) to 1.2061 at 1.3685, is needed to confirm resumption of up trend from 1.2061 (2017 low). Otherwise, risk will stay on the downside.
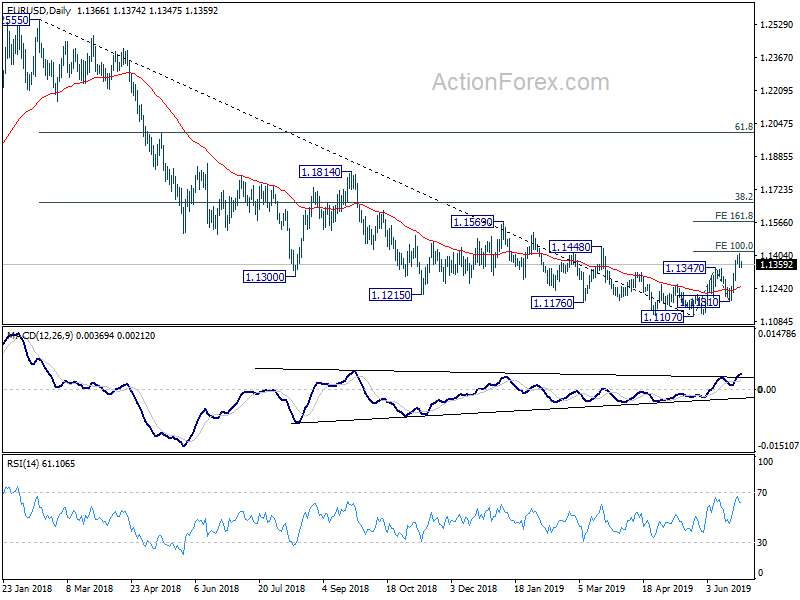
EUR/USD Mid-Day Outlook
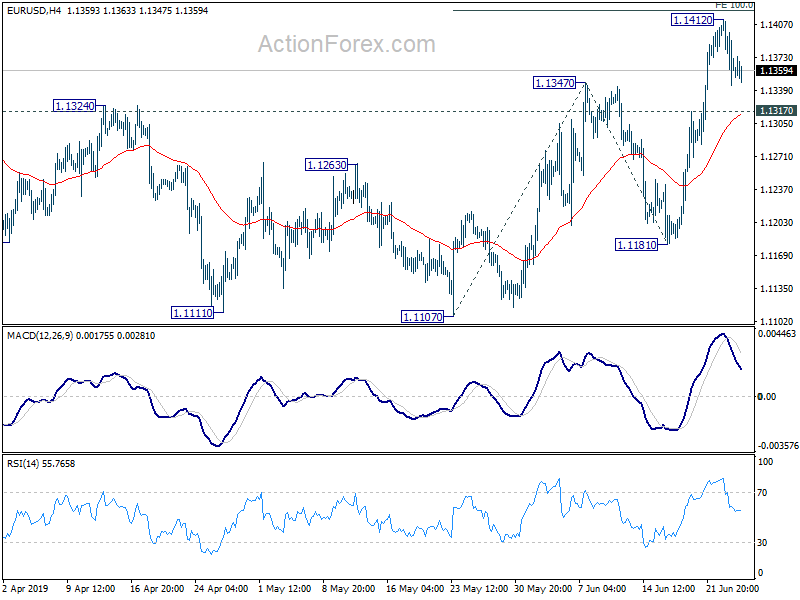
Daily Pivots: (S1) 1.1337; (P) 1.1375; (R1) 1.1405; More......
Intraday bias in EUR/USD remains neutral for the moment. With 1.1317 minor support intact, another rise remains in favor. On the upside, break of 100% projection of 1.1107 to 1.1347 from 1.1181 at 1.1142 will pave the way to 161.8% projection at 1.1569 next. However, firm break of 1.1317 will be an early sign of completion of rise from 1.1107. Intraday bias will be turned back to the downside for 1.1181 support instead.
In the bigger picture, considering bullish convergence condition in daily and weekly MACD, a medium term bottom should be in place at 1.1107 after hitting 61.8% retracement of 1.0339 (2016 low) to 1.2555 (2018 high) at 1.1186. Further rise should be seen to 38.2% retracement of 1.2555 to 1.1107 at 1.1660. Reactions from there could indicate whether rebound from 1.1107 is a corrective rise or reversing medium term trend.
GBP/USD Mid-Day Outlook
Daily Pivots: (S1) 1.2645; (P) 1.2715; (R1) 1.2757; More....
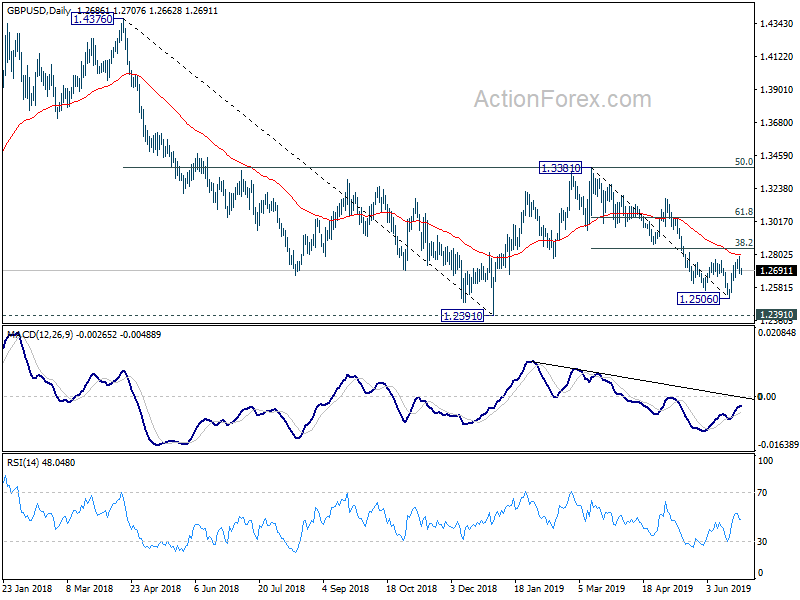
No change in GBP/USD's outlook and intraday bias remains neutral first. Corrective rebound from 1.2506 could still extend. But upside should be limited by 38.2% retracement of 1.3381 to 1.2506 at 1.2840. On the downside, break of 1.2642 minor support will turn intraday bias back to retest 1.2506 low. However, sustained break of 1.2840 will bring stronger rise to 61.8% retracement at 1.3047 next.
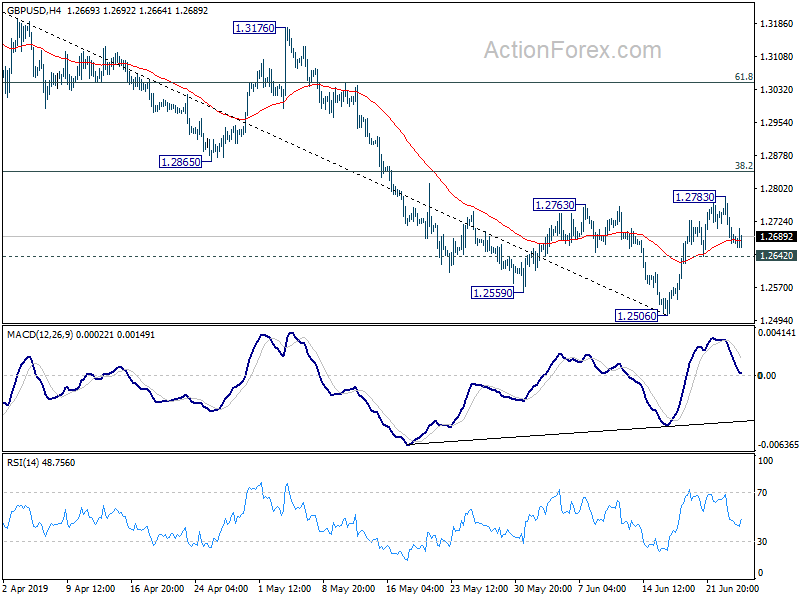
In the bigger picture, down trend from 1.4376 (2018 high) is still in progress. Break of 1.2391 would target a test on 1.1946 long term bottom (2016 low). For now, we don't expect a firm break there yet. Hence, focus will be on bottoming signal as it approaches 1.1946. In any case, medium term outlook will stay bearish as long as 1.3381 resistance holds, in case of strong rebound.