

Sample Category Title
Crude Oil: Oil Trading On A Negative Footing This Morning
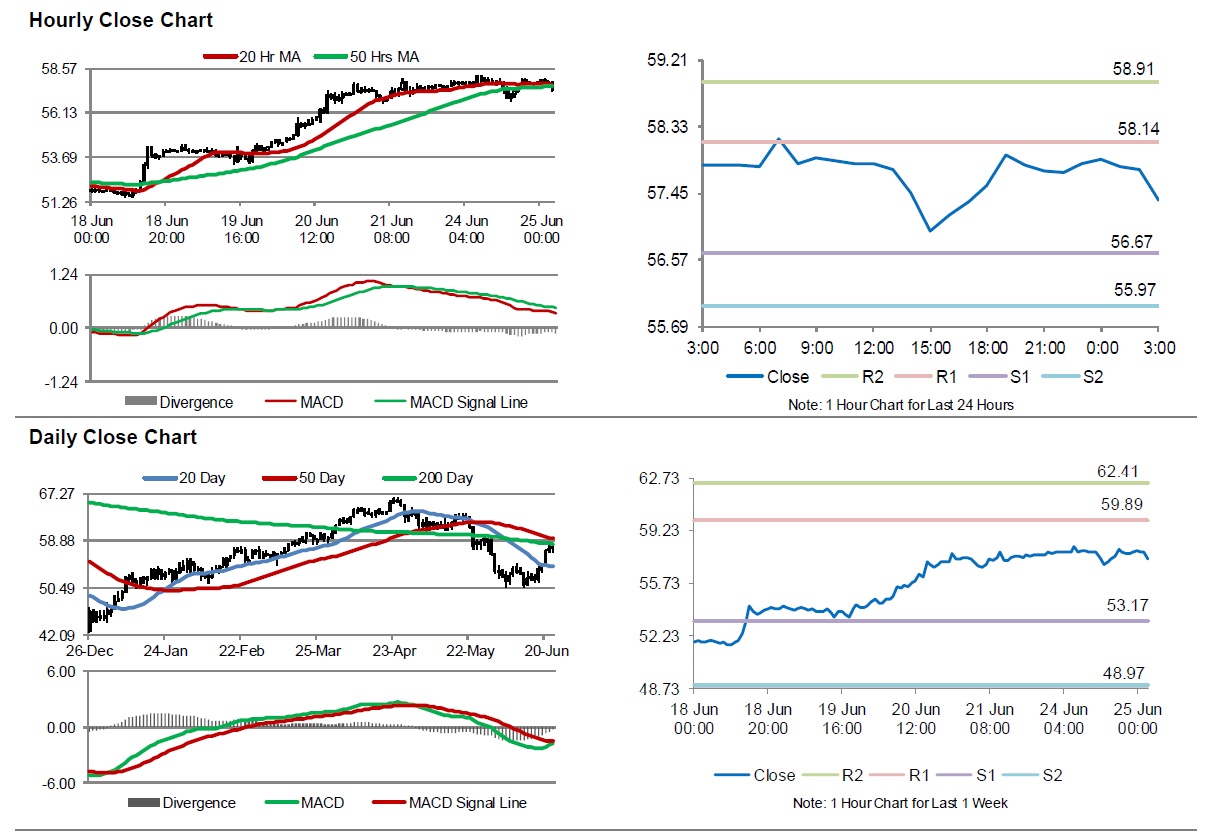
For the 24 hours to 23:00 GMT, Crude Oil slightly rose against the USD and closed at USD57.83 per barrel, on the back of rising US-Iran tensions.
In the Asian session, at GMT0300, the pair is trading at 57.36, with oil trading 0.81% lower against the USD from yesterday’s close, on demand concerns.
The pair is expected to find support at 56.67, and a fall through could take it to the next support level of 55.97. The pair is expected to find its first resistance at 58.14, and a rise through could take it to the next resistance level of 58.91.
Crude oil is showing convergence with its 20 Hr and 50 Hr moving averages.
GBP/USD Completing Wave-A At 38.2% Fib Near 1.2750
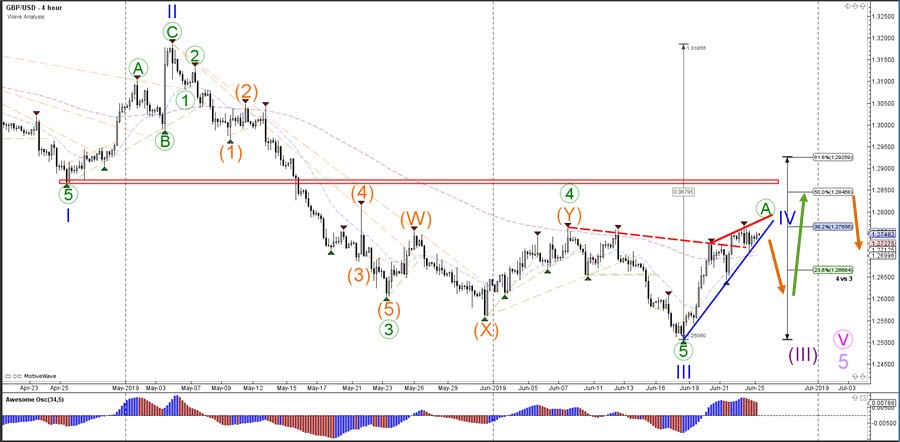
The GBP/USD is likely to make a bearish bounce at the 38.% Fib resistance zone. But the bearish reaction is expected to be mild and not make a new lower low. Instead the current wave outlook suggests a bullish ABC (green) pattern within wave 4 (green) with the main target at the 50% Fibonacci of wave 4 vs 3.
The GBP/USD needs to break below the support trend line (blue) if the price is going to develop a bearish ABC (orange) pattern within wave B (green). The main targets for the bearish ABC zigzag is the 50-61.8% Fibonacci support zone, which could be a bouncing spot for a move up towards 1.2850. An immediate bullish break could indicate a continuation of wave A (green).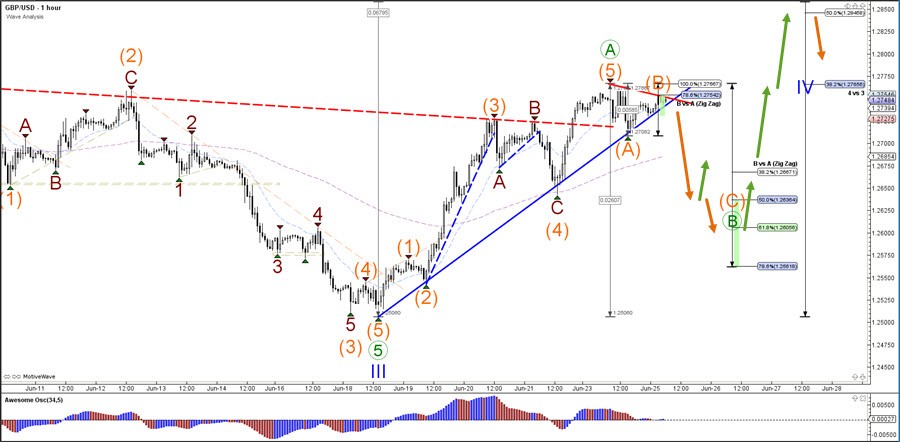
BoJ April Minutes: Clarifications on forward guidance added to strengthen public confidence on persistent easing stance
The Minutes of April 24-25 BoJ meeting showed that some members suggested clarifications on the forward guidance, "with the aim of strengthening public confidence in its monetary easing stance". That came as "many members" recognized the "high uncertainties" regarding economic outlook and prices. And, it was likely to "still take time to achieve 2 percent inflation".
In the statement after that meeting, BoJ added: "The Bank intends to maintain the current extremely low levels of short- and long-term interest rates for an extended period of time, at least through around spring 2020, taking into account uncertainties regarding economic activity and prices including developments in overseas economies and the effects of the scheduled consumption tax hike."
One member said "at least through around spring 2020" as providing a specific time frame with open-ended elements. Some members also noted that clarifying the meaning of "for an extended period of time" implied a fairly long period of time was necessary.
Oil Elliott Wave View: Impulsive Rally In Progress
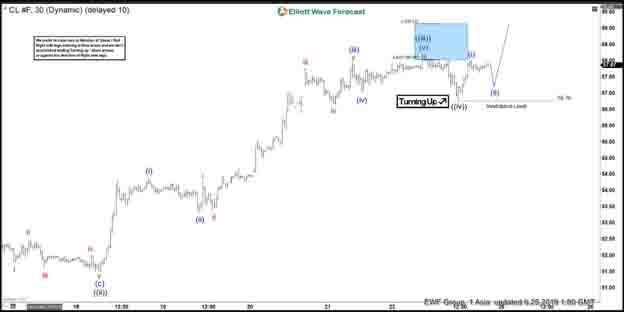
Oil (CL_F) rally from June 5, 2019 low is unfolding as an impulse Elliott Wave structure where wave 3 is currently in progress. In the chart below, we can see wave ((ii)) of 3 ended at 51.5, wave ((iii)) of 3 ended at 58.22, and wave ((iv)) of 3 ended at 56.76. Wave ((iii)) shows an extension which is typical in an impulsive structure. The internal of wave ((iii)) unfolded as an impulse of lesser degree. Up from 51.5, wave (i) ended at 54.38, wave (ii) ended at 53.28, wave (iii) ended at 57.98, wave (iv) ended at 57.04, and wave (v) ended at 58.22.
Near term, while pullback stays above wave ((iv)) at 56.76, expect CL_F to extend higher. However, a break above wave ((iii)) at 58.22 is still required to avoid a double correction in wave ((iv)). If Oil breaks below 56.76 instead, then it is doing a double correction and should find the next support at 55.7 – 56.6 for further upside or 3 waves bounce at least. We don’t like selling Oil and expect dips to continue finding support in 3, 7, or 11 swing for further upside.
Oil (CL_F) 1 Hour Elliott Wave Chart
Chinese Liu had phone call with Lighthizer & Mnuchin, agreed to maintain communications
The Chinese Ministry of Commerce confirmed that Vice Premier Liu He had a phone call with US Trade Representative Robert Lighthizer and Treasury Secretary Steven Mnuchin on Monday. During the call, both sides exchanged opinions on trade and agreed to maintain communications. Works are believed to be carried out ahead of the meeting between Trump and Xi on the second day of the June 28-29 G20 summit in Osaka, Japan. For now, there is no indications on how the two sides could close the wide gap in their bottom lines.
Reuters reported, citing an unnamed US senior officials that "it's really just an opportunity for the president to maintain his engagement as he has very closely with his Chinese counterpart.". And, Trump is "quite comfortable with any outcome." Another unnamed official said "the president has been quite clear that he needs to see structural real reform in China across a number of issues and a number of sectors, and nothing about that has changed." And, "the fact that talks broke down in May hasn't changed that as the ultimate goal".
Separately, Japanese Economy Minister Toshimitsu Motegi said he'll meet Lighthizer this week. He'd announce details including the date and location of the talks once they were set.
Gold surges as Trump puts sanctions on Iranian supreme leader and officials
Trump signed an executive order imposing sanctions on Iranian Supreme Leader Ayatollah Ali Khamenei and other top Iranian officials. He condemned Khamenei as "the hostile conduct of the regime" in the Middle East.
The sanctions will "deny the Supreme Leader and the Supreme Leader's office, and those closely affiliated with him and the office, access to key financial resources and support." They could lock up billions of dollars more in Iranian assets. They were in part a response to downing of a US drone by Iran last week.
Iranian Foreign Ministry responded: "Imposing useless sanctions on Iran's Supreme Leader Khamenei and the commander of Iran's diplomacy is the permanent closure of the path of diplomacy. Trump's desperate administration is destroying the established international mechanisms for maintaining world peace and security."
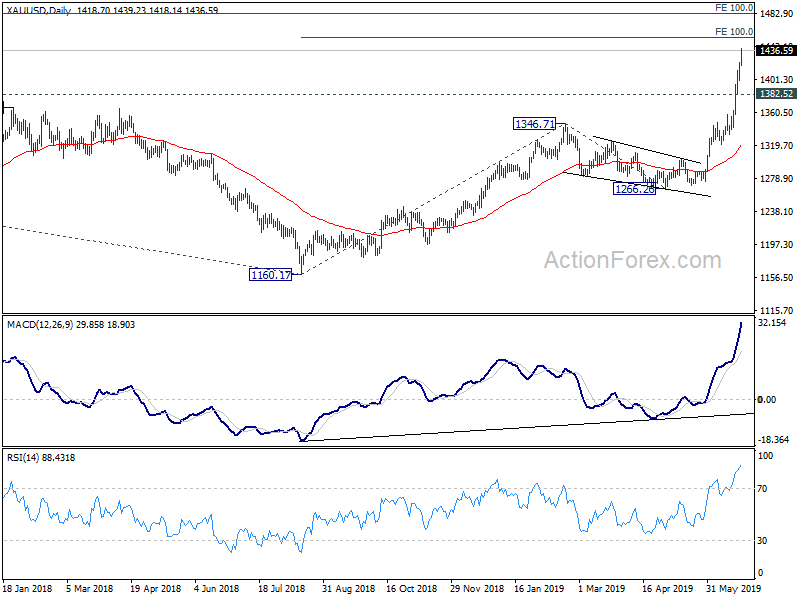
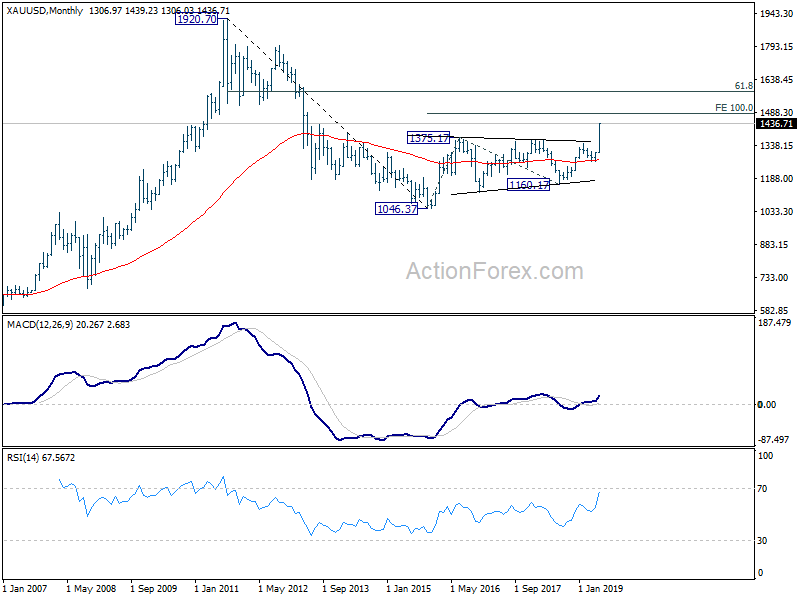
Gold surges to as high as 1439.23 so far on escalating geopolitical tensions. 100% projection of 1160.17 to 1346.71 from 1266.26 at 1452.80 is now within reach. But the key level is 100% projection of 1046.37 to 1375.17 from 1160.17 at 1488.97. Decisive break will add to the case that current long term rise from 1046.37 (2015 low) is an impulsive move, rather than a corrective move. In that case, gold is likely just in the middle of an up trend, rather than the end of it.
Market Morning Briefing: Dollar-Yen Is Almost Stable
STOCKS
Market seems to be turning cautious ahead of the US-China meeting this weekend coupled with the ongoing political tensions between the US and Iran. The rally in the equities have paused. Dow, DAX and Shanghai can see intermediate dips before their overall upmove resumes. India's Sensex and Nifty remains mixed within their sideways range in the near term. But the broader bias is bearish for them to break the range on the downside and fall in the coming days.
Dow (26727.54, +8.41, +0.03%) is not gaining strength to rise past the resistance at 26900 immediately. While below 26800 an intermediate dip to 26600 and 26450 is possoble in the coming days before the uptrend resumes targeting 27200 and 27500.
DAX (12274.57, -65.35, -0.53%) has declined below the 12300-12285 support zone which we had expected to hold. The index can test 12200-12170 on the downside now and then can reverse higher again towards 12400-12500. The broader bullish view is still intact to see 12600-12800 on the upside.
The support at 21190 mentioned yesterday is holding well on Nikkei (21235.08, -50.91, -0.24%) as of now. But Nikkei has to surpass 21350 decisively to bring back the bullish momentum. While below 21350, a fall to 21000 cannot be ruled out in the coming days.
Shanghai (2983.32, -24.83, -0.83%) seems to lack strong follow-through buyers above 3000. A corrective fall to 2950 can be seen now after which the uptrend can resume towards 3000 again.
Sensex (39122.96, -71.53, -0.18%) is holding above 39000. While above 39000 it can remain stuck in between 39000 and 39650 in the near term. But the bias is bearish for it break 39000 and fall to 38500. Also while below 39,500 Sensex can test 38000 on the downside in the coming weeks.
Nifty (11699.65, -24.45, -0.21%) looks relatively weaker than Sensex and can fall to 11600 in the near-term. An eventual break below 11600 can drag it to 11500 and 11450. Resistance is in the 11800-11850 region.
COMMODITIES
Commodities are trading higher. While the commodities look bullish in the near term, they could be heading towards important resistances in the near term. Oil prices may test immediate resistances and probably stabilize a bit before the OPEC+ meet due early next week. The EIA weekly US Crude inventory data is to be released tomorrow and is expected to decrease by -1.077mln barrels which could push Crude prices higher in the next couple of sessions.
Gold (1429.60) has risen sharply. Note that the break above 1360/80 has been crucial indicator of medium term bullishness for Gold prices and while it sustains above 1400, gold could target 1500 on the upside. View is bullish for the rest of the sessions this week.
Silver (15.48) has risen and could head towards resistance near 15.60/65 mentioned yesterday from where a short corrective dip is possible. Near term view is bullish for silver.
Copper (2.7165) has risen sharply and could test resistance near 2.75/80 in the near term from where a small dip looks likely. While the longer term trend is bullish, we may face short rejection from 2.75/80 in the near term.
Brent (64.92) has dipped after testing 65.76 yesterday. 64 is an important support on the downside and while the price holds above 64, there is room on the upside towards 67 to fill in the gap that was made on 32st May when Brent opened with a gap down.
Nymex WTI (57.72) has daily resistance at 60 which is likely to be tested in the next couple of sessions followed by a dip from there.
FOREX
Continued Dollar weakness has boosted major currencies to rise sharply. Euro looks bullish towards 1.15 while Dollar Yen is holding above support at 107. Pound, Aussie and Rupee could strengthen a bit from current levels.
Dollar Index (95.94) is sharply down and while below 96, the index could break below immediate support at 95.78 and head lower targeting 94.60 on the downside. Near term is bearish while below 96.0-95.75.
Euro (1.1402) has been dragged higher in line with our expectation in spite of lesser than expected German IFO data yesterday. A break above 1.1350 has triggered buying for the currency and bias for the near term is tilted to the upside. While the rise continues, Euro could head towards 1.15 in the near term.
Dollar-Yen (107.07) is almost stable. The weakness in Dollar has not pulled down Dollar-Yen below 107. But if Nikkei moves lower and the dollar continues to weaken, Dollar-Yen would be forced to fall below crucial support at 107. Note that below 107, important support zone of 105.50-106.00 would come into the picture. For now, we may expect 107 to hold.
Euro-Yen (122.05) is trading at daily resistance and could move up gradually towards 123-124 in the medium term. Overall view is bullish. Any rejection from 122.50 could be limited to 121.
Aussie (0.6956) has moved up but could face resistance above current levels from where a dip back towards 0.69 is possible. A sustained break above 0.6970 could take it higher towards 0.70. Overall Aussie could come down after a few sessions of upmove.
Pound (1.2745) is also trading higher. Pound looks bullish for the near term towards 1.28 or higher.
USDCNY (6.8803) has come down and could test support at 6.85/80 as seen on the 3-day candles before again bouncing back to test higher levels of 2.90.
USDINR (69.36) closed lower yesterday and has scope of testing 69.25/20 on the downside before bouncing back from there. Broad range is likely to remain between 69.20-69.75 for the near term.
INTEREST RATES
The ongoing political tensions between the US and Iran and the upcoming meeting between the US and Chinese Presidents this weekend are keeping the market cautious. As such the bonds trade higher. The yields continue to remain lower and have dipped across tenors.
The US Treasury Yields have been inching lower within their overall downtrend. The US 30Yr (2.54%), 10Yr (2.02%), 5Yr (1.75%) and 2Yr (1.74%) have dipped yesterday. The near-term view is negative for the yields. While below 2.60%, the 30Yr can test 2.50% - 2.48% in the coming days. The 10Yr can test 2% and the fall can accelerate on a break below 2%.
The German 30Yr (0.26%), 10Yr (-0.31%), 5Yr (-0.65%) and 2Yr (-0.76%) have inched further lower. The German IFO data release showed a dip in the Business Expectation Index to 94.2 in June from 95.3 in the previous month indicating weakness in the sentiment and a possible slow-down in the economy. This could keep the yields lower. At the current pace of fall, the 30Yr can dip to 0.20% and the 10Yr can test -0.38% and even -0.40% in the coming weeks.
The 10Yr GOI (6.9882%) oscillated around 7% and has closed on a mixed note. The near-term outlook is mixed. As mentioned yesterday, we can see a sideways consolidation between 6.90% and 7.10% for some time before the overall downtrend resumes towards 6.80% and 6.75% in the coming weeks.
GBP/USD Eyeing Further Upsides In Near Term
Key Highlights
- The British Pound struggled again to surpass the 1.2760 resistance against the US Dollar.
- GBP/USD remains supported on dips near the 1.2680 and 1.2665 levels.
- The Chicago Fed National Activity Index in June 2019 increased from -0.48 to -0.05.
- The US Consumer Confidence in June 2019 might decrease from 134.1 to 131.2.
GBPUSD Technical Analysis
This past week, the British Pound started a solid upward move above 1.2600 against the US Dollar. The GBP/USD pair even broke the 1.2660 resistance level to move into a positive zone.
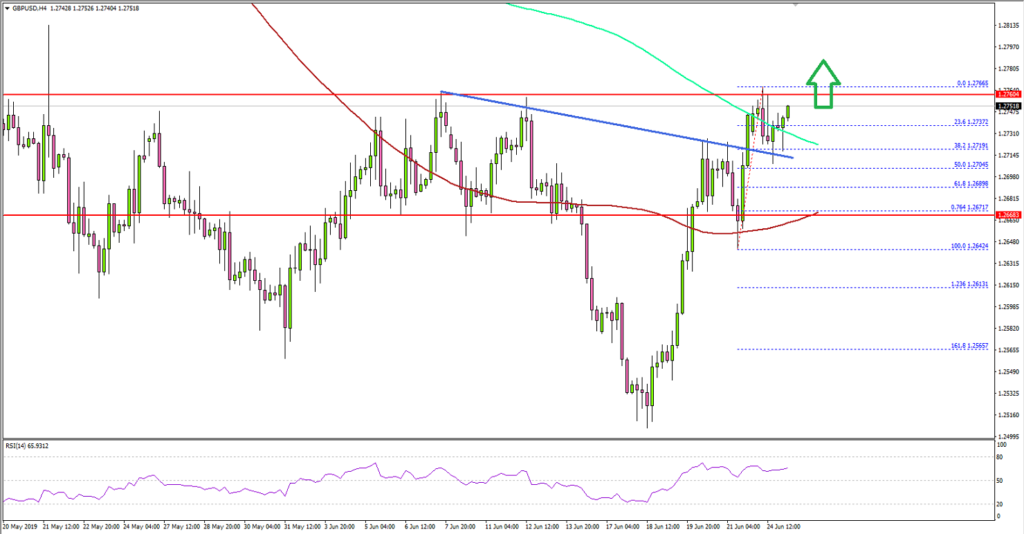
Looking at the 4-hours chart, the pair even surpassed the 1.2700 resistance and settled well above the 100 simple moving average (red, 4-hours). However, the pair ran into a crucial resistance at 1.2760, which acted as a hurdle for buyers on many occasions earlier.
A swing high was formed at 1.2766 and the pair recently corrected lower below 1.2740. It traded close to the 50% Fib retracement level of the upward move from the 1.2642 low to 1.2766 high.
If there is a break below the 1.2700 support, the pair could correct further towards the 1.2680 support. However, the main support is near the 1.2665 level and the 100 simple moving average (red, 4-hours).
As long as there is no close below 1.2660 and the 100 SMA, GBP/USD is likely to find fresh bids and it could bounce back in the near term.
On the upside, the main resistance is near the 1.2760, above which the pair could surge towards the 1.2800 or 1.2840 level.
Fundamentally, the Chicago Fed National Activity Index for June 2019 was released by the Federal Reserve Bank of Chicago. The market was looking for a minor increase from -0.45 to -0.34.
The actual result was better than the market forecast, as the Chicago Fed National Activity Index increased to -0.05. On the other hand, the last reading was revised down from -0.45 to -0.48. Therefore, the overall increase was much more than the market expected.
The report added:
Three of the four broad categories of indicators that make up the index increased from April, but only one of the four categories made a positive contribution to the index in May.
Overall, EUR/USD and GBP/USD are showing a lot of positive and any dips are likely to find buyers in the coming sessions.
Economic Releases to Watch Today
- US Housing Price Index April 2019 (MoM) – Forecast +0.2%, versus +0.1% previous.
- S&P/Case-Shiller Home Price Indices April 2019 (YoY) – Forecast +2.6%, versus +2.7% previous.
- US Consumer Confidence June 2019 – Forecast 131.2, versus 134.1 previous.
- US New Home Sales May 2019 (MoM) – Forecast -2.8% versus -6.9% previous.
Daily Markets Broadcast
Wall Street hesitates as G-20 summit looms
Most US indices rose yesterday but volumes and movements were relatively small. Trump imposed more sanctions on Iran while second-tier US data was on the soft side.
US30USD Daily Chart
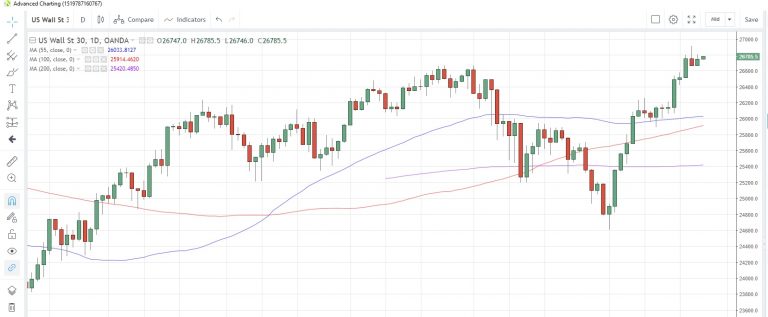
The US30 index closed higher yesterday but still below the highs of last week
The index is in consolidation ahead of the 26,940 high struck back in October last year
The Dallas Fed manufacturing business index slumped to -12.1 in June, weakest in three years. Today’s data slate includes US new home sales for May, which are seen falling 2.8% m/m.
DE30EUR Daily Chart
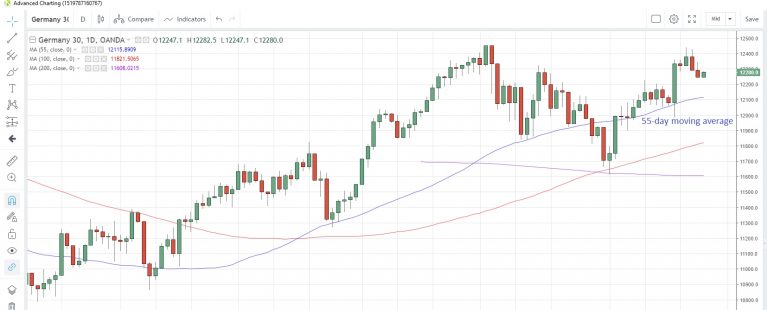
The Germany30 slid for a second consecutive session yesterday after mixed results on the IFO sentiment surveys for June
The May high of 12,452 is currently capping prices, while the 78.6% Fibonacci retracement of the May-December drop last year is at 12,581
Germany’s IFO expectations index, a more forward-looking index, fell to 94.2, missing estimates of a 94.5 print. Both business climate and current assessment indices came in above forecast. There are no major data points due today but we have speeches from ECB’s De Guindos and Coeure.
WTICOUSD Daily Chart
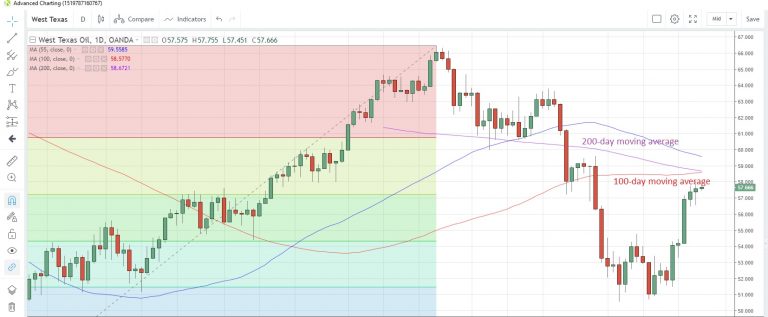
Crude oil prices extended gains yesterday as Trump imposed more sanctions on Iran
WTI prices rose to the highest since May 30 with eyes on resistance at the convergence of the 100- and 200-day moving averages at $58.58 and $58.67, respectively
Weekly crude oil stockpiles data to June 21 from the American Petroleum Institute are due today. Last week saw a drawdown of 812,000 barrels.
USD/CAD Canadian Dollar Higher On Dollar Softness
The Canadian dollar rose 0.28 percent on Monday against the US dollar. The greenback is still on the backfoot after the Fed took out the patient language from its FOMC and today President Trump criticized the missed opportunity of not cutting rates in June. The market is pricing in a July rate cut by the Fed. The rate divergence between Canadian and American rates could be narrower as the probability of a 50 basis points in the Fed funds benchmark is over 40 percent.
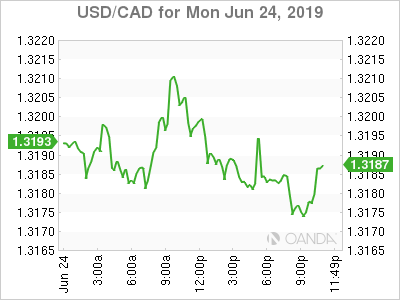
Economic indicators would validate the Bank of Canada (BoC) staying in the sidelines at the current 1.75 percent interest rate, specially if the G20 meeting between Trump and Xi at least manages not to escalate their tariff dispute.
The USMCA was a headache for the loonie last year, but the trade deal that replaces NAFTA is on its way to ratification after Mexican senate voted in an overwhelming majority for the deal. Canada and the US have begun their own ratification process, where some obstacles remain, but are expected to be surmounted if it can be implemented before the 2020 elections.
The US dollar is lower across the board against major pairs. Trade optimism ahead of the meeting between Presidents Trump and Xi as they both take part in the G20 in Japan later this week has put the dollar in the back foot. The greenback has lacked traction since the Fed dropped heavy hints that it’s ready to start a monetary policy easing cycle as soon as July.
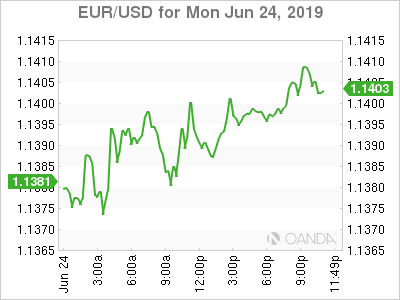
US President Trump went on twitter to criticize the Fed for not cutting in June, putting further downward pressure on the dollar. Donald Trump has been very vocal on the Fed standing on the way of economic growth and higher stock returns, but the central bank will continue e to react to indicators and if there is an improvement it could keep the benchmark rate unchanged.
Trump had a busy day as his comments also caused healthcare stocks to fall as he signed an executive order to improve and increase transparency in pricing after saying unfair pricing has made companies richer.
OIL – Oil Lower as OPEC+ and G20 Uncertainty Hit Demand Expectations
Oil dropped on Monday despite the US announcing new sanctions against Iran. The meeting between the leaders of China and the US as a sidebar of the G20 will be key for oil prices, with lots of questions likely to remain unanswered. There is a small probability of a deal being announced after the two sides were close to deal only to escalate tariffs. The two sides remain far apart and there needs to be more details in where they stand for the market to truly grasp how big the gap is.
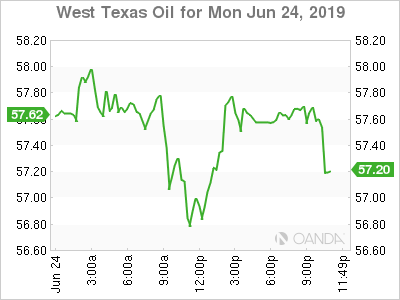
Supply disruptions have added stability, in particular the production cut agreement by the OPEC+, but as doubts rise on what the fate of the G20 meetings will have on global growth and energy demand, the deal could not get an extension. It makes sense for major producers, Russia being the most vocal, to delay their decision until they get a sense which way the US-China trade war will unfold. 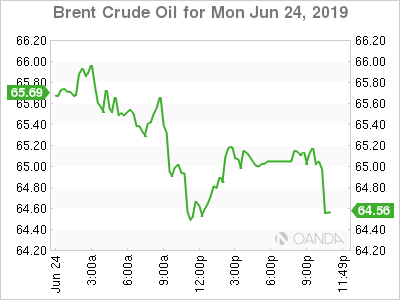
Dollar weakness and more reports about supply disruptions due to geopolitics should bring crude prices higher, with the main obstacle being an unfruitful meeting by Trump and Xi.
GOLD – Yellow Metal Retakes Safe Haven Crown
Gold rose 1.64 percent on Monday. The yellow metal is trading at $1,419 as investors reacted to the US announcing new sanctions against Iran. According to Treasury Secretary Mnuchin the sanctions were in the works even before the attack on the two tankers in the Gulf of Oman.
Gold touched a six year high as the appeal of the metal as a safe haven rose, even though the US has played down an armed response and will stick to financial sanctions.
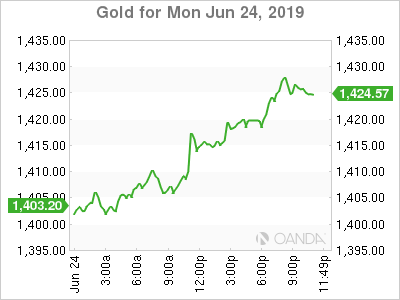
Trade optimism had taken some of the momentum off gold prices ahead of the G20, but the tension in the Middle East has boosted prices.
The dollar continues to trade weaker after the Fed has signalled that an interest rate cut is coming, benefiting gold.
The main event this week will be the sidebar meeting between Trump and Xi, which could stop the current gold rally with a productive sit down that ends up in a trade agreement. The flip side could boost gold prices even further as the Trump administration has shown that it could turn from friendly to aggressive in a heartbeat further fuelling investor’s demand for a safe haven.
STOCKS – Equities Mixed as Trump Target Healthcare Ahead of Trump-Xi Meeting
Equities were mixed at the start of the week as new Iran sanctions were announced and the White House put pressure on healthcare stocks by issuing an executive order to look into pricing in the sector. The G20 will not get going until mid-week, but the anticipation of a meeting between the leaders of China and the US is keeping markets guessing.
The prolonged trade war between the two largest economies has downgraded global growth as more barriers to trade means higher prices. Optimism remains high, but more details need to emerge before the market can fully price in how far apart the two sides really are from a deal.
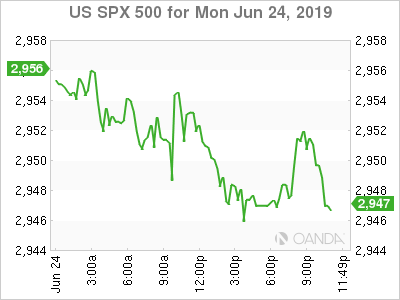
The Fed has signalled it will stay out of the way of the market, by going the full 180 degree turn and after hiking four times in 2018, it now appears ready to issue a rate cut as per the latest FOMC meeting. July has become a prime candidate with the Fed futures market pricing almost a 100 percent probability of a cut, and the debate is now entered on how deep it could be, with 57 percent probability of a 25 basis points and a 42.6 percent of a 50 basis points to leave the target rate in a 175-200 basis points range.