Sample Category Title
USDJPY Still Eyes Further Downside Pressure
USDJPY still eyes further downside pressure as expect more weakness to occur in the new week. On the upside, resistance comes in at 107.50 level. Above this level will turn attention to the 108.00 level. Further out, we expect a possible move towards the 108.50 level. A cut through here will open the door for more gain towards the 109.00. On the downside, support comes in at the 107.00 level where a break will target the 106.50 level. Below that level will turn focus to the 106.00 level and then lower towards the 105.50 level. Its daily RSI is bearish and pointing lower suggesting more decline. On the whole, USDJPY faces further downside threats in the new week.

Eco Data 6/25/19
[php_everywhere instance="1"]
GBP/CHF falls on Franc strength, to break 1.2297 support zoon
GBP/CHF is a top mover today and Sterling turns soft in early US session. Meanwhile, Swiss Franc is supported by expectations of more US sanctions on Iran.
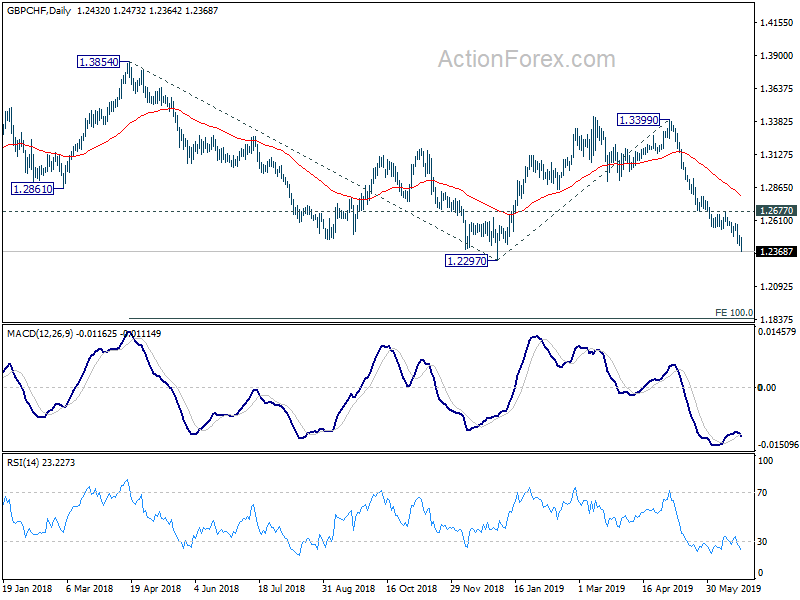
GBP/CHF extends recent decline from 1.3399 to as low as 1.2364. 1.2297 support is next and we'd expect a solid break there to resume whole fall from 1.3854. Next target will be 100% projection of 1.3854 to 1.2297 from 1.3399 at 1.1842.
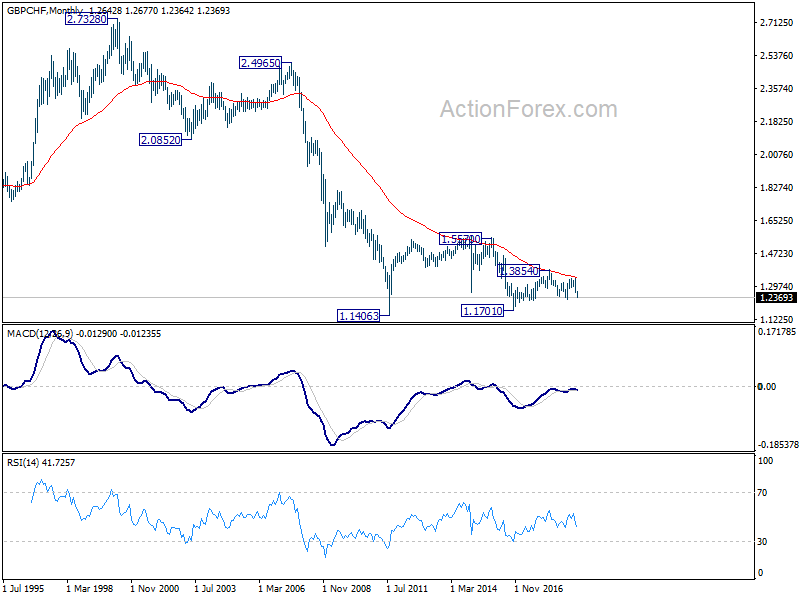
In the longer term picture, GBP/CHF remains held below 55 month EMA. And it has indeed be rejected there twice since 20184. Monthly MACD also looks like it's rejected by zero line too. Both are rather bearish developments. For now, we're favoring an eventual break of 1.1701 low at least, subject to downside momentum.
WTO: Trade flows hit by historically high new trade restrictions
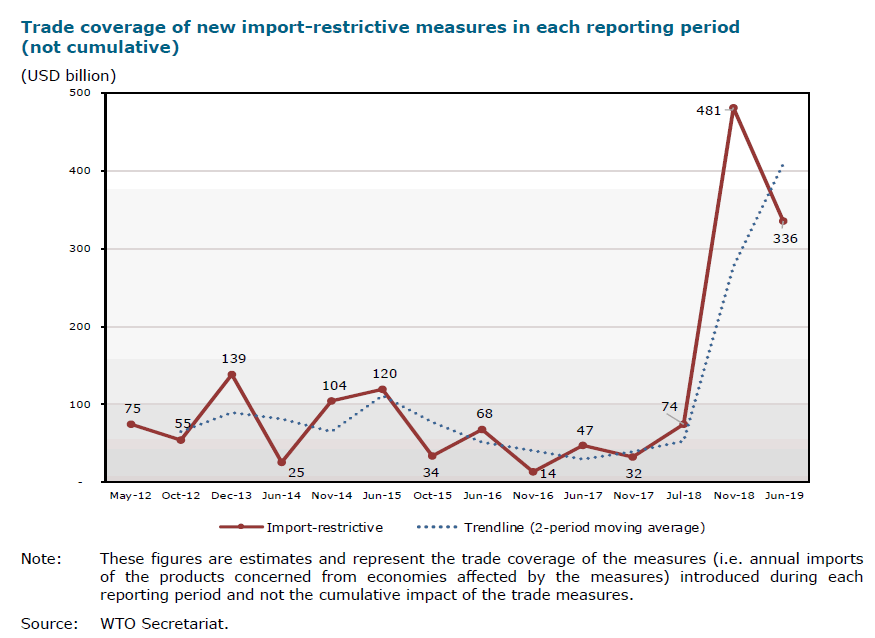
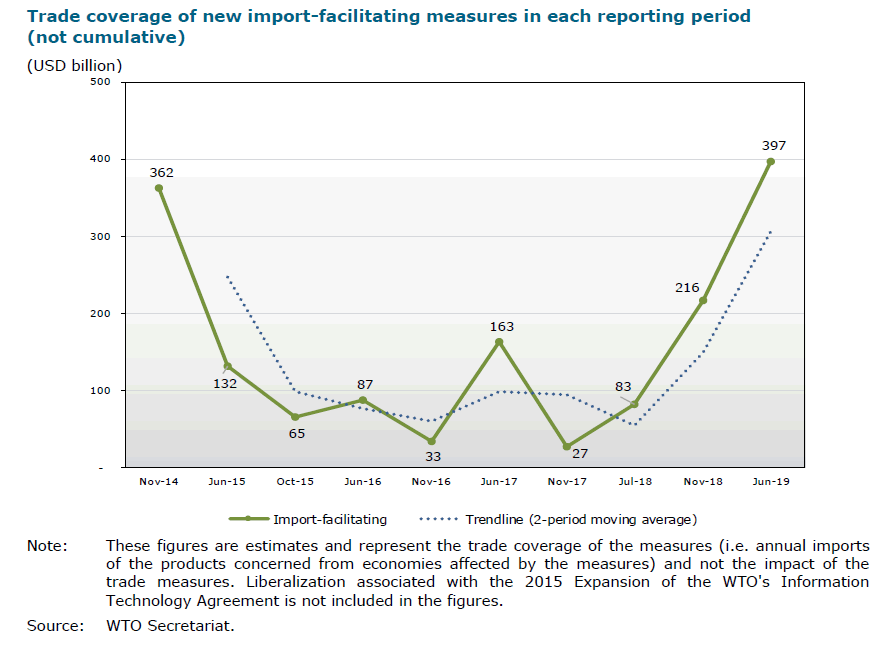
In a report published today, WTO said "turbulence in global trade continued" during the period from October 2018 to May 2019. New import-restrictive measures introduced by G20 economies during this period was more than 3.5 times the average since May 2012. Total import-restrictive measures stood at USD 335.9B, second highest on record, just after USD 480.9B reported in the previous period. Most importantly, together these two periods represent a "dramatic spike" in the trade coverage of import-restrictive measures.
Commenting on the report, Director-General Roberto Azevêdo said: "This report provides further evidence that the turbulence generated by current trade tensions is continuing, with trade flows being hit by new trade restrictions on a historically high level. The stable trend that we saw for almost a decade since the financial crisis has been replaced with a steep increase in the size and scale of trade-restrictive measures over the last year. This will have consequences in increased uncertainty, lower investment and weaker trade growth.
"These findings should be of serious concern for the whole international community. We urgently need to see leadership from the G20 to ease trade tensions and follow through on their commitment to trade and to the rules-based international trading system."
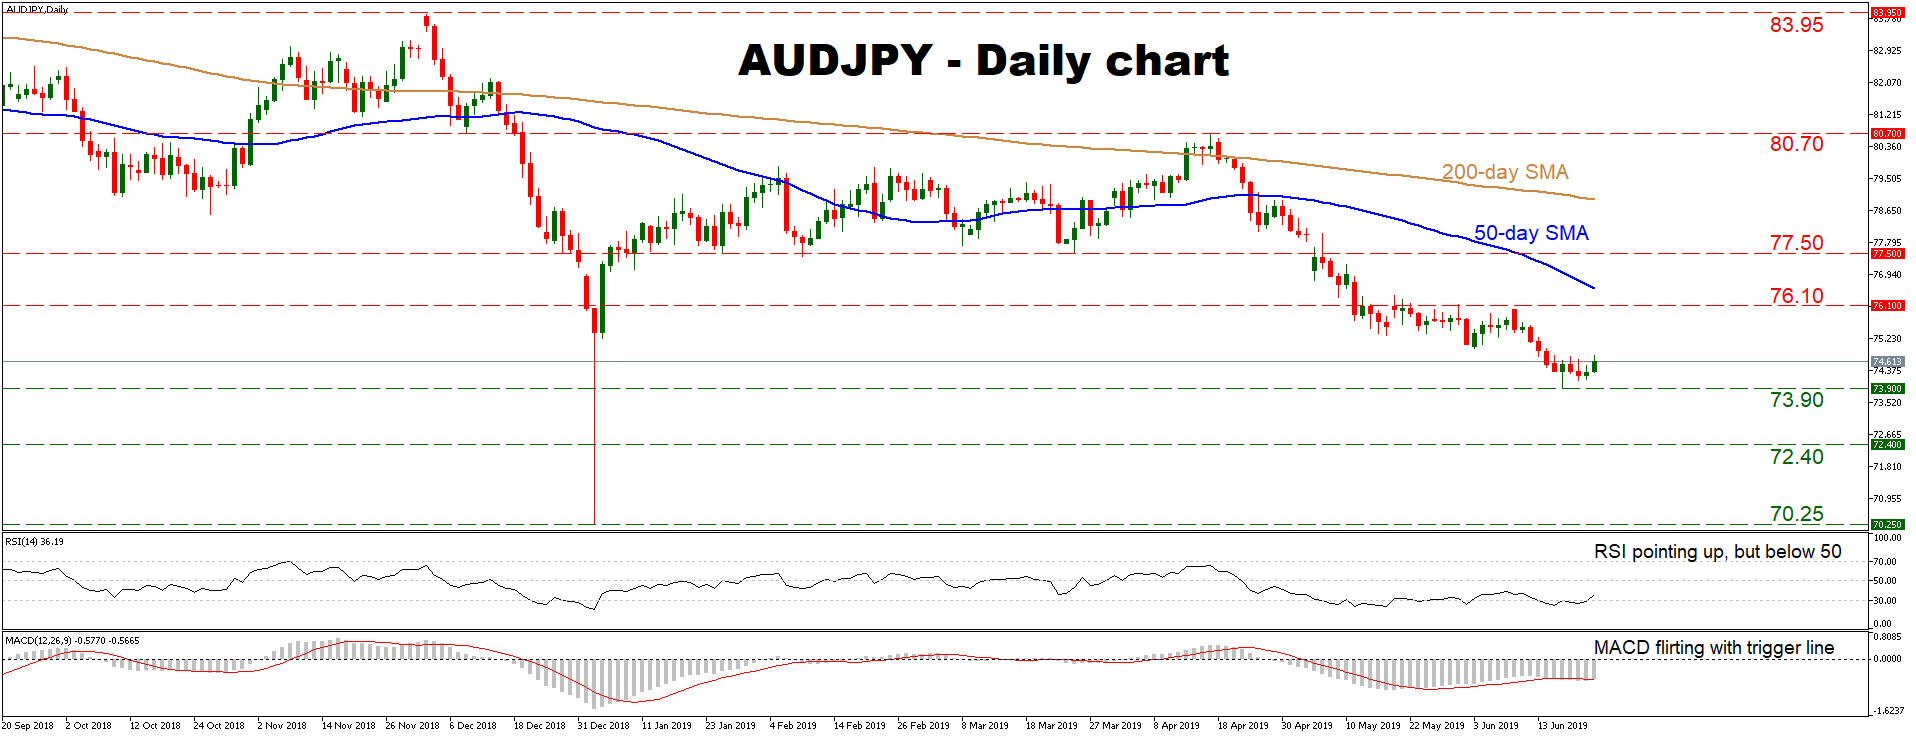
AUDJPY Stabilizes Near 6-Month Low; Outlook Still Negative
AUDJPY touched a 6-month low of 73.90 last week, with price action taking place below both the 50- and 200-day simple moving averages (SMAs). Additionally, the price structure consists of lower highs and lower lows, confirming that the broader downtrend remains intact – even if oscillators like the RSI suggest that the latest rebound may continue for now.
Another wave of selling could find initial support around 73.90, where a downside break may open the door for 72.40, this being the 2016 low.
On the flipside, a recovery in the pair may meet resistance near the June 10 high of 76.00, with a move above that barrier turning the focus to the 50-day SMA at 76.56. Even higher, the 77.50 zone would come into view.
In brief, the bigger picture is firmly negative, though the rising RSI suggests that the current correction may continue in the very short term.
Trade Tensions Turning Up on US Factory Floor
Industrial sector softness suggests US also has much to lose from trade war
US industrial output has softened this year, and the escalating trade war with China is partly to blame. Threatened additional US tariffs on Chinese products and on auto imports from Europe and Japan risk pushing the sector into full-blown slowdown mode. What's happening in the industrial sector challenges the notion that the US has less to lose in a trade war with China, but that is also why we continue to assume that tensions will ultimately ease.
The US may have as much or more to lose as China
China exports more to the US than the US exports to China—about three-times more last year (~$560 billion vs. ~$180 billion). So Chinese exporters, the thinking sometimes goes, have more to lose from the current trade dispute. But import tariffs are paid by domestic producers and consumers, not foreign exporters. So another way to look at the large trade deficit is that it allows the US to impose a larger tax on American producers and consumers. And, for the most part, US importers have not been able to find alternative sources to avoid tariffs and/or extract offsetting price concessions from foreign-country exporters.
Average tariff hikes getting bigger – and concentrated in the industrial sector
US tariff hikes last year weren't actually that big when measured against total imports. Measures last year pushed the 'average' tariff rate up by about 1 percentage point. But further tariff hikes on imports from China announced in May, with the threat of more to come if negotiations around the G-20 meetings at the end of the month don't go well, could more than double that.
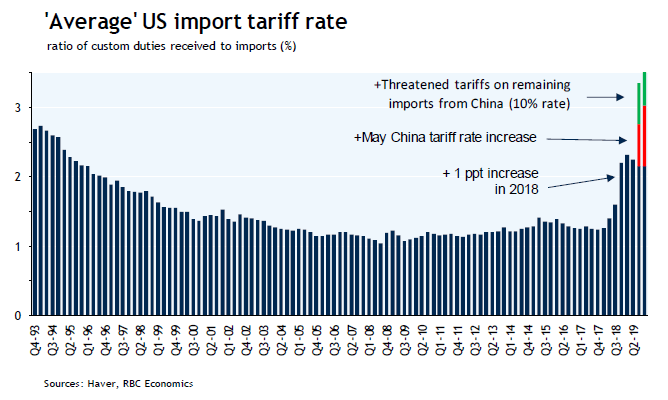
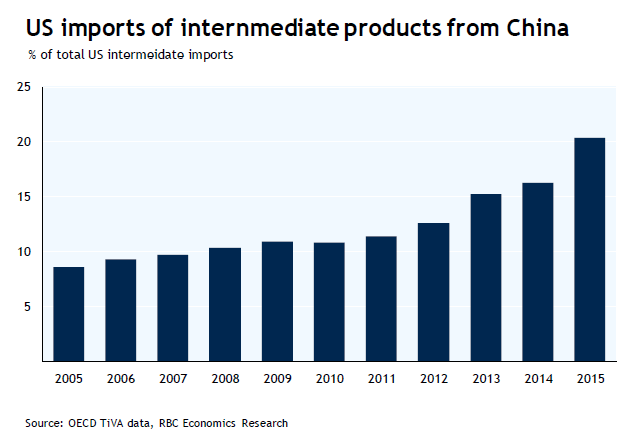
And the vast majority of those tariffs have targeted imports to the US industrial sector. In part, that's by design. The Trump administration has tried to avoid targeting products that would obviously and quickly increase prices for consumers. But China has also become an increasingly important source of imported production inputs. It accounted for ~20% of total US imports of intermediate goods as of the latest estimates from the OECD. 10 years earlier, that share was just 8½%. The remaining tranche of tariffs the US is threatening on China—covering the vast majority of total US imports—is more varied by product type but still includes a big industrial component.
Tariffs have not brought production back to the US
If the US trade actions were meant to boost manufacturing stateside, they haven't succeeded. US industrial output and capacity utilization rates have fallen since 10% tariffs were imposed on $200 billion of imports from China in late September last year. Manufacturing output has managed just one monthly increase out of five to date in 2019, and sentiment has deteriorated. The latest ISM manufacturing report was riddled with business references to a negative impact from rising tariff costs.
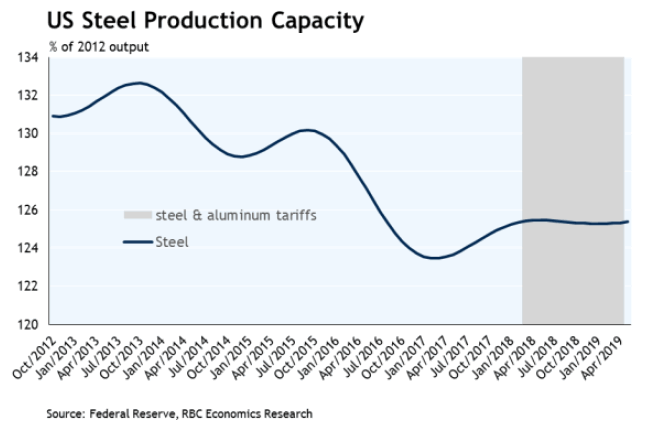
The (now-repealed) steel and aluminum tariffs that were in place most of the last year raised costs for broad swaths of the manufacturing sector that use those products as production inputs. And they did little to juice US steel and aluminum production and investment. US steel production averaged about 4% above the 6- month pre-tariff average over the period US tariffs were in place. Total steel production capacity didn't increase at all. That's not surprising: increasing production capacity requires capital investment, but companies are unlikely to undertake expensive long-run investments in response to trade disruptions that are likely to be temporary.
US businesses have struggled to find alternative imports
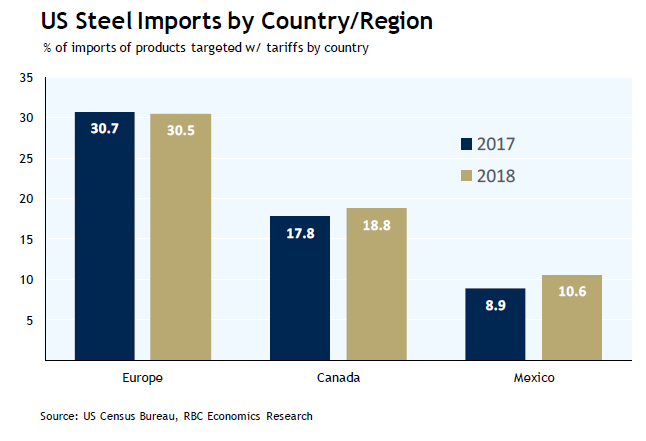
The US hasn't been particularly strategic in applying tariffs. In many cases, that has made it difficult for US industrial purchasers to find alternative sources quickly. US imports of steel products targeted with 25% tariffs last year still increased ~1½% in 2018. And the share coming from Europe, Canada, and Mexico—areas most targeted by the trade action—actually increased. Imports of products from China targeted by US tariffs last September fell by 22% from a year ago year-to-date through April. But US producers were not able to find alternative import sources. Imports of those same products from all countries declined a similar amount.
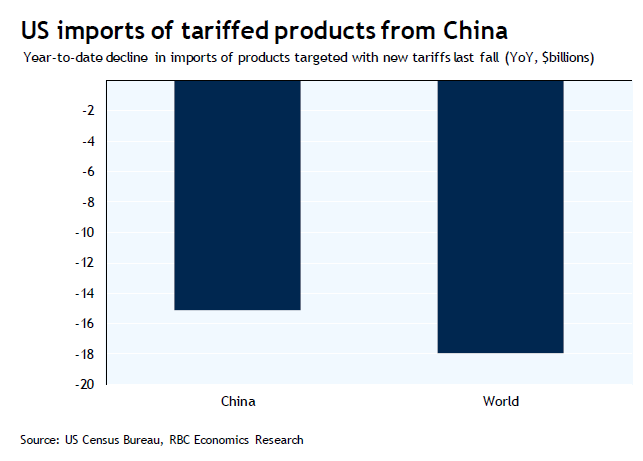
And the decline in US import values does not appear to reflect lower prices charged by Chinese exporters. US import prices from China are down only ~1% from a year ago to-date through April, and that is despite a 6% appreciation in the USD relative to Chinese RMB that one might have thought would make imports look cheaper to US buyers even without tariffs. That has broadly been a theme across US tariff actions to-date. Foreign exporters have by-and-large not been willing or able to make price concessions to offset increased US import tariff costs. That has left US importers with the unhappy decision to either import less or pay more.
Odds are still that the US blinks first
As it stands, the US industrial sector looks ill-prepared to handle further tariff hikes on Chinese products and the threat of tariffs on auto imports from Europe and Japan still looms. That still wouldn't necessarily mean an economy-wide recession. The 85% of the US economy that is not the industrial sector has shown little evidence of slowing. Labour markets still look solid and the Fed has made it clear that it will step in with rate cuts if broader growth trends soften. But escalating trade tensions have begun to threaten real job losses, and particularly in the politically important industrial heartland that was critical to President Trump's 2016 election victory. That also is one of the main reasons we still assume tensions will ultimately ease. President Trump faces re-election next year. President Xi Jinping does not.
Canada is caught in the middle
Canada is already paying an economic price for escalating US-China trade and geopolitical tensions. It's difficult to believe that the effective Chinese ban on imports of Canadian canola isn't related to the bigger powers' dispute. But Canada's direct exposure to a bilateral trade disruption with China is limited because China still only accounts for ~5% of Canadian exports.
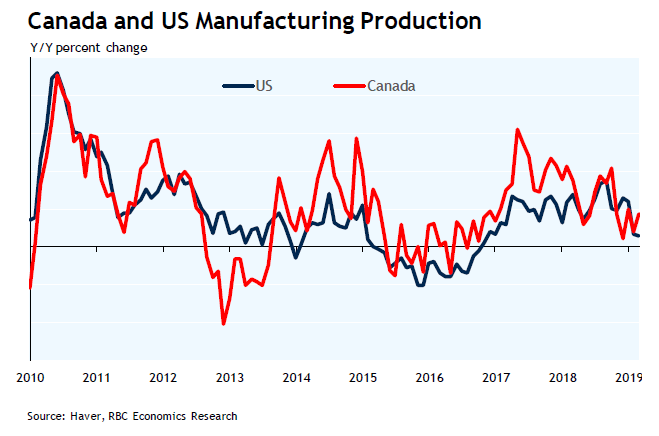
The larger Canadian vulnerability to the trade dispute is via spill-overs from any slowdown in the US industrial sector. The US still accounts for ~70% of Canada's exports, and cross-border production chains are incredibly closely integrated. Indeed, more than a quarter of the value of Canada's manufacturing exports actually reflect the cost of intermediate production inputs imported from the US. Anything that raises costs and restrains activity in the US industrial sector will have negative spill-overs to Canada.
Slower global growth would also weigh on commodity prices. And uncertainty about the trade outlook will continue to weigh on Canadian business investment, even if Canada, for now, seems to be out of the US cross-hairs. If the unexpected escalation and then easing of tensions with Mexico in recent weeks did anything, it was to reinforce the message that no trade agreement is really protection from an escalation of trade tensions with the Trump administration. That only adds to uncertainty about the future of international trade, and will continue to weigh on business investment spending in Canada and abroad.
Dollar Index Futures Scope for Further Losses but Short-term Downside Softer
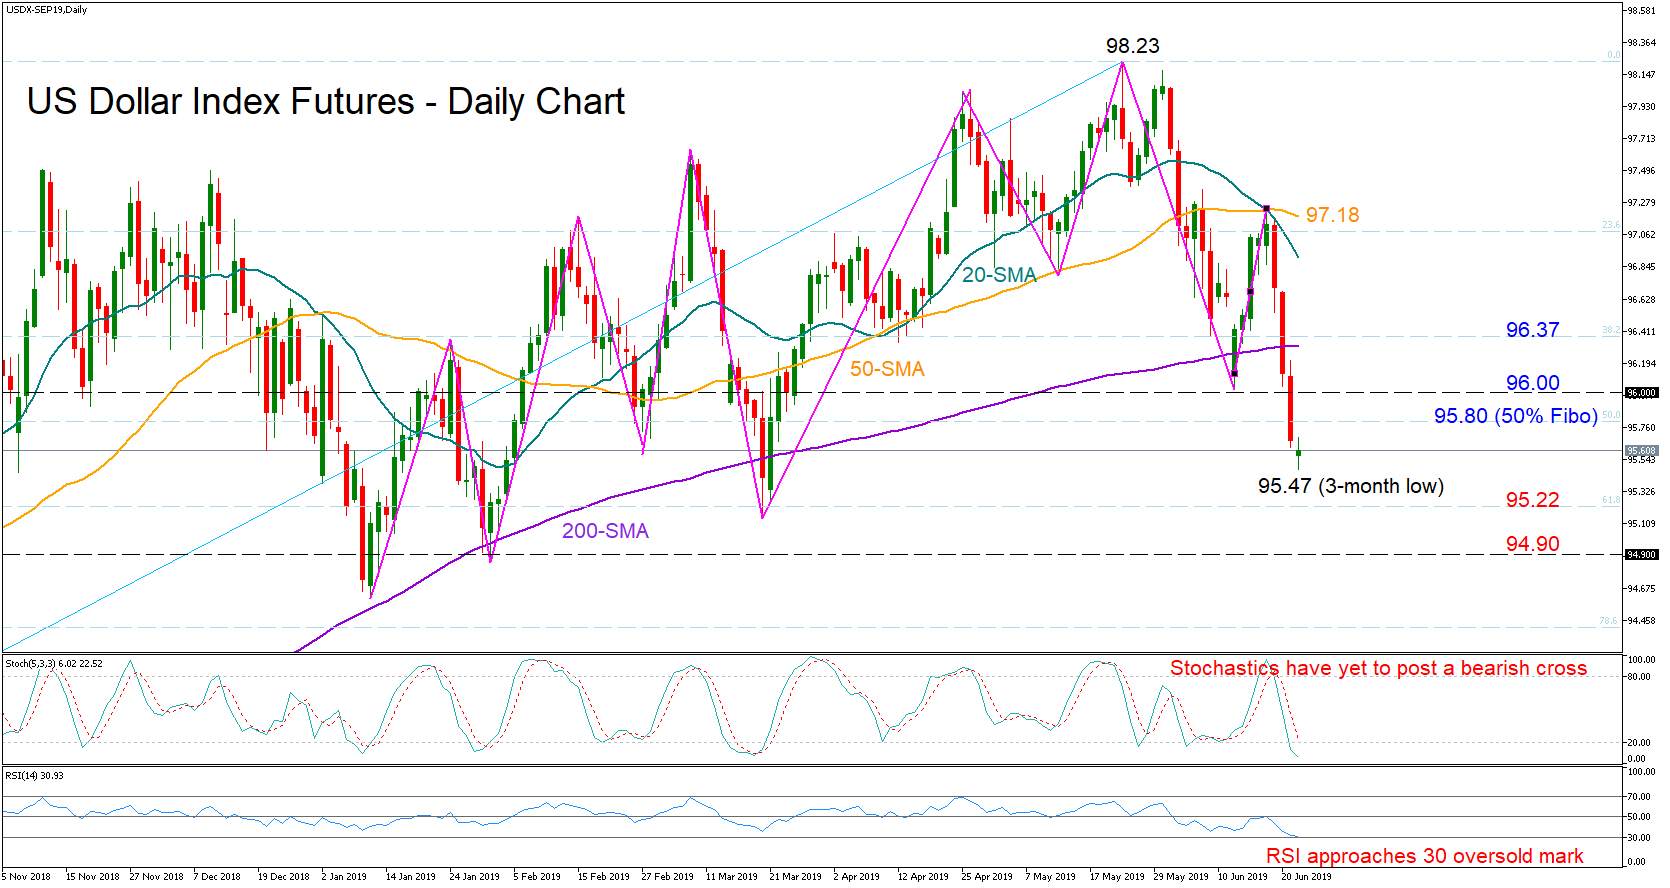
The position in the US dollar index futures is on the back foot for the fourth consecutive day and near a three-month low of 95.47 following the rejection from the 20- and the 50-day simple moving averages (SMA).
The price has so far fallen below the 200-day SMA, the previous low of 96 and the 50% Fibonacci of the 93.56-98.23 upleg, putting the January upward pattern into question.
In the short-term, downside pressure may persist but potentially at a softer pace given that Stochastics and the RSI are entering the oversold territory.
Should the market fail to clear the 95.80-96.00 area, bearish pressure may intensify, sending the price towards the 61.8% Fibonacci of 95.22. In case of a sharper decline, the 94.90 level could provide support as well, as it did in January.
A closing price above the 96 number would bring the 200-day SMA and the 38.2% Fibonacci of 96.37 into view. Nevertheless, a rally above the 50-day SMA currently at 97.18 may likely prove more valuable to the market.
In the three-month picture, the dollar index is in a range, fluctuating between 98.23 and 95.14.
Gold Trades Above $1400 Level for the First Time in Six Years
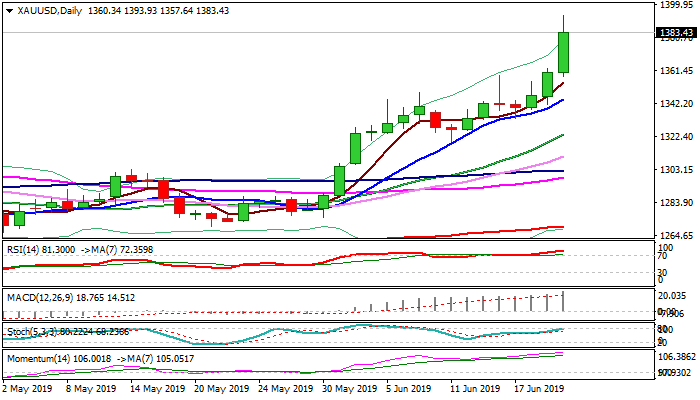
Spot gold is holding above $1400 mark on Monday, trading at the levels last visited in nearly six years.
Rising tensions between the US and Iran increased safe-haven demand, with gold price being also strongly supported by signals of Fed rate cut. The yellow metal advanced 7.7% from the beginning of month and is on track for the biggest monthly gain since June 2016.
Strong bullish signal was generated on last week's break above pivotal Fibo barrier at $1380 (38.2% of 2011/2015 $1920/$1046 fall) that opens way towards Fibo 200% projection at $1427 and $1433 (Aug 2013 high) and would expose Fibo barrier at $1483 (50% of $1920/$1046) on further bullish acceleration, if the situation escalates. Daily/weekly techs are in full bullish setup but strongly overbought that suggest corrective action in coming sessions, though without firmer signal for now.
Bulls are expected to position before resuming, with initial support at $1400 and extended dips to hold above broken Fibo barrier at $1380, to keep bulls intact.
Res: 1411; 1427; 1433; 1450
Sup: 1400; 1396; 1380; 1375
Stocks Shrug off Middle East tensions
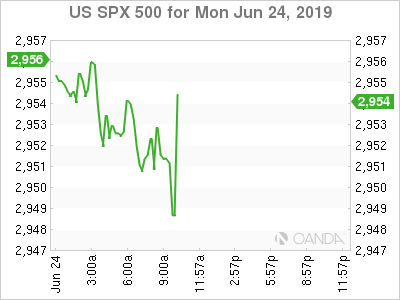
US stocks are looking to open higher despite increased tensions between US and Iran. Markets are clinging to the belief that despite all the hard talk and threats, that President Trump will not take the US to war. Iran has been very calculated with their attacks and appears they are not likely to deliver an attack that will cause the loss of US life. Trump would be forced to deliver a retaliatory strike if Iran attacked a warship or shot down a US plane, but that still seems to be a remote risk.
Today, the US is expected to announce new sanctions against Iran. President Trump tweeted on Saturday that “We are putting major additional sanctions on Iran Monday.” At the end of last week Trump called off retaliatory attack for the downing of a $130 million US drone. Trump however is willing to hold talks with Iran, so we could see the recent pattern of escalation ease up at the start of the week.
Markets will also focus on the G20 which kicks off in Osaka from June 28th-29th. Trump and Xi are expected to meet and while trade remains the markets focal point, many will look to see if the recent Hong Kong protests will become a key issue. Over the weekend, China announced a hard line that they will not allow Hong Kong to be discussed at the G20.
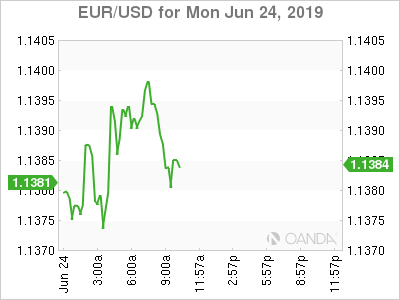
The dollar is mixed in early trade with gains against Japanese yen and British pound, while trading lower to the euro, franc, and commodity currencies.
Elliott Wave Analysis: Bears Pulverizing the USD/ZAR; Weaker Prices Ahead!
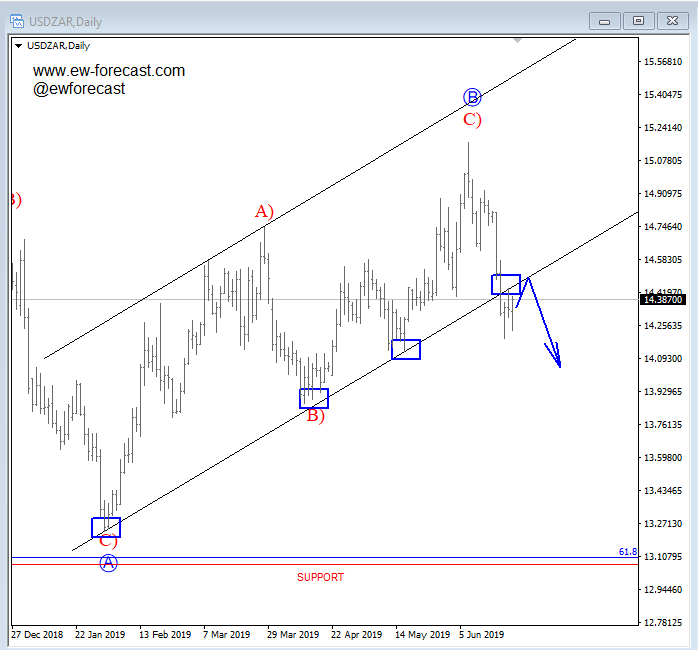
USDZAR is trading impulsively bearish. Looking at the daily chart, we can see price now breaking even the channel support line which means that there can be room for more weakness towards 13.00 strong support area.
USDZAR, Daily
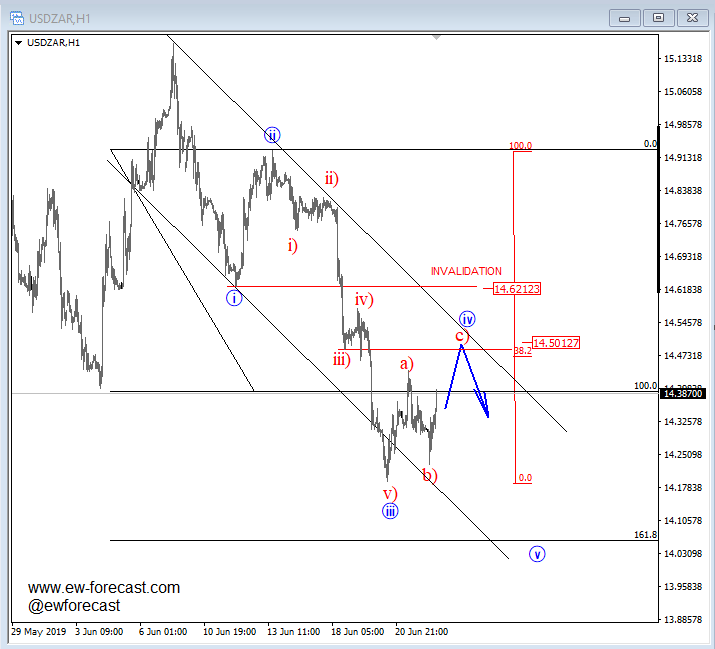
Now switching to the intraday chart, we can clearly see price unfolding five waves down from the highs, so lastest recovery can be only part of a three-wave setback, where ideal resistance would be around 14.50 area, and from where we may see a bearish continuation, however price must stay beneath 14.62 invalidation level.
USDZAR, 1h