Sample Category Title
USD/JPY Outlook: Fresh Weakness Emerges After Bulls Were Trapped Above 10SMA
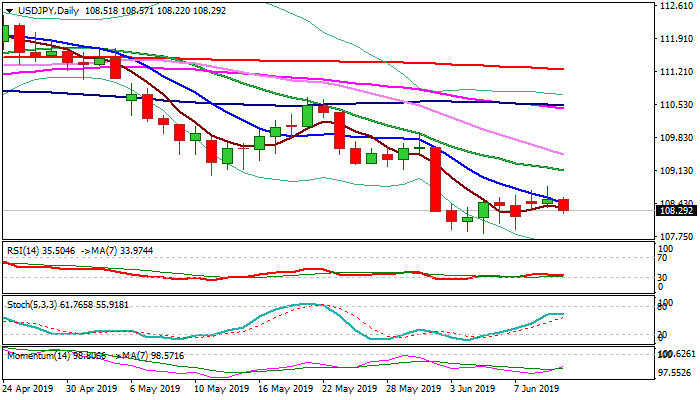
The pair dips on fresh risk-off mode on US/China trade war fears, after bulls were trapped on repeated failure above falling 10SMA. Fresh weakness marked over 50% retracement of 107.81/108.80 recovery leg and broke below 5SMA (108.35), as falling 10SMA continues to track larger bears and caps upside attempts. Daily studies remain in full bearish mode and maintain pressure, with daily close below 5SMA seen as initial negative signal, confirmation of which requires close below 108.19 (Fibo 61.8% of 107.81/108.80) to expose key support at 107.81 (5 June low). Only lift and close above falling 10SMA would sideline bears and generate initial signal of recovery extension.
Res: 108.35, 108.43, 108.80, 109.12
Sup: 108.19, 108.02, 107.81, 107.57
AUD/USD Analysis: Reveals New Channel
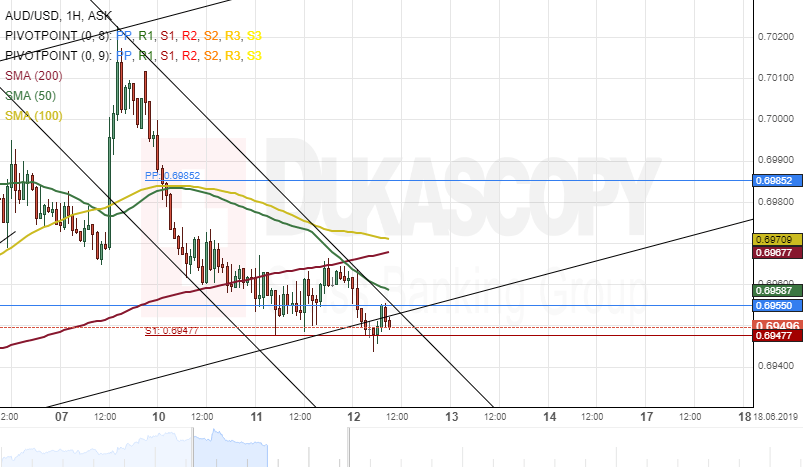
The 200-hour simple moving average provided resistance at 0.6967 for the AUS/USD currency pair during yesterday's trading session. The Aussie versus the Greenback has revealed a new junior descending channel pattern.
As for the near future, it is likely that the exchange rate will make a brief retracement towards a resistance cluster formed by the combination of the 50– and 200-hour SMAs at 0.6964 within this session.
If the resistance cluster holds, the currency exchange rate might continue its downward swing during the following trading session.
USD/CAD Analysis: Breakout Occurs
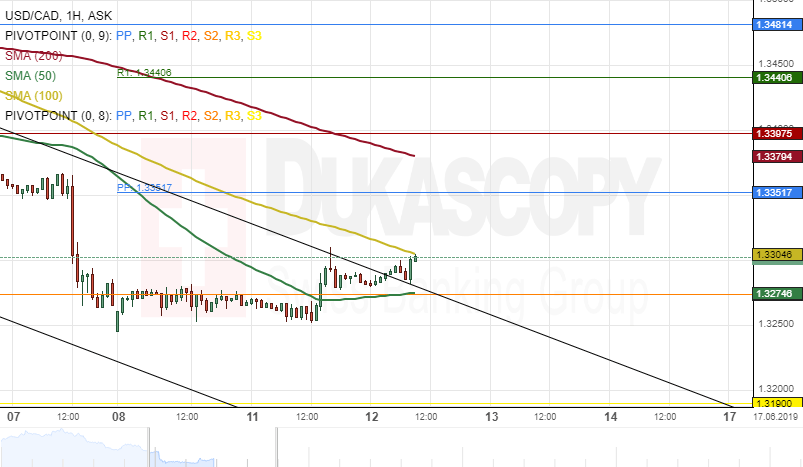
The US Dollar breached the upper boundary of a junior descending channel pattern at 1.3295 during the morning hours of Wednesday's trading session.
Given that the currency pair has passed the 50-hour simple moving average, the next target for bullish traders could be near a resistance level formed by the weekly pivot point at 1.3351.
However, a resistance line set by the 100-hour SMA at 1.3308 might restrict the currency exchange rate from hitting the given target as mentioned earlier during the following trading session.
NZD/USD Analysis: Breaches Junior Channel
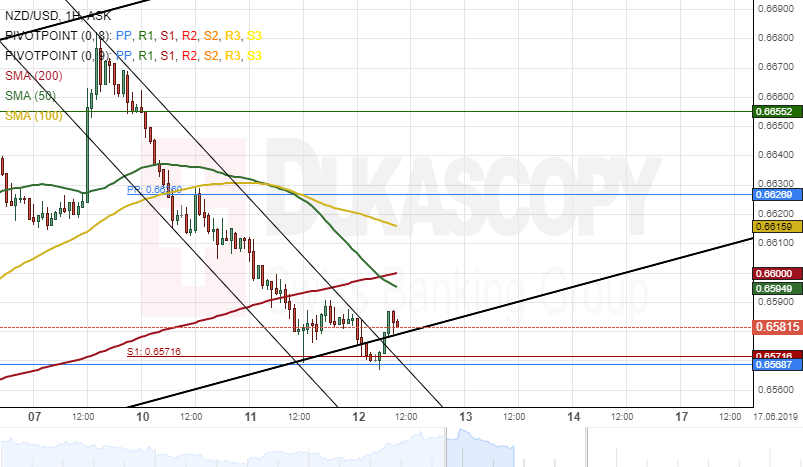
The New Zealand Dollar has continued to edge lower in a narrow descending channel pattern against the US Dollar. The currency pair breached the upper boundary of the channel pattern at 0.6576 during the morning hours of Wednesday's trading session.
Given that a breakout had occurred, it is likely that the NZD/USD exchange rate will aim for a resistance level formed by the 100-hour simple moving average at 0.6616 during the following trading session.
However, technical indicators suggest that the currency exchange rate will continue its downward swing today.
EUR/JPY Analysis: Breaches 50–Hour SMA
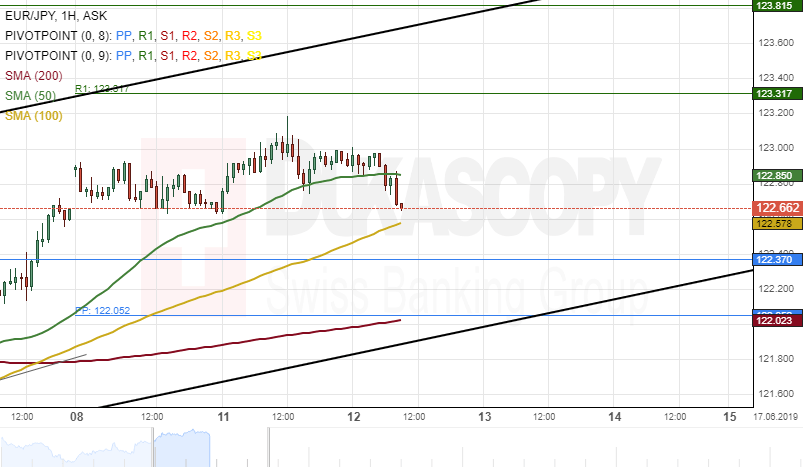
The 50-hour simple moving average guided the EUR/JPY currency pair up during yesterday's trading session.
The exchange rate breached the 50-hour SMA at 122.85 during the morning hours of today's trading session.
Given that a breakout had occurred, most likely, the common European currency could edge lower against the Japanese Yen today.
The potential downside target for bearish traders will be near a support level formed by the 100-hour SMA at 122.54 during the following trading session.
EURJPY Eases Below 3-Week High In Short Term
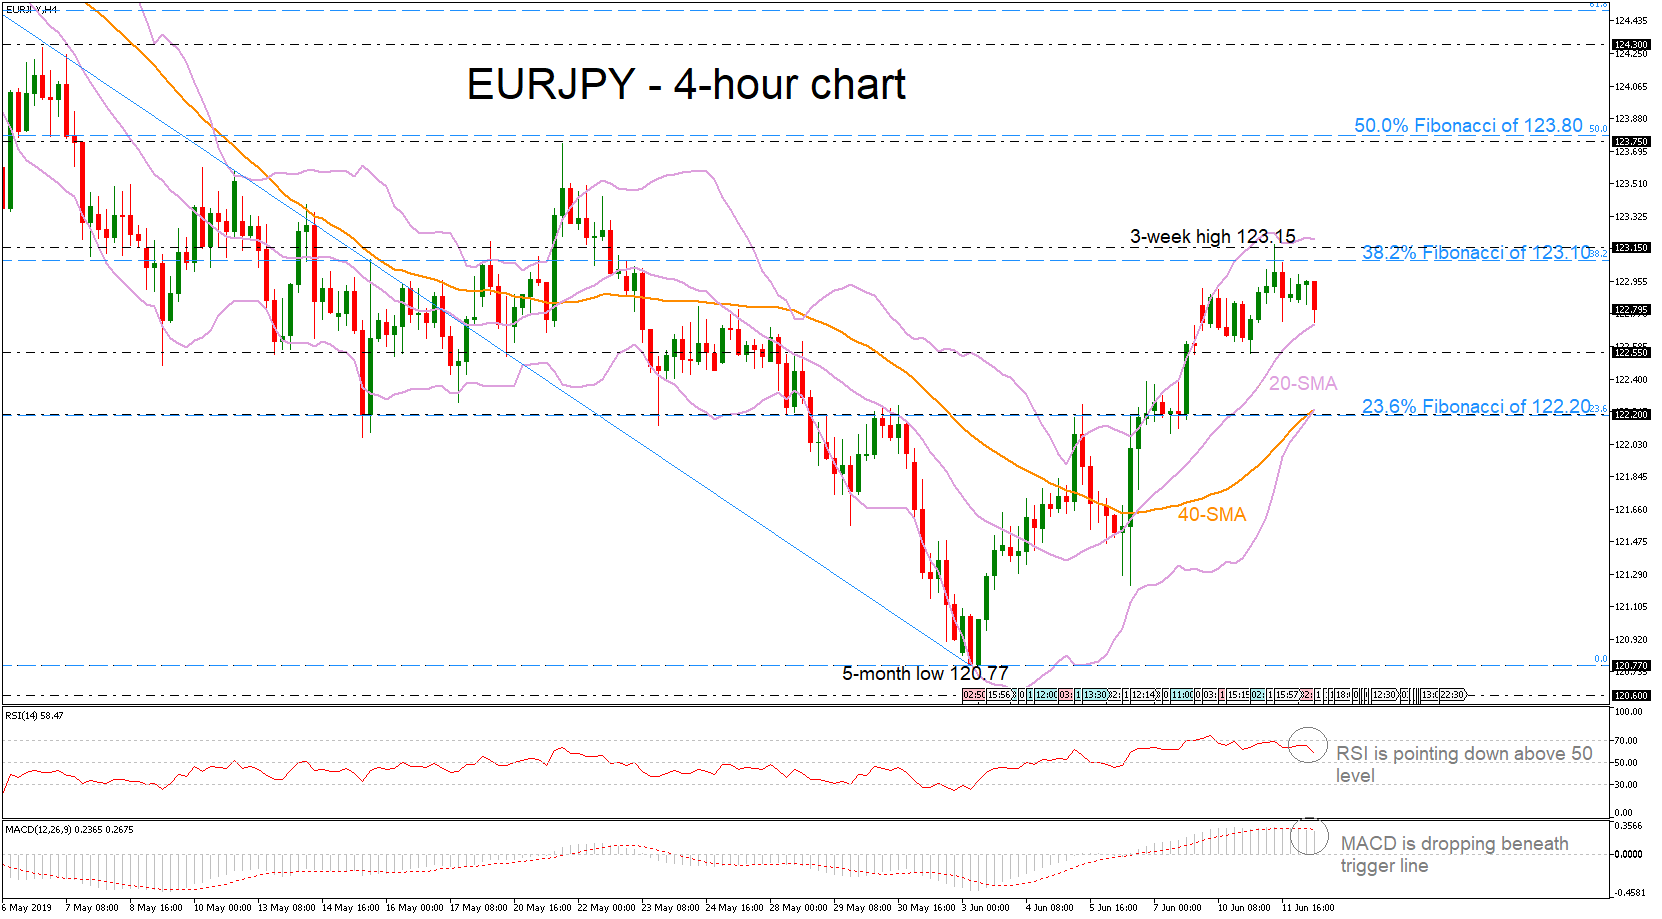
EURJPY had a bearish start on Wednesday, approaching the mid-level of the Bollinger Band (20-simple moving average) in the 4-hour chart, after the pullback on the three-week high of 123.15. The RSI and the MACD are suggesting a possible overstretched market as both are returning lower. The MACD is heading below the trigger line in the positive territory, while the RSI is pointing down below 70 level.
In case the pair continues its short-term direction to the downside, the bears will probably challenge the 122.55 support before heading towards the 23.6% Fibonacci retracement level of the downleg from 126.80 to 120.77, around 122.20, which overlaps with the 40-SMA and the lower Bollinger band.
Alternatively, advances may drive the pair towards the 38.2% Fibonacci of 123.10 and the three-week high (123.15). A significant violation of this barrier could increase this month’s upside rally towards the 123.75 resistance, identified by the peak on May 21.
Briefly, the pair switched to positive mode after the rally off 120.77. However, a run above the 61.8% Fibonacci (124.50) could switch the medium-term negative outlook to bullish. In case of a failed attempt to surpass the upper Bollinger band the bias could turn bearish again.
USD Weakens As Rate Cut Expectations Rise
The greenback weakened yesterday somewhat as market expectations about a possible rate cut by the Fed seem to increase. Market focus is expected to focus on the Fed’s coming policy meeting, next week, looking for possible signals about the bank’s policy direction. Analysts tend to point out that the market has priced in a rate cut by the Fed to a significant degree yet seems to delay it until end of July. Please bear in mind that a number of Fed officials, not excepting Fed’s Chair Powell, in the recent past had implied that the Fed may be open to some monetary easing. Also note that long term US treasury yields show no signs of the recovery yet, which may also weigh on the USD. We expect the release of the US inflation rate to affect the USD today somewhat, yet at the same time we could see the dollar remaining somewhat under pressure. EUR/USD maintained a sideways movement yesterday, yet at the same time showed some bullish tendencies, aiming for the 1.1340 (R1) resistance line. We could see the pair rising even more should the USD side remain under pressure, yet to switch our sideways motion bias, we would require for the pair to break the 1.1340 (R1) which could also be considered as the upper boundary. Should the bulls dictate the pair’s direction, we could see it breaking the1.1340 (R1) resistance line and aim for the 1.1375 (R2) resistance level. On the flip side, should the bears take over, we could see the pair breaking the 1.1300 (S1) support line and aim for lower grounds.
Oil prices drop weaker demand outlook
Oil prices dropped yesterday and during today’s Asian session, as the demand outlook for the commodity seems to weaken. A surprise widening of the US inventories surplus yesterday also did not help oil prices and the official EIA count later today is expected to be closely watched by traders. The slack of the US oil market and rising US stockpiles, despite the OPEC production cuts enhance worries for oil prices according to analysts. On a report released on Tuesday the EIA cut its forecasts for 2019 world oil demand growth and U.S. crude oil production. We expect oil prices to show some increased sensitivity to the EIA inventories release today, yet should there be another indication of a slack in the US oil market we could see oil prices weakening even further. WTI prices dropped and as these lines are written, test the 52.70 (R1) support line (currently turned to resistance). We could see oil prices dropping even further should disappointment continue to direct the commodity’s price action, however we expect that the market may prove sensitive to today’s EIA crude oil inventories figure release, later today. Should the oil remain under the selling interest of the market, we could see it aiming if not breaking the 51.25 (S1) support line. Should the market sentiment be reversed and oil long positions be favored by the market once again, we could see WTI’s price action, breaking the 52.70 (R1) resistance line and aim for the 54.45 (R2) resistance level.
Other economic highlights, today and early tomorrow
Today during the late European session, we get from Turkey CBRT’s interest rate decision. Polls conducted by Reuters and Anadolu news agencies, show an expectation among the majority of the economists which participated for the bank to maintain its current level and we tend to concur with this view. However, we may see the bank issuing a more dovish statement in order to pave the way for future rate cuts, which could weaken the Lira. In today’s American session, we get the US inflation rates for May as well as the EIA weekly crude oil inventories figure. In tomorrow’s Asian session, we get Australia’s employment data for May. As for today’s speakers, we tend to underscore Mario Draghi’s (ECB President) speech, however do not underestimate RBA’s Ellis, as well as ECB’s De Guidos and Coeure which are also scheduled to speak today.
EUR/USD H4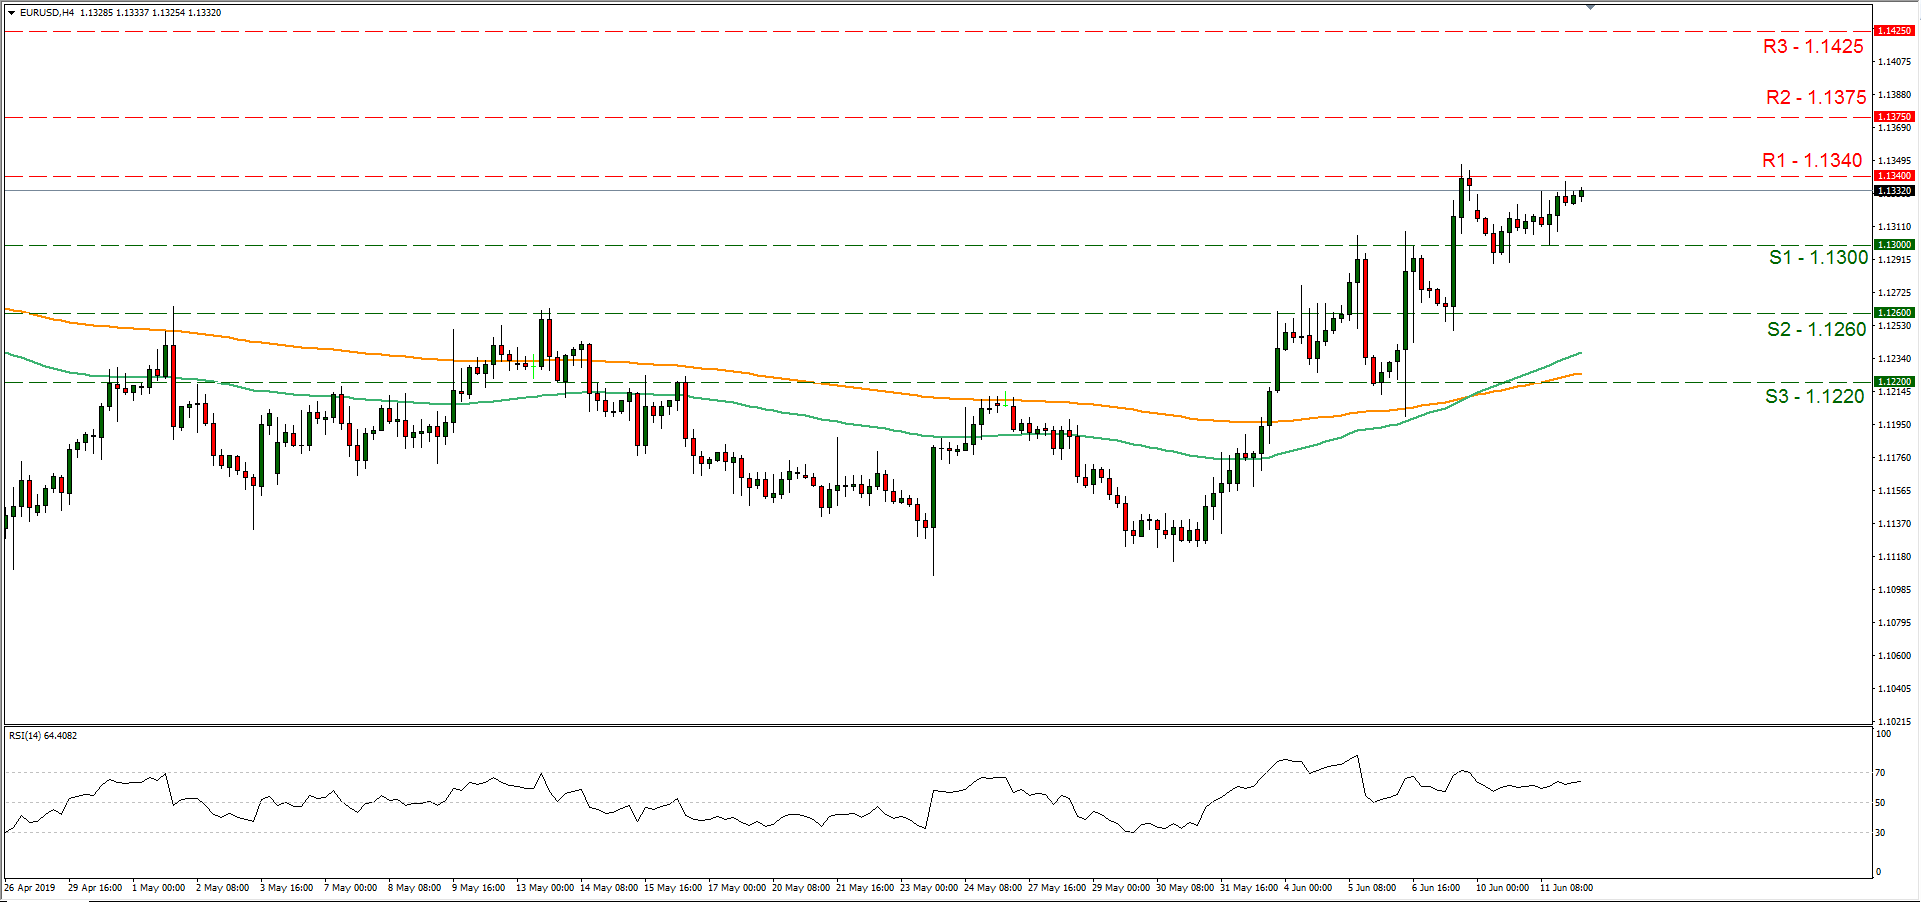
Support: 1.1300 (S1), 1.1260 (S2), 1.1220 (S3)
Resistance: 1.1340 (R1), 1.1375 (R2), 1.1425 (R3)
WTI H4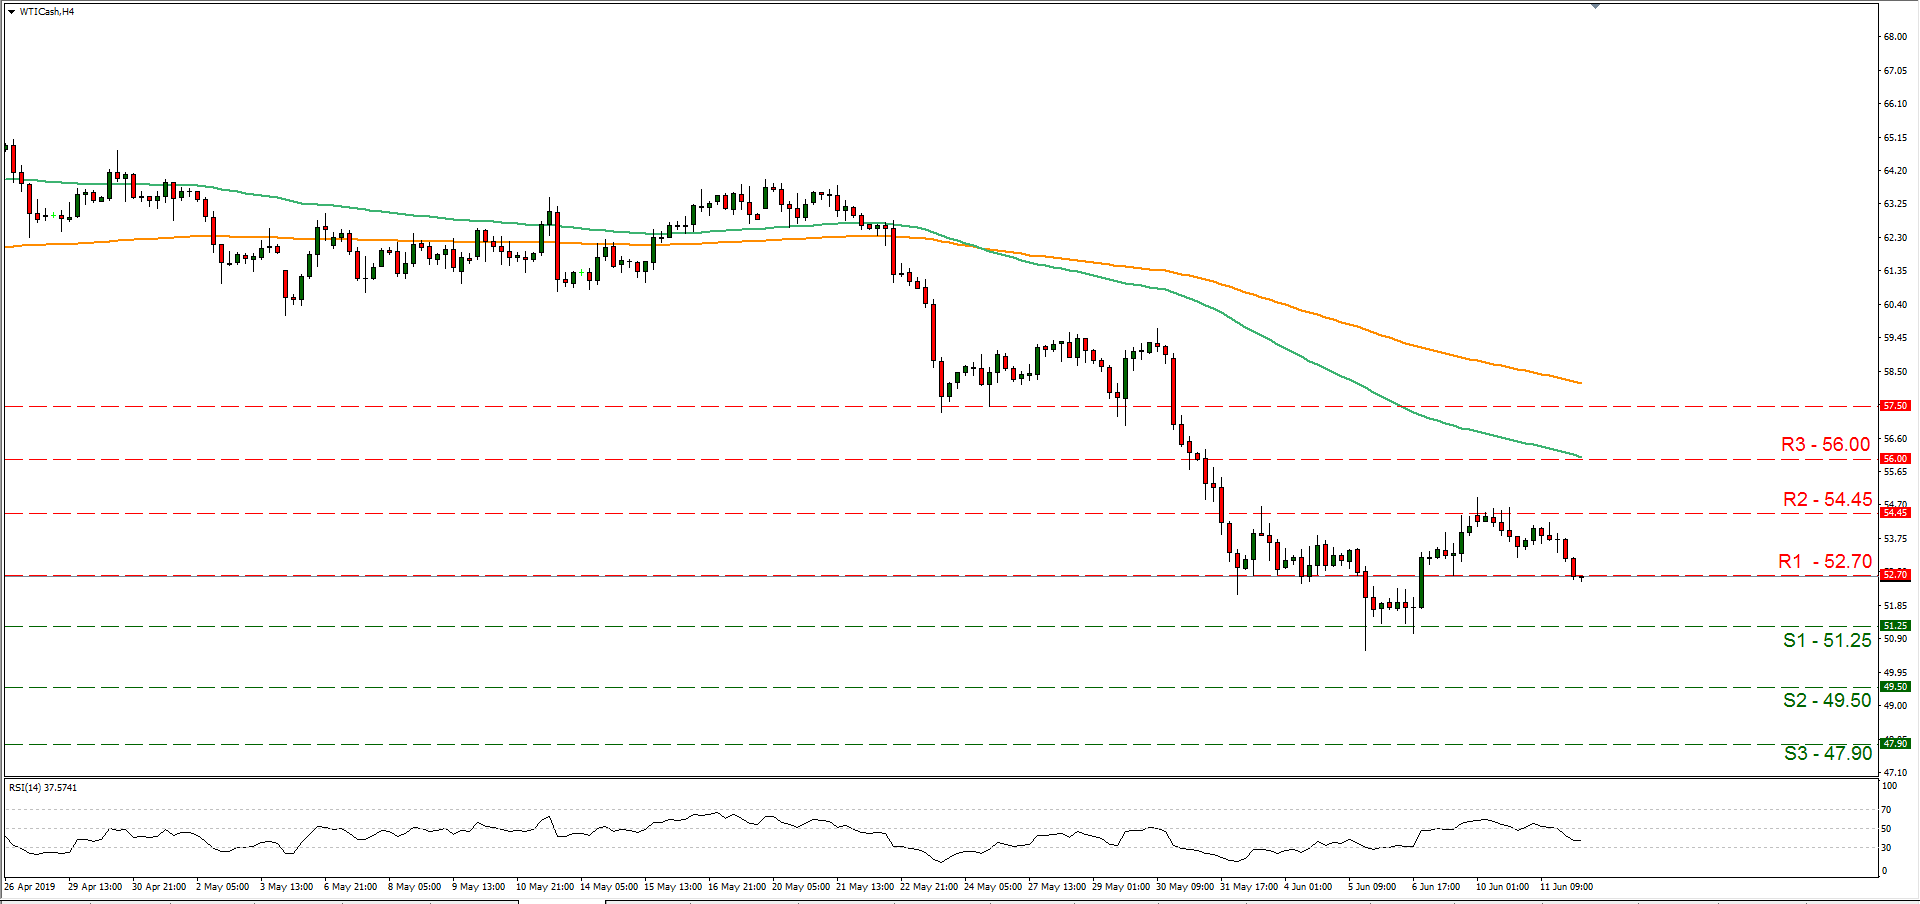
Support: 51.25 (S1), 49.50 (S2), 47.90 (S3)
Resistance: 52.70 (R1), 54.45 (R2), 56.00 (R3)
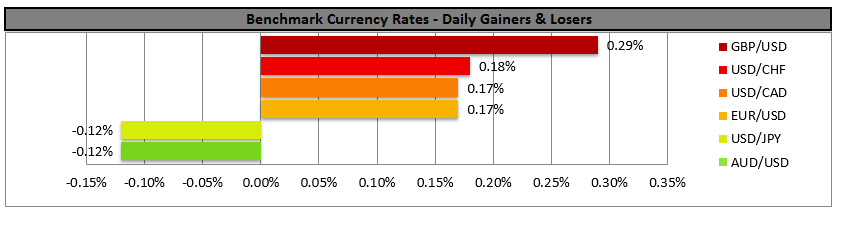
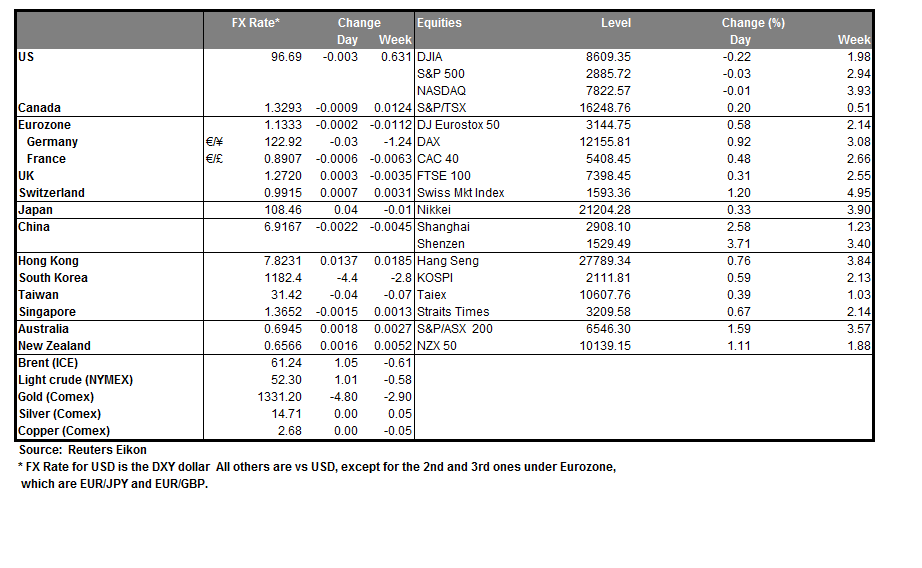
Demonstrations And HKD Rally
HKD Surges
Demonstrations in Hong Kong over the extradition bill might be overshadowed by activity in the local FX market. Hong Kong dollar has risen to its strongest level against the USD in today trading at HIBOR has surged. HKD remains the regions most overvalued currency despite indications of economic vulnerabilities. Weakness in US rates on changing Fed expectations and improvement in Hong Kong (1-month HIBOR 2.42% from 0.92% in February) has narrowed LIBOR-HIBOR spread. Yet fears of de-pegging from the USD are overdone. The Hong Kong Monetary Authority’s (HKMA) has over $400bn of reserves which to defend the currency. Despite negative impulse from the Chinese economy, including trade tensions, we do not anticipate a break in USDHKD or changes in the current FX regime. Despite social unrest, the stability of the Hong Kong banking system, lack of FX alternatives and HKMA’s firepower suggest that policy makers maintain the ability to manage upward pressure on interest rates. In the midterm, USDHKD should reverse to retest the 7.850 weak-side convertibility. In the near, term there is concern over the contraction of HKD liquidity. Banks have lent heavily to local real-estate developers and mainland banks. Combined with the new appetite from speculators (due to PBoC issuing bills in HKD) might constrict HKD availability.
Market pauses ahead of US CPI data
After rallying to a monthly high on Tuesday, equity markets consolidated on Wednesday. Front month futures on the S&P 500 stabilised above the 2,880 points, down 0.23% on the session, while in the Europe EuroSTOXX 50 futures edged down 0.29% to 3,391 points. It is worth noting that the Swiss Market Index (SMI) reached an all-time high yesterday as it hit 9,871.44. Thanks to the solid performances from Nestlé, Novartis and Roche who helped to lift the index by 437, 310 and 230 points, respectively, since the beginning of the year. If one man should be thanked for the last rally it is the ECB President. Indeed, Mario Draghi took a dovish turn at the last meeting, as it left the door wide open for further monetary easing. Indeed, the governing council discussed the possibility of restarting QE and cutting rates.
Recently, the Federal Reserve has also turn to the dovish side and showed concerns about the economic growth and the negative effects of the ongoing trade war. According to the OIS market, investors are now pricing at least two rate cuts before the end of the year. In our opinion, this prediction is a bit too adventurous, as we believe the Fed will use its last bullet cautiously.
Today, all eyes are on the inflation that are due for release at GMT 12:30. Headline inflation is expected to have eased to 1.9%y/y in May, while the Fed’s favourite gauge of inflation, the core measure, should print flat at 2.1%y/y. Both the equity and bond markets are pricing a rate cut in the near future, meaning that the risk is skewed to the upside on today inflation report. Indeed, higher inflation readings could trigger a sell-off, as market participants would discount a dovish move from the Fed in the near term. On the other hand, significantly weaker inflation readings, especially for the core measure, would fuel the current rally. Overall, even though we believe the market is misreading the Fed intentions by anticipating several rate cuts in the near future, we believe that the Fed would ease further monetary conditions in the second part of the summer at the earliest.
ECB Draghi: CEE economies disproportionately affected by global trade headwinds
ECB President Mario Draghi said in a speech that "general slowdown is being felt in all economies in the region. The so called "central and eastern European (CEE) economies" model has become "vulnerable to shocks to international trade and financial conditions".
He added that "global trade has faced headwinds in recent years as trade-restrictive measures have outpaced liberalizing measures." CEE economies have been "disproportionately affected" by this for two reasons. Firstly, trade in CEE economies is "especially responsive cyclical developments", with "trade elasticity" higher than the rest of EU. Secondly, they have "increasingly specialised in certain industries: which made the "more exposed to industry-specific shocks."
EUR/USD Outlook: Bulls Eye 200SMA But Consolidation May Precede Final Break
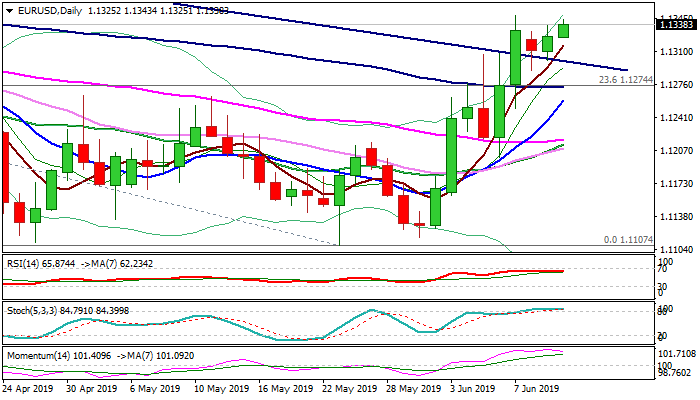
Bulls fully regained control after shallow pullback and pressure last Friday’s 2 ½ month high / 200WMA (1.1347), with key barriers at 1.1364 (200SMA) and 1.1377 (Fibo 38.2% of 1.1815/1.1107) being in focus, as weak dollar adds to bullish outlook.
Overbought daily stochastic and weaker momentum warn that bulls may show hesitation at these levels and price adjustment may precede final break higher.
Broken bear-trendline offers solid support at 1.1299 and guards key supports at 1.1279/72 (daily cloud top / 100SMA).
US inflation data are due later today and may provide fresh signals.
Res: 1.1347, 1.1364, 1.1377, 1.1400
Sup: 1.1318, 1.1299, 1.1279, 1.1259