Sample Category Title
Gold’s retreat contained by 1319.9 support, maintains bullish outlook
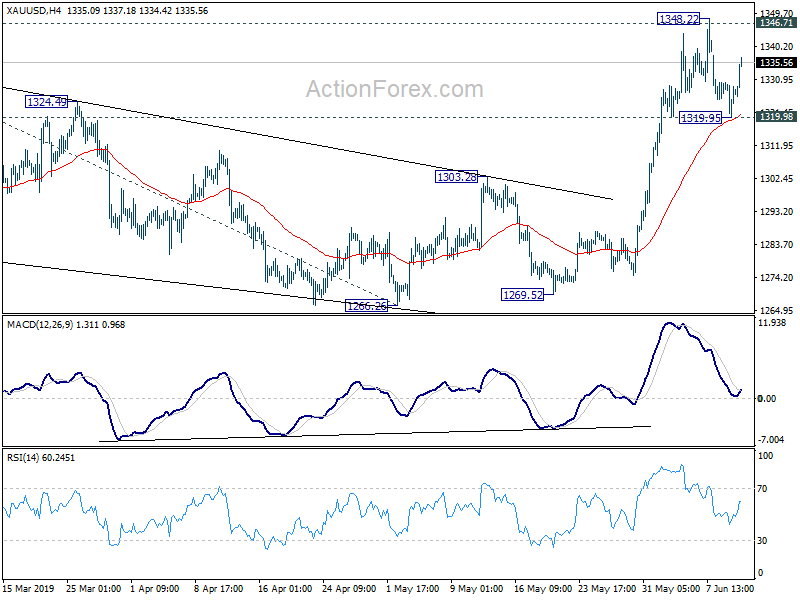
Gold failed to sustain above 1346.71 and retreated from 1348.22. But downside was contained by 1319.98 support and gold recovered. Near term bullish outlook is maintained. That is, correction from 1346.7 has completed at 1266.26 already. And rise from there is resuming whole rally from 1160.17. Break of 1348.22 will target 61.8% projection of 1160.17 to 1346.71 from 1266.26 at 1381.54. However, break of 1319.98 support, will probably extend the consolidation from 1346.71 with another decline.
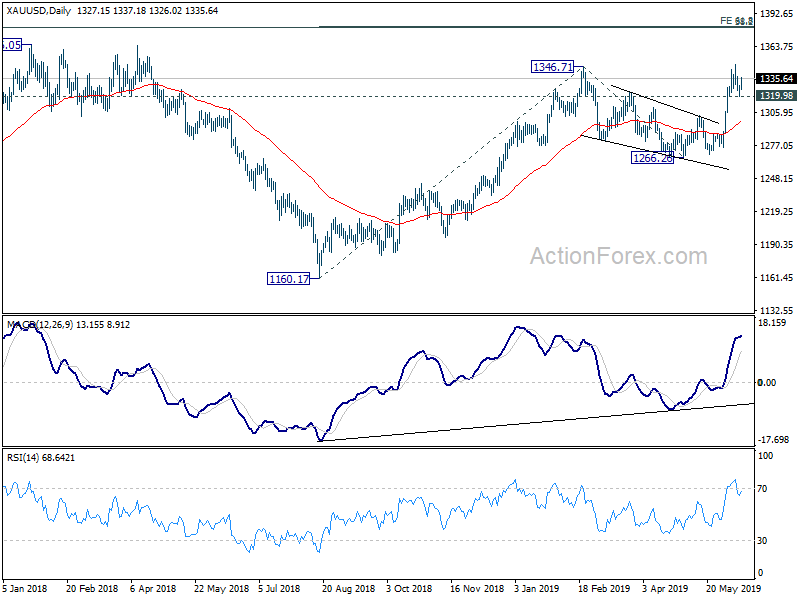
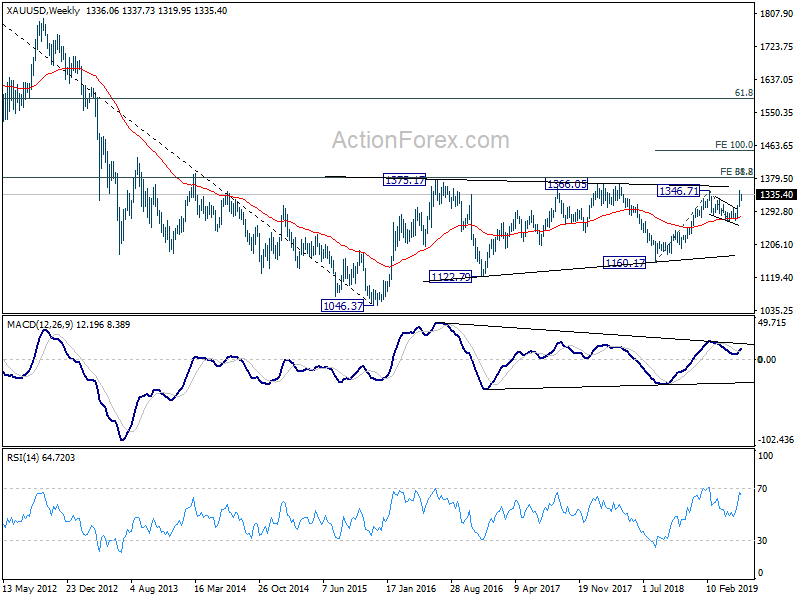
Also, in the bigger picture, 1381.54 is very close to long term fibonacci resistance of 38.2% retracement of 1920.70 (2011 high) to 1046.37 (2015 low) at 1380.36. Prior strong support from 55 week EMA is taken as a rather bullish signal. That raises the chance that gold would finally overcome this fib resistance after multiple attempts over the last few years.
Forex Technical Analysis: EUR/USD, USD/JPY, GBP/USD
EUR/USD
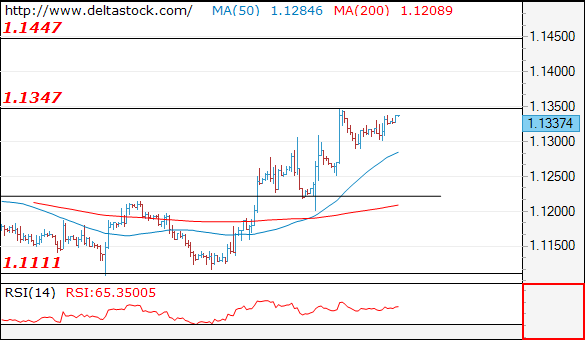
Current level - 1.1337
The corrective pattern below 1.1347 is still underway, with a chance of another slide towards 1.1290. An eventual break through 1.1347 will target 1.1450 resistance.
| Resistance | Support | ||
| intraday | intraweek | intraday | intraweek |
| 1.1350 | 1.1450 | 1.1285 | 1.1015 |
| 1.1450 | 1.1450 | 1.1220 | 1.0860 |
USD/JPY
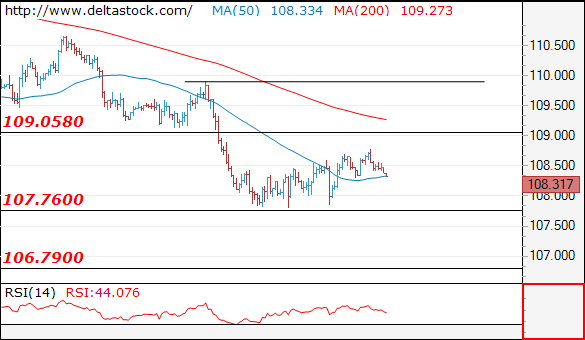
Current level - 108.31
The intraday outlook is slightly negative after the 108.80 peak, for another test of 107.70 area.
| Resistance | Support | ||
| intraday | intraweek | intraday | intraweek |
| 109.05 | 109.90 | 108.25 | 107.70 |
| 109.05 | 112.40 | 107.70 | 106.70 |
GBP/USD
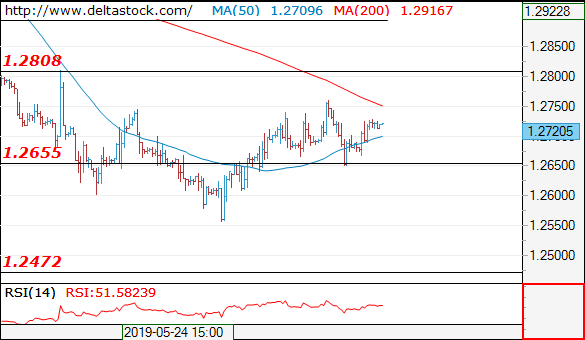
Current level - 1.2720
Th rebound after 1.2650 test is still corrective and while 1.2760 high is intact, the outlook will remain bearish, for a slide towards 1.2550. Trigger on the downside is 1.2690.
| Resistance | Support | ||
| intraday | intraweek | intraday | intraweek |
| 1.2760 | 1.2960 | 1.2690 | 1.2570 |
| 1.2810 | 1.3170 | 1.2550 | 1.2470 |
Gold Recovers Following Monday’s Slump
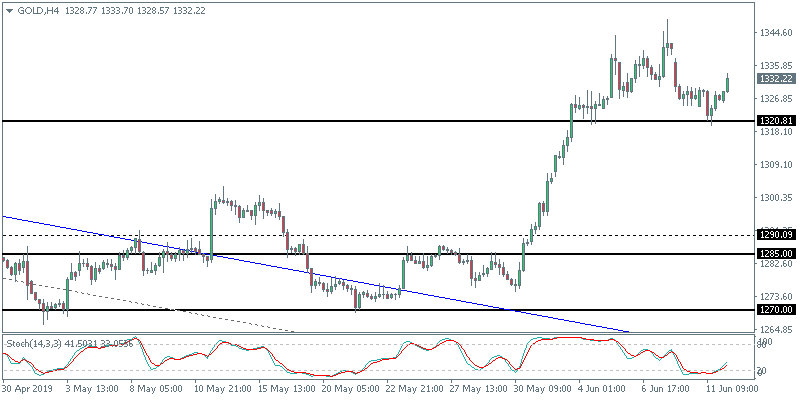
Gold prices were seen recovering early this morning. Price posted a strong reversal in an attempt to reverse the declines from Monday this week. The rebound in gold prices come as equity markets paused their recovery rally. Producer prices index report was subdued, adding to the speculation of a potential rate cut from the Fed this year.
Can XAUUSD Maintain the Gains?
The rebound in gold prices coincides with a brief test of the support area at 1322–1313 level. A bullish close is required on the day in order to confirm the upside. Gold prices will likely aim for Monday's gap at 1340.44 initially. A close above this level will potentially signal further gains in the near term.
UK Unemployment Rate Holds Steady
The monthly unemployment report from the UK showed that the rate held steady at 3.8%. Wage growth was also positive, rising 3.1% or about 3.4% without adjusting for inflation on a year over year basis. Economists forecast that wage growth would slow. Revision to previous data saw the wage growth being revised from 3.1% to 3.3%. The sterling managed to post some modest gains on the back of the unemployment report.
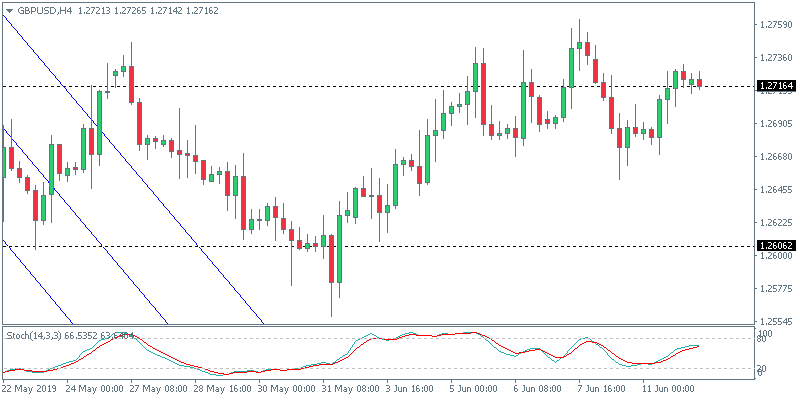
GBPUSD Attempts to Breakout From its Range
The currency pair attempted to push to the upside as price managed to recover within the range. GBPUSD is seen once again trading at the top end of the range at 1.2716. As long as price holds this level, we could expect to see further gains in store. The next upside target is seen at 1.2895 where resistance is most likely to form.
Euro Unmoved By Sentix Investor Report
The common currency brushed aside weakness in the latest Sentix investor report as the currency remained bullish. The monthly report saw the index falling to -3.3, missing estimates of 2.3. Previously, the index registered a reading of 5.3. Later today, the ECB President Mario Draghi is slated to speak at a scheduled event.
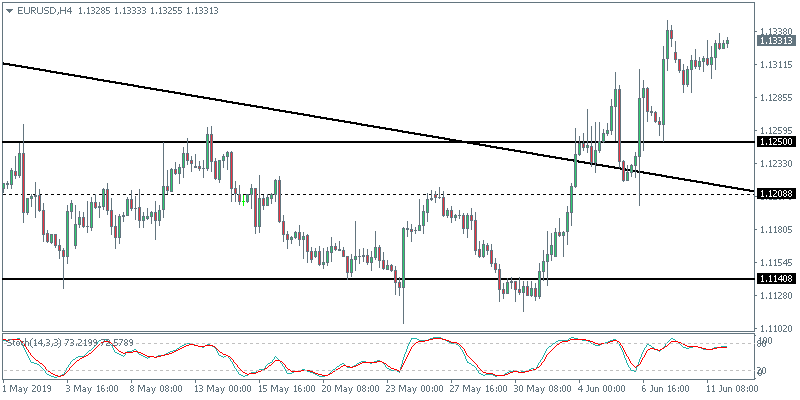
EURUSD Aiming to Test Last Friday’s Highs
The currency pair has been retracing the modest losses from earlier this week. Price action is seen aiming for Friday’s highs near the 1.1338 level. A close above this high could potentially confirm further upside in price. The next main price level of interest in the currency pair is 1.1400.
Currencies: Will US CPI Trigger Further USD Losses
- Rates: Italy to launch new 20-yr syndicated bond
The risk rally that start last week is losing pace. The upward rebound in US yields also remains limited with next week's Fed meeting in mind. Italy profits from last week's dovish ECB outlook and new momentum to launch a new 20-yr syndicated benchmark deal. - Currencies: will US CPI trigger further USD losses;
The rebound in US yields already ran out of steam yesterday and also blocked any USD upside momentum. US president Trump said the euro was devalued against the dollar, signaling its preference for a weaker dollar. The focus for USD trading is on the US CPI today. A soft figure might reinforce calls for a Fed rate cut and weigh on the dollar
The Sunrise Headlines
- US equity indices opened in green yet ended marginally in red yesterday, ending the recent winning streak. Asian stocks lose ground with Hong Kong underperforming (-1.6%) amidst ongoing demonstrations.
- Hong Kong protests escalate with demonstrators blocking roads and a 100+ HK businesses closed in a sign of solidarity. Protests have erupted after lawmakers announced debating legislation that would allow extraditions to China.
- US president Trump said it is him personally that is blocking a US/Sino deal from happening. He said Beijing has been backtracking on the preliminary agreement and he has 'no interest' in a deal unless China returns to those terms.
- Chinese inflation in May accelerated from 2.5% YoY to 2.7%. The increase was mainly driven by a surge in food prices. Pork prices rose a stunning 18.2% as the African swine fever started to take its toll. Non-food prices were up 1.6%.
- The US government trimmed the US corn harvest forecast to the lowest in four years as continuous rainfall in the Midwest keeps farmers out of the fields. The US produces about one third of world production. Corn prices jumped 5%.
- EC president Juncker warned the Conservative leadership candidates that the current withdrawal agreement 'will not be renegotiated', but said Brussels remained open to discuss the details of the political declaration.
- In today's economic calendar we watch for US CPI in May. Frankfurt hosts many high-profile speakers, including IMF's Lagarde and ECB's Draghi, Coeuré and de Guindos. The US, Germany and (most likely) Italy tap the bond market
Currencies: Will US CPI Trigger Further USD Losses
US CPI to trigger additional USD losses?
The news flow was mixed yesterday and the dollar traded accordingly. Initially, further rebound in US yields supported the dollar, especially USD/JPY. US data were OK with a strong NFIB small business confidence, but it wasn't enough to sustain further USD gains. President Trump indicated that the euro (and other currencies) were devalued against the dollar. The immediate reaction was limited, but the US raising doubts on the strong USD policy is a potential USD negative. Later, an intraday reversal in US yields also erased the USD gains. EUR/USD closed at 1.1326 (from 1.1312). USD/JPY ended at 108.52 (from 108.45).
This morning, Asian equities show modest losses as the US is holding a tough stance on a trade deal with China going into the G20. Hong Kong equities underperform, but the HKD jumped as tighter liquidity/higher yields raised the cost of shorting the HKD. A tentative decline in US yields keeps the US dollar in the defensive. EUR/USD is trading in the 1.1335 area. USD/JPY hovers in the mid 108 area.
Today, the US CPI will take centre stage. Both headline (1.9% from 2.0%) and core (2.1% unchanged) are expected close to the 2% target. Risks, if any, might be slightly to the downside, a potential USD negative. The rift between the EU commission and Italy on the country's budget continues, but it isn't clear how hard both sides will play this game. For now, the (negative) impact on the euro is modest.
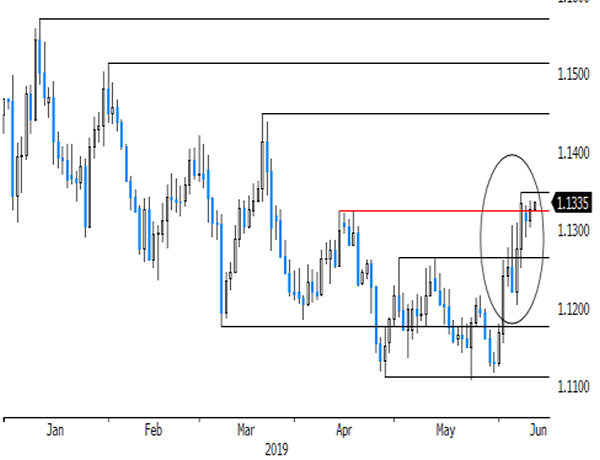
At the end of last week, US yields touched new cycle lows, pushing EUR/USD temporarily above the 1.1324 resistance. US yields bottomed this week as substantial Fed easing was discounted, removing some pressure from the dollar. Still, the USD rebound was unimpressive. Longer term, the dollar might have entered a sell-on-upticks pattern. The 1.1200/1.1250 looks solid EUR/USD support. Further sustained gains beyond 1.1324/48 still open the way to the 1.1448 target area.
Sterling rebounded yesterday. UK labour data were OK despite ongoing uncertainty on Brexit. Markets still see little chance on a BoE rate hike, but the labour report gave some more credence to recent BoE warnings that a rate hike might be needed. EUR/GBP dropped to the 0.89 area. There are UK data today. Headlines from the political battle to succeed PM May will highlight uncertainty. Still we have the impression that the decline of sterling is losing some momentum. The EUR/GBP 0.90/0.91 is a tough resistance.
EUR/USD continues to test recent top as sentiment on the US currency remains fragile
Trade War Profit Pressure: Which Industries Are Most at Risk?
Executive Summary
The most recent escalation in the U.S.-China trade war increased the tariff rate to 25% on approximately $200 billion of U.S. imports from China. With approximately 45% of Chinese goods now subject to a 25% tariff, the complete avoidance of additional costs due to tariffs looks unfeasible for most industries. Industry exposure to tariffs on Chinese goods, however, does vary. In this note, we calculate industry exposure to the most recent round of tariffs on Chinese goods as well as the exposure if 25% tariffs are extended to the remaining imports from China. Leather, computer & electronics, machinery, textiles and furniture appear most exposed to higher input costs related to the latest tranche of tariffs. If tariffs are extended to all imports from China, the apparel industry joins the ranks of highly exposed industries.
There is potential for U.S. producers of goods exposed to tariffs to see stronger profit growth as less foreign competition allows these firms to increase prices and/or gain market share. However, we suspect a weakening in demand associated with higher prices and widening net of industries exposed to tariffs will more than offset any gain in profits for U.S.-based producers.
Trade War Risks to Corporate Profits
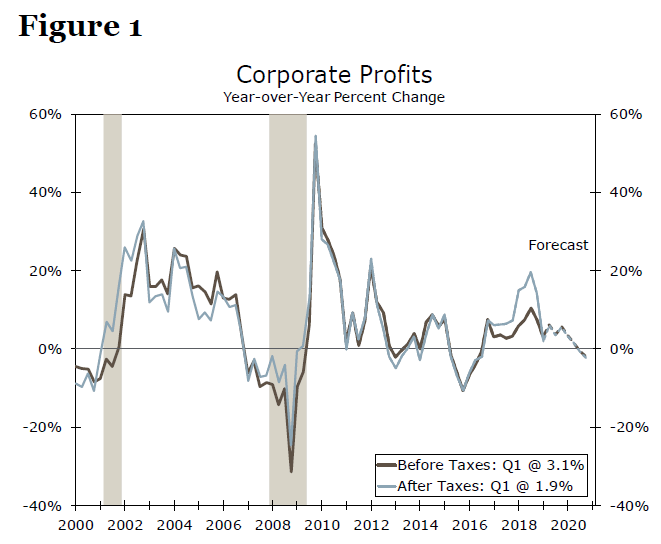
As we wrote in a recent report, corporate profit growth has held up fairly well over the past year.1 Although after-tax profit growth slowed in the first quarter, the deceleration largely reflected a tougher base comparison now that the reduction in the corporate tax rate is a full year behind us. At 1.9%, before-tax profit growth has slowed only slightly over the past two quarters. We expect profit growth to downshift further this year as broad economic growth loses some momentum amid fading fiscal stimulus and as a tight labor market pushes employment costs higher (Figure 1).
The ongoing U.S.-China trade war, however, could upend our forecast for moderate profit growth through year-end. Tariffs are a tax on imports. Businesses that import these goods can deal with their higher costs through a number of channels, including pushing back on costs from foreign suppliers and/or passing the tariff cost to consumers. But for many businesses, a complete avoidance of additional costs due to tariffs is unfeasible.
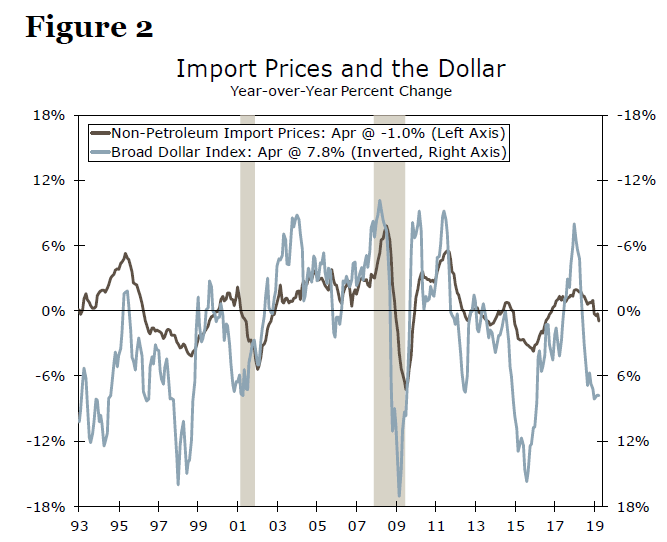
Unless demand is inelastic (i.e., the quantity demanded by consumers is completely unresponsive to price) importers end up absorbing part of the tariff. Finding new supply chains that bypass China is an option, but that option entails costs, at least in the short run. A stronger dollar may push the starting value of goods subject to tariffs down, but with most trade already invoiced in dollars, currency adjustment is likely to have a fairly minimal effect (Figure 2). Recent research has found that almost all of the cost of tariffs have been borne by U.S. importers and consumers.2,3
The initial 25% tariffs on $50 billion of Chinese goods that went into effect last summer applied to only about 8% of imports from China and equated to less than 2% of total U.S. imports. Now with 25% tariffs on another $200 billion of goods from China in effect, the heat on U.S. firms reliant on goods from China has been turned up. Not only are import costs of Chinese goods poised to jump under the widening net of tariffs, but non-Chinese producers—American or other foreign companies—could take the opportunity to raise prices.
The extent to which non-Chinese producers do so, however, will depend at least in part on how large a role Chinese products play in the U.S. market. In industries where Chinese-made products account for only a small share of inputs, costs are unlikely to change much even with the application of tariffs, as alternative sources are widely available. For industries with a large share of inputs from China, prices stand to rise more from both the direct and indirect impact of tariffs.4
Profit Pain by Industry
Which industries then are most exposed to a tariff-induced profit squeeze? To answer this question, we first look at the goods affected by the most recent tariff tranche (the $200 billion of goods now subject to 25% tariffs) using the Harmonized Commodity Description and Coding System (HS). Some of the largest categories in value terms exposed to the latest round of tariffs include electric machinery, nuclear reactors, furniture & bedding, plastics and motor vehicles & parts. However, China does not necessarily account for a large share of imports for each of the affected categories. For example, while imports of motor vehicles & parts is the fifth largest category hit by the last round of tariffs, only a small slice—5.6%—of this industry's imports come from China.
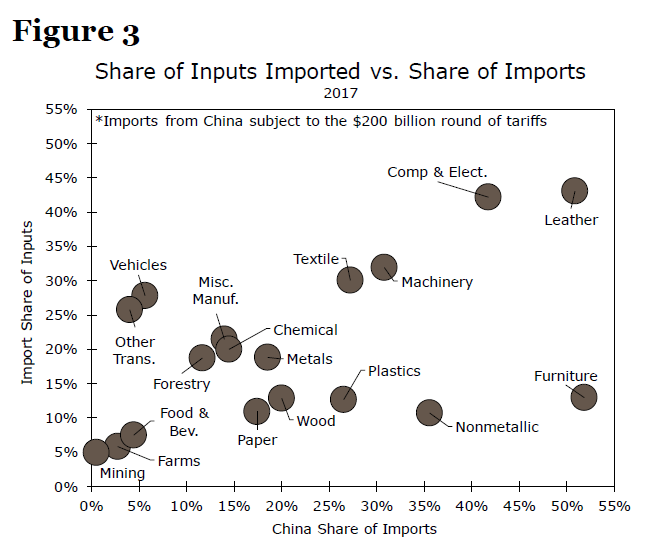
We then turn to the input-output tables of the United States to determine what share of each industry's inputs is derived from imports.5 China may be a large import source for some industries like nonmetallic minerals (36% of imports), but imports account for a relatively small share of inputs (11%) for the industry (Figure 3). If only a small share of an industry's inputs are imported, profits should be relatively insulated from the tariffs on Chinese goods.
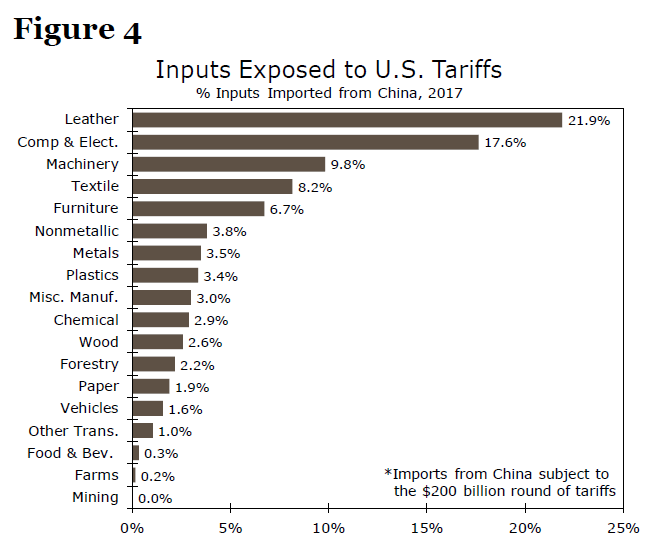
Using both the HS trade data and the input-output tables, we calculate the share of an industry's inputs directly subject to the $200 billion round of tariffs. To do this, we determine the share of imports that come from China and multiply that by the share of an industry's inputs that are imported. As shown in Figure 4, leather manufacturers are hardest hit by the latest round of tariffs, with more than 20% of inputs directly exposed. Computers, electronics & electrical equipment also have high levels of exposure. Non-Chinese producers will have more scope to increase prices as competitors' costs rise, generating upward pressure on these input costs. Industries with less pressure from the tariffs include mining, farming, food & beverages, motor vehicles and other transportation (largely aerospace), as China accounts for a relatively small share of imports and/or the United States does not import much of those products anyway.
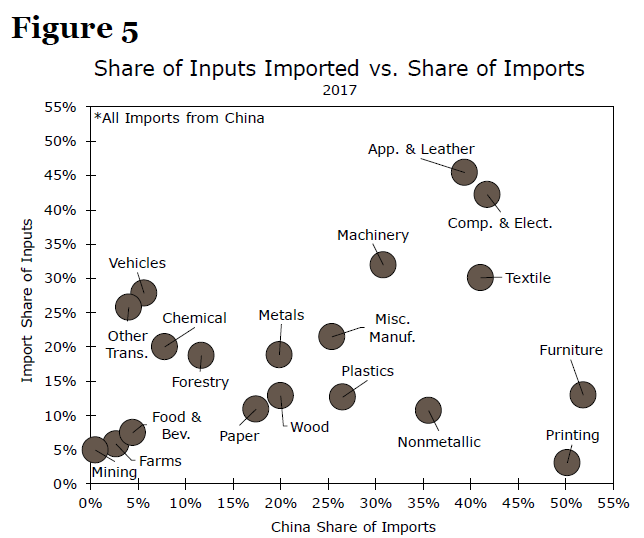
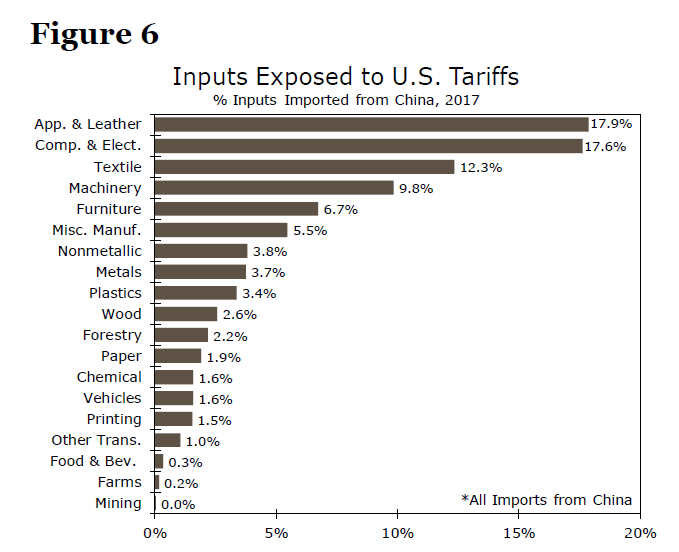
Thus far, the Trump administration has directed tariffs largely toward intermediate products to mitigate the impact of tariffs on consumers. Therefore, consumer-facing industries like apparel and toy manufacturing have not yet faced notable profit pressure. An all-out trade war with China, where 25% tariffs are applied to all imports, would change that picture (Figure 5). Taking into account all imports from China and their relative share of inputs shows that the apparel & leather industries stand to see the most pressure from higher input costs—whether directly via higher costs of Chinese goods or indirectly via less import competition (Figure 6). Textiles, furniture and miscellaneous manufacturing (which includes industries like toys, where 80% of imports come from China) also is at a relatively high risk of profit erosion, along with computer & electronics as well as machinery.
But Won't U.S. Producers Make Higher Profits?
Admittedly, U.S. producers of goods exposed to tariffs could see a boost to profits as less foreign competition allows them to increase prices and/or gain market share. However, we are skeptical that the profit gains of U.S. producers in protected industries would more than offset the profit losses of import-using firms.
Research on the tariffs implemented in 2018 shows that U.S. producers facing less import competition did indeed raise prices, but by only about 1%.6 At the same time, some U.S. producers manufacturing goods in industries in which Chinese imports are now subject to tariffs may see some of their own input costs rise. For example, machinery manufacturers may be able to raise prices given less import competition, but the metals used to make the machinery is also more expensive due to tariffs. In addition, retaliatory tariffs and the strength of the dollar would exert headwinds on U.S. export growth.
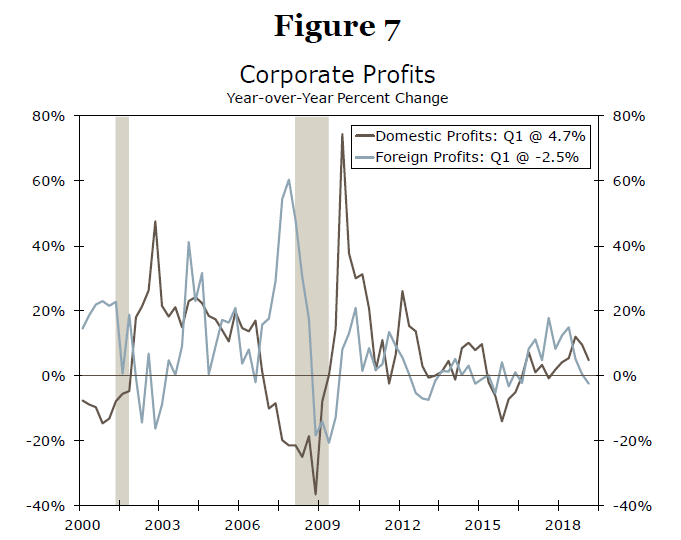
There are also other macroeconomic effects to consider. The uncertainty caused by the current trade environment is hardly conducive to strong investment spending, especially in industries that have a fair amount of export exposure. In addition, a tariff-induced increase in consumer prices would erode real income growth and weigh on growth in consumer spending. In short, an all-out trade war would lead to slower sales and profit growth. And the slowdown need not be confined to the United States. As the trade environment inflicts pain on the global economy more generally, U.S. profits earned abroad would also weaken, as has been the case over the past year (Figure 7).
Conclusion: Weaker Profit Growth a Headwind to Growth
Corporate profit growth was already poised for a slowdown this year following the fading effects of last year's corporate tax cuts and fiscal stimulus more generally. But the recent deepening in the trade war with China stands to put further pressure on corporate profit growth in coming quarters. While businesses are likely to try to pass on costs to consumers or push back some of the burden on Chinese suppliers, we anticipate the tariff environment is poised to put additional pressure on U.S. corporate profits as input costs rise and firms absorb at least some of the cost. Industries that appear most exposed to higher input costs related to tariffs with China—whether directly via higher import costs or indirectly if U.S.-based producers increase costs—include leather, computer & electronics, machinery, textiles and furniture. If 25% tariffs are placed on the rest of imports from China, the apparel industry also looks highly exposed.
American producers of import-competing goods could realize a bump in profits, at least in the near term, if tariffs push up their selling prices. However, any such boost likely would not fully offset losses among other firms due to higher input costs and slower economic growth. The risk for the broader economy is that the slowdown in profit growth curtails businesses' ability and willingness to invest and expand payrolls here in the United States.
1 Please see, "Corporate Profits: A Soft Landing?" (May 31, 2019) for additional detail.
2 Amiti, Mary, Stephen J. Redding and David Weinstein (2019). "The Impact of the 2018 Trade War on U.S. Prices and Welfare." National Bureau of Economic Research, Working Paper 25672.
3 Fajgelbaum, Pablo D., Pinelopi K. Goldberg, Patrick J. Kennedy and Amit K. Khandelwal (2019). "The Return to Protectionism." National Bureau of Economic Research, Working Paper 25638.
4 In economic jargon, an increase in the number of potential suppliers increases the elasticity of supply. An increase in the elasticity of supply allows importers to pass on more of the tariff cost to consumers, everything else equal.
5 We convert from HS classification to the North American Industry Classification System (NAICS) at this point to make comparisons to the input-output tables, which utilize NAICS for their commodity groupings.
6 Amiti et al. 2019.
AUDUSD Moves Back Towards 0.6900, Positive Rally Faded
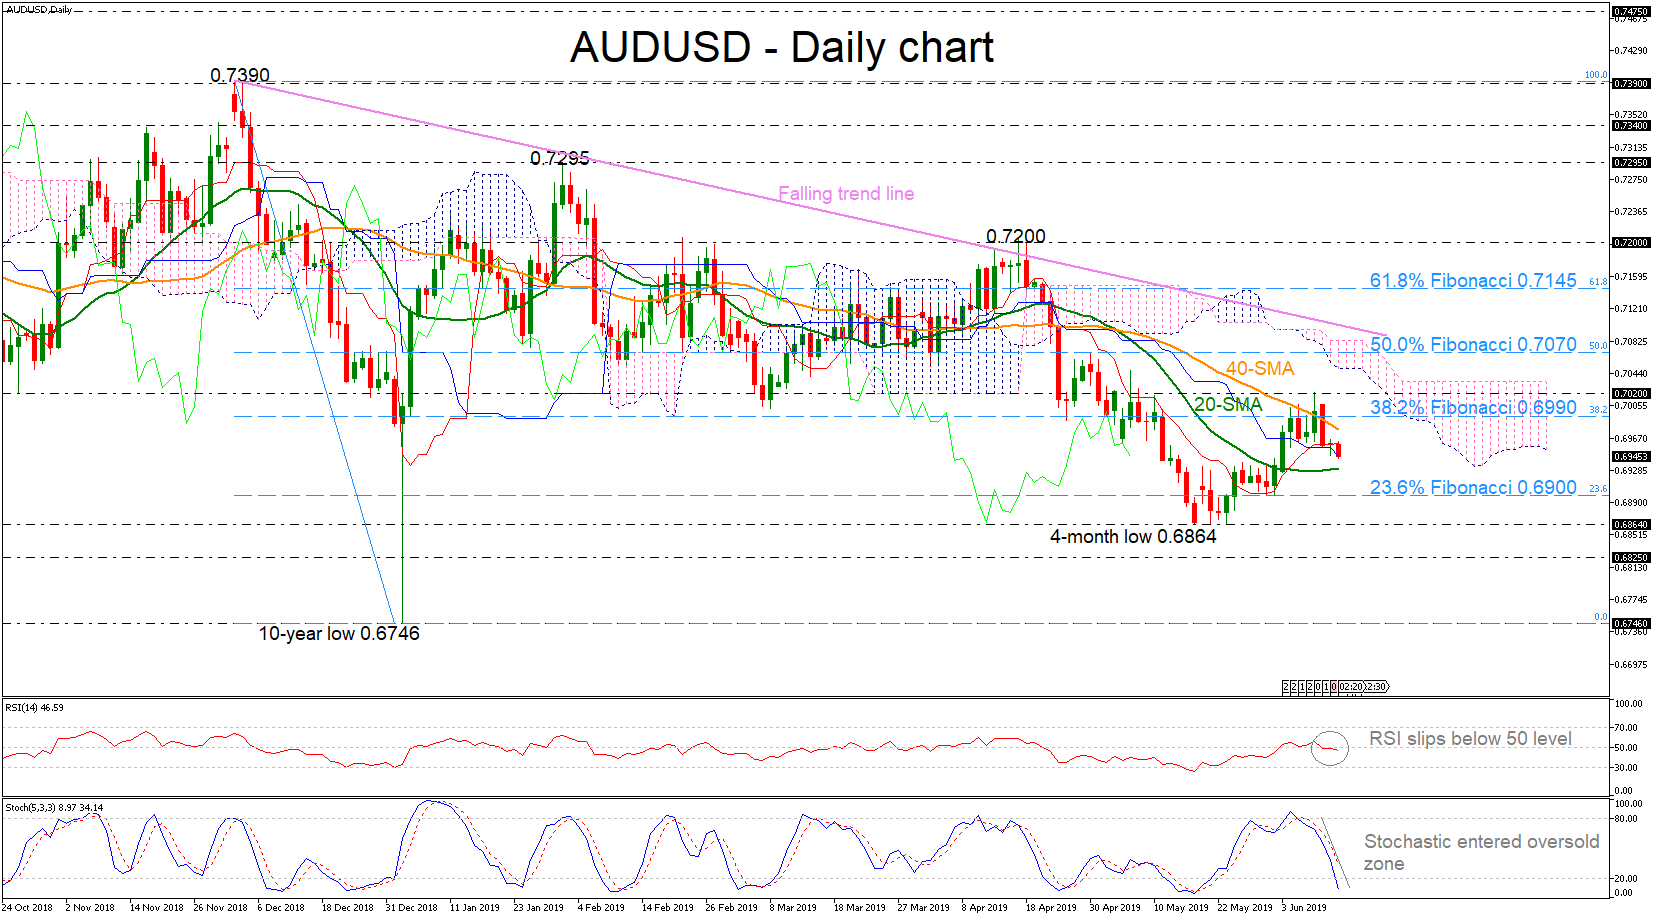
AUDUSD continues to fall below the Ichimoku cloud, remaining in a downtrend over the last six months, stretching its movement towards the 0.6900 psychological level.
According to the RSI, negative momentum could push for further losses in the short-term as the indicator loses steam below its neutral threshold of 50. The stochastic oscillator is also declining, approaching the oversold territory. The price is hovering within the simple moving averages (SMAs) and between the red Tenkan-sen and the blue Kijun-sen lines.
The move could be extended on the downside if the market manages to clear the 20-day SMA and challenge the 23.6% Fibonacci retracement level of the downward wave from 0.7390 to 0.6746 near 0.6900. Breaking this level too, could open the door for the four-month low of 0.6864 and the 0.6825 support.
Should the price climb above the 40-day SMA and the 38.2% Fibonacci of 0.6990, it could then challenge the 0.7020 peak. Further up, the spotlight would turn to the 50.0% Fibonacci of 0.7070, which stands slightly below the descending line.
Overall, the medium to long-term traders who look at the six-month picture continue to face a bear market. The very short-term bias is negative as well after the bounce off the 0.7020 resistance.
Asian Markets Trade Mixed After Lack Of Direction From US Stocks
General Trend:
- Hang Seng underperforms amid focus on extradition bill protests
- Chinese equities decline in early trading, markets rose over 2.5% on Tuesday on expectations of more infrastructure spending
- Nikkei trades generally flat; TOPIX Machinery index rises on better than expected machine orders data
- Softbank weighed down by regulatory concerns about Sprint/T-Mobile merger
- Tesla rose in afterhours trading as it held its annual shareholders meeting
- Oil prices decline over 1% during Asian trading amid API oil inventories and comments from UAE Oil Min
- China CPI accelerates on higher fruit and pork prices; Analysts note core inflation remains ‘low’
- PBoC uses 28-day reverse repo amid focus on China’s interbank market, prior gov’t takeover of Baoshang Bank
- HKD and HK money market rates rise amid protests, nothing seen regarding any currency intervention; Some have noted possible cash hoarding by banks ahead of quarter end
- KRW declines after comments from BoK Gov Lee, Lee later asked reporters not to over-interpret his remarks
- Australia consumer confidence declines despite easing by RBA, deepening economic concerns noted
- Aussie declines ahead of upcoming key data out of Australia and China
- Aussie May labor market data due on Thursday
- Japan Economy Min Motegi and USTR Ligthizer are expected to meet on Thursday (June 13th)
- China’s key May data (including industrial production) due for release on Friday
Headlines/Economic Data
Australia/New Zealand
- ASX 200 opened +0.2%
- (NZ) New Zealand May Total Card Spending M/M: 0.2% v 0.4% prior; Retail Card Spending M/M: -0.5% v 0.5%e
- (AU) Reserve Bank of Australia (RBA) Assist Gov Kent makes no comments on monetary policy at the Australian Renminbi Forum Melbourne
- (AU) Australia Jun Westpac Consumer Confidence Index: 100.7 v 101.3 prior; m/m: -0.6% v +0.6% prior (first decline since March)
- (AU) Australia Regulator APRA: to revise some proposals related to bank capital requirements; covers credit cards, personal car loans, and mortgages
Japan
- Nikkei 225 opened -0.4%
- (JP) In a Nikkei Op Ed analysts speculate that a "Cold War 2.0" between China and the US could end Japan's economic stagnation and deflation
- 7201.JP Two leading proxy advisory firms,Glass Lewis and Institutional Shareholder Service, urge shareholders to vote against reappointment of CEO Saikawa at AGM June 25th – Nikkei
- (JP) JAPAN APR CORE MACHINE ORDERS M/M: +5.2% V -0.9%E; Y/Y: +2.5% V -5.3%E
- (JP) Japan May PPI (CGPI) M/M: -0.1% v 0.0%e Y/Y: 0.7% v 0.7%e
- (JP) Japan PM Abe: Will exchange options with Iran leaders to ease tensions - comments ahead of trip June 12-14
Korea
- Kospi opened flat
- (KR) US President Trump: received a "beautiful" and "very warm" letter Monday from North Korean leader Kim
- (KR) Bank of Korea (BOK) Gov Lee: Will make appropriate policy response to economic changes; BOK needs to prepare various policy scenarios for timely response - prepared statement to mark the central bank’s 69th anniversary
- (KR) South Korea Fin Min Hong: BOK Gov Lee remark hints at policy easing
- (KR) South Korea May Unemployment Rate: 4.0% v 4.1%e v 4.1% prior
China/Hong Kong
- Hang Seng opened -0.7%; Shanghai Composite opened -0.3%
- (CN) CHINA MAY CPI M/M: 0.0% V 0.0%E; Y/Y: 2.7% V 2.7%E (y/y fastest pace since early 2018); Food price CPI y/y: 7.7% v 6.1% prior
- (CN) Pres Trump: reiterates that China wants to make a trade deal 'very badly', will not do China deal unless it's a great deal
- (CN) China National Development and Reform Commission (NDRC), Industry Ministry and the natural resources ministry launch survey of rare earth in seven regions - Xinhua
- (CN) China May retail vehicle sales 1.61M, -12.5% y/y (12th consecutive decline)
- (HK) Hundreds of demonstrators said to storm road near government offices amid protests about extradition bill – financial press
- (CN) China PBoC Open Market Operation (OMO): Injects combined CNY35B in 7-day and 28-day reverse repos v CNY10B in 7-day prior; Net CNY25B drain v CNY50B drain prior
- (CN) China PBoC sets yuan reference rate: 6.8932 v 6.8930 prior
- (HK) Hong Kong legislature to reschedule today's meeting (was supposed to vote on extradition to China bill)
Other Asia
- (IN) In India there are so many unsold cars in India now that 7 of the 10 automakers in India are taking forced holidays - press
- (SG) Singapore Central Bank (MAS) June Economist Survey: Cut 2019 GDP outlook to 2.1% (prior 2.5%); sees 2020 GDP at 2.3%
- (SG) Singapore Apr Retail Sales M/M: 0.5% 1.8%e; Y/Y: -1.8% v -0.2%e
North America
- TSLA CEO Musk: There is a good shot for a record quarter; Model 3 is outselling competitors, no issues with demand; expect to reach volume product by the end of the year - annual meeting comments
- (US) Weekly API Oil Inventories: Crude: +4.9M v +3.5M prior
- UAE Energy Min (OPEC president) Mazrouei: OPEC+ is very close to an agreement extension; it's 'not a challenge' to reach a deal
- (MX) Mexico Foreign Min Ebrard: Have 45 days to show safe third country deal not needed; US wants third country deal discussed if measures fail; reiterates there is no secret agreement
Europe
- (CH) EU's Juncker: Swiss framework agreement will NOT be renegotiated
- (UK) UK Brexit Minister Barclay says he supports Boris Johnson in the PM leadership race - UK Press
Levels as of 1:20 ET
- Nikkei 225, -0.2%, ASX 200 +0.1%, Hang Seng -1.8%; Shanghai Composite -0.6%; Kospi -0.2%
- Equity Futures: S&P500 -0.1%; Nasdaq100 -0.2%, Dax -0.4%; FTSE100 -0.3%
- EUR 1.1335-1.1325 ; JPY 108.58-108.43 ; AUD 0.6964-0.6948 ;NZD 0.6589-0.6568
- Gold +0.4% at $1,336/oz; Crude Oil -1.5% at $52.46/brl; Copper -0.1% at $2.666/lb
GBP/JPY Daily Outlook
Daily Pivots: (S1) 137.59; (P) 137.96; (R1) 138.43; More...
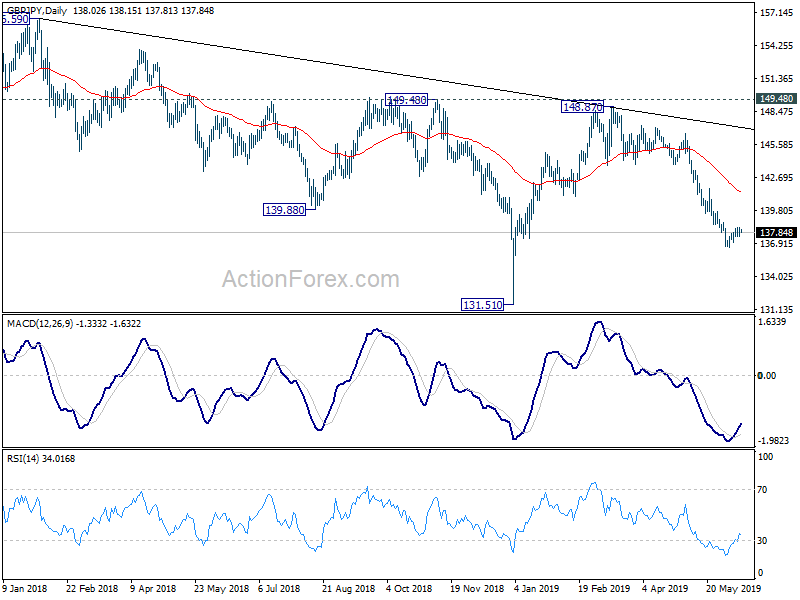
Intraday bias in GBP/JPY remains neutral as consolidation from 136.55 is extending. In case of stronger rise, upside should be limited by 38.2% retracement of 146.50 to 136.55 at 140.35 to bring fall resumption. On the downside, break of 136.55 will turn bias to the downside and extend the fall from 148.87 to 131.51 low.
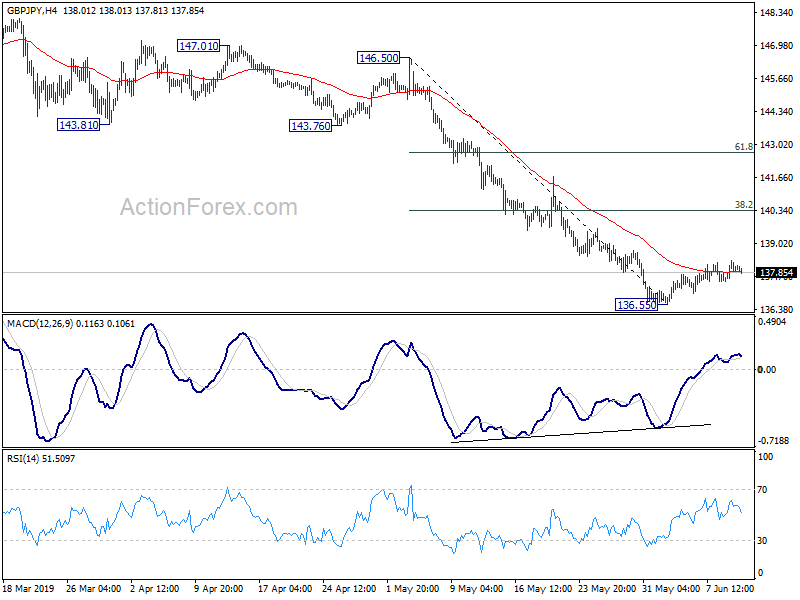
In the bigger picture, current development suggests that GBP/JPY's medium term fall from 156.59 (2018 high) is still in progress. Break of 131.51 will target 122.36 (2016 low). Structure of such decline is corrective looking so far, arguing that it's just the second leg of consolidation from 122.36. Thus, we'd expect strong support from 122.36 to contain downside to bring reversal.