

Sample Category Title
Crude Oil: Oil Trading Lower, Ahead Of EIA’s Weekly Crude Oil Stockpiles Data
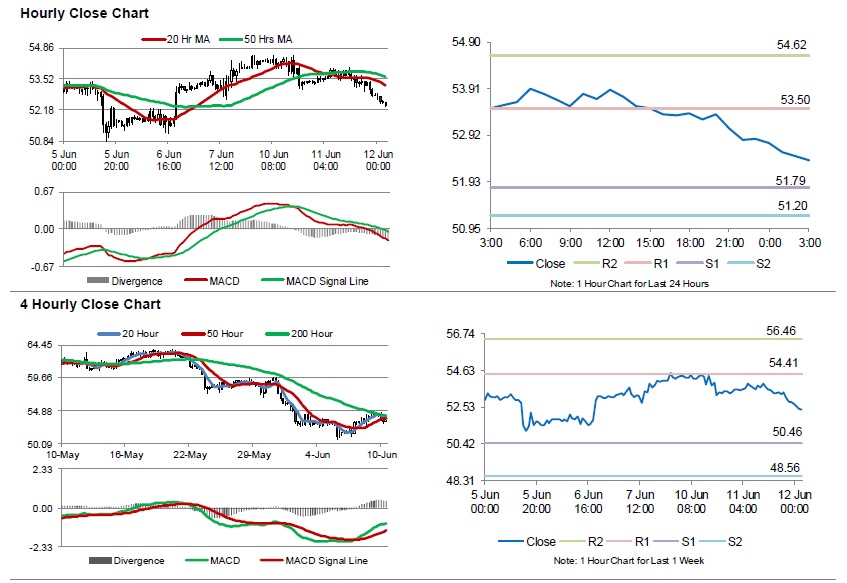
For the 24 hours to 23:00 GMT, Crude Oil declined 0.94% against the USD and closed at USD52.84 per barrel, the American Petroleum Institute (API) reported that US crude oil inventories climbed by 4.9 million barrels to 482.8 million barrels in the week ended 07 June 2019.
Meanwhile, the Energy Information Administration, in its Short-term Energy Outlook, lowered its 2019 domestic crude production outlook by 1% to 12.32 million barrels a day and 2020 output projection by 0.9% to 3.26 million barrels a day.
In the Asian session, at GMT0300, the pair is trading at 52.37, with oil trading 0.89% lower against the USD from yesterday's close.
The pair is expected to find support at 51.79, and a fall through could take it to the next support level of 51.20. The pair is expected to find its first resistance at 53.50, and a rise through could take it to the next resistance level of 54.62.
Crude oil is trading below its 20 Hr and 50 Hr moving averages.
AUD/USD Daily Outlook
Daily Pivots: (S1) 0.6949; (P) 0.6958; (R1) 0.6969; More...
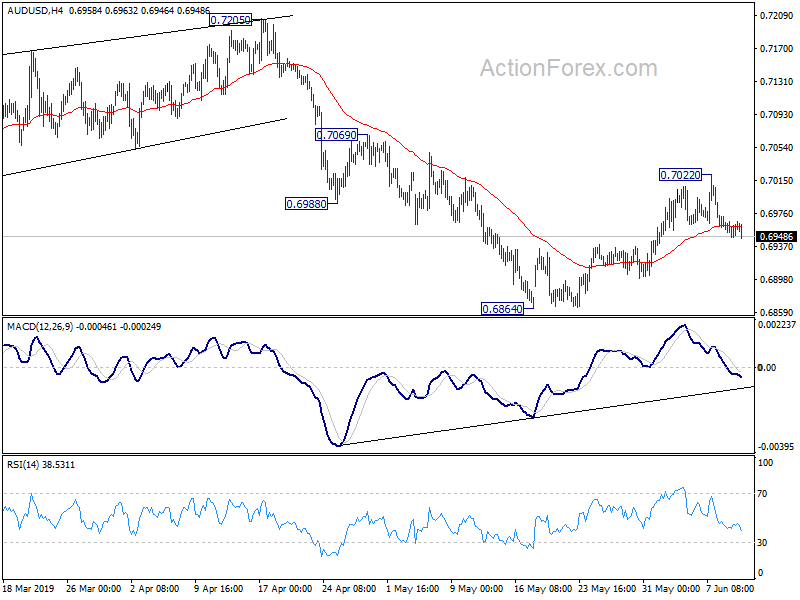
Intraday bias in AUD/USD remains mildly on the downside at this point. Corrective recovery from 0.6864 could have completed at 0.7022 already. Deeper fall would be seen back to retest 0.6864 low. Decisive break there will resume whole fall from 0.7295. On the upside, break of 0.7022 will resume the rebound to 0.7069 resistance instead.
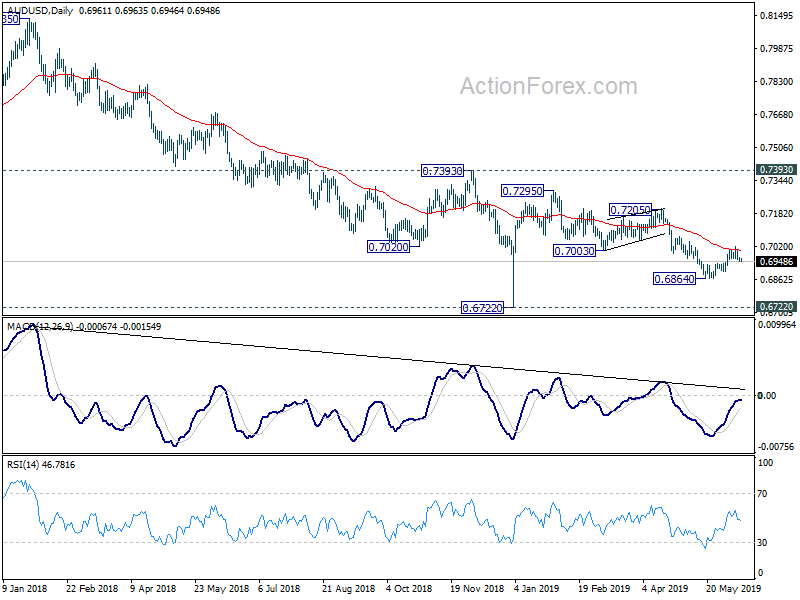
In the bigger picture, with 0.7393 key resistance intact, medium term outlook remains bearish. The decline from 0.8135 (2018 high) is seen as resuming long term down trend from 1.1079 (2011 high). Decisive break of 0.6826 (2016 low) will confirm this bearish view and resume the down trend to 0.6008 (2008 low). However, firm break of 0.7393 will argue that fall from 0.8135 has completed. And corrective pattern from 0.6826 has started the third leg, targeting 0.8135 again.
Aussie Lower on Deteriorating Consumer Sentiment, Risk Appetite Recedes Mildly
ommodity currencies trade broadly lower today as risk appetite lost momentum. Major US indices reversed earlier gains to close mildly lower. Asian stocks generally follow with the exception of Singapore. Aussie is also weighed down by deteriorating consumer sentiment. Swiss Franc and Yen gearing up some momentum but for now, Euro and Dollar are not too far behind. Activity could be subdued with a very light European session. ECB President Mario Draghi is scheduled to speak but he isn't expected to say anything different from his press conference less than a week ago.
Technically, EUR/AUD's rally continues today and is on track to 1.6410 projection level. AUD/USD's downside momentum is not too convincing. But it should still be heading back towards 0.6864 low. USD/CHF, USD/JPY and USD/CAD are staying in near term consolidations. But all three pairs remain bearish for now. US CPI could be the trigger for downside breakout later in the day. At the same time, gold is back at 1332 after drawing support from 1320 handle. It's probably heading back to 1347 resistance.
In Asia, currently, Nikkei is down -0.09%. Hong Kong HSI is down -1.59%. China Shanghai SSE is down -0.57%. Singapore Strait Times is up 0.18%. Japan 10-year yield is up 0.0052 at -0.105. Overnight, DOW reached as high as 26248.67 but closed down -0.05% at 26048.51. S&P 500 dropped -0.03%. NASDAQ dropped -0.01%. 10-yer yield dropped -0.003 to -2.140.
Trump tells China: Go back to that deal or I have no interest
Trump said he's now holding up the deal with China and he's only interested if China goes back to "that deal" before negotiations collapsed. He said, "it's me right now that's holding up the deal... We had a deal with China and unless they go back to that deal I have no interest."
While Trump might meet Chinese President Xi at G20 in Osaka later this month, expectations are generally low. White House Acting Chief of Staff Mick Mulvaney it's an opportunity to get talks "hard-wired again." However, he added, "I do not see the president's meeting as a deal closer."
US Commerce Secretary Wilbur Ross also said "At the G20, at most it will be ... some sort of agreement on a path forward, but certainly it's not going to be a definite agreement. Though he added, "Eventually, this will end in negotiation. Even shooting wars end in negotiations."
RBA rate cuts failed to lift consumer sentiments
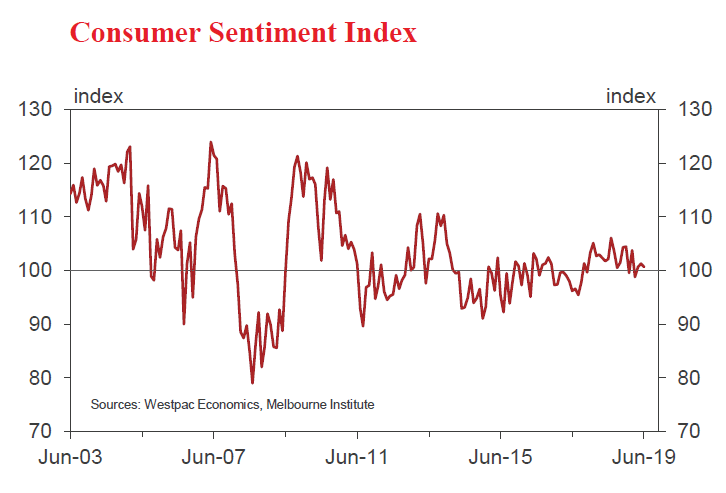
Australia Westpac Consumer Confidence dropped -0.6 to 100.7 in June. Westpac noted that it's a "disappointing result" given the RBA's rate cut on June 4. Also, the results suggests "deepening concerns about the economy have outweighed the initial boost from lower rates. " Looking at some details, economic expectations for the next 12 months dropped -4.7 to slightly pessimistic territory at 99.3. Though, House Price Expectations Index rose notably by 22.7 to 109.7, in clear response to the rate cut.
Westpac also said "initial sentiment reaction to the June rate cut will be somewhat disappointing for the Bank". After disappointing Q1 GDP, RBA will need to "make a further downgrade to its growth forecasts". And "the case for further policy easing remains clear". Westpac expects another 25bps cut in August.
Elsewhere
China CPI accelerated to 2.7% yoy in May, up from 2.5% yoy. PPI slowed to 0.6% yoy, down from 0.9% yoy. Both matched expectations. Japan domestic CGPI rose 0.7% yoy in May, matched expectations. Machine orders rose 5.2% mom in April, much better than expectation of -0.8% mom contraction.
Looking ahead, US CPI will be the major focus. Headline CPI is expected to slow from 2.0% yoy to 1.9% yoy in May. CPI core is expected to be unchanged at 2.1% yoy.
AUD/USD Daily Outlook
Daily Pivots: (S1) 0.6949; (P) 0.6958; (R1) 0.6969; More...
Intraday bias in AUD/USD remains mildly on the downside at this point. Corrective recovery from 0.6864 could have completed at 0.7022 already. Deeper fall would be seen back to retest 0.6864 low. Decisive break there will resume whole fall from 0.7295. On the upside, break of 0.7022 will resume the rebound to 0.7069 resistance instead.
In the bigger picture, with 0.7393 key resistance intact, medium term outlook remains bearish. The decline from 0.8135 (2018 high) is seen as resuming long term down trend from 1.1079 (2011 high). Decisive break of 0.6826 (2016 low) will confirm this bearish view and resume the down trend to 0.6008 (2008 low). However, firm break of 0.7393 will argue that fall from 0.8135 has completed. And corrective pattern from 0.6826 has started the third leg, targeting 0.8135 again.
Economic Indicators Update
| GMT | Ccy | Events | Actual | Forecast | Previous | Revised |
|---|---|---|---|---|---|---|
| 23:50 | JPY | Domestic CGPI Y/Y May | 0.70% | 0.70% | 1.20% | 1.30% |
| 23:50 | JPY | Machine Orders M/M Apr | 5.20% | -0.80% | 3.80% | |
| 0:30 | AUD | Westpac Consumer Confidence Jun | -0.60% | 0.60% | ||
| 1:30 | CNY | CPI Y/Y May | 2.70% | 2.70% | 2.50% | |
| 1:30 | CNY | PPI Y/Y May | 0.60% | 0.60% | 0.90% | |
| 12:30 | USD | CPI M/M May | 0.10% | 0.30% | ||
| 12:30 | USD | CPI Y/Y May | 1.90% | 2.00% | ||
| 12:30 | USD | CPI Core M/M May | 0.20% | 0.10% | ||
| 12:30 | USD | CPI Core Y/Y May | 2.10% | 2.10% | ||
| 14:30 | USD | Crude Oil Inventories | 6.8M |
Elliott Wave View Calling For Extension Higher In Oil
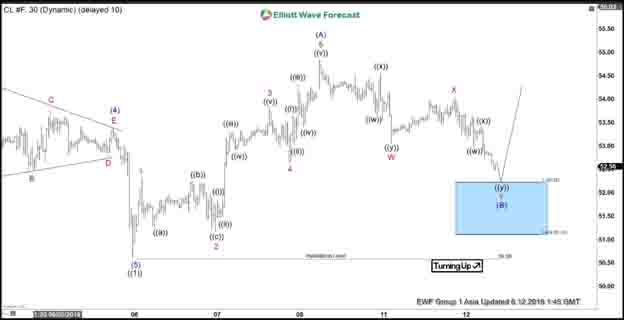
Elliott wave view suggests the decline to 50.58 in Oil ended wave ((1)). Up from there, the rally unfolded as a 5 waves impulse Elliott Wave structure. Wave 1 ended at 52.32, wave 2 pullback ended at 51.17, wave 3 ended at 53.83, wave 4 ended at 52.62, and wave 5 ended at 54.84. We can see from the chart both wave 3 and 5 subdivides into another impulse of lesser degree. This 5 waves move higher ended wave (A) in higher degree. The instrument is now correcting cycle from June 5 low within wave (B) as a double three structure.
Wave W of (B) ended at 53.05, wave X of (B) ended at 54.04, and wave Y of (B) should find buyers at 51.1 – 52.22 blue box area. The instrument should then resume higher in wave (C) from this area or at least bounce in 3 waves. We don’t like selling Oil and expect another leg higher as far as pivot at 50.58 low stays intact. If Oil breaks below 50.58, then it’s possible to count the 5 waves move up from 50.58 low as part of wave C Flat from June 3 low (52.11).
Oil (CL_F) 1 Hour Elliott Wave Chart
RBA rate cuts failed to lift consumer sentiments, AUD/JPY vulnerable
Australia Westpac Consumer Confidence dropped -0.6 to 100.7 in June. Westpac noted that it's a "disappointing result" given the RBA's rate cut on June 4. Also, the results suggests "deepening concerns about the economy have outweighed the initial boost from lower rates. " Looking at some details, economic expectations for the next 12 months dropped -4.7 to slightly pessimistic territory at 99.3. Though, House Price Expectations Index rose notably by 22.7 to 109.7, in clear response to the rate cut.
Westpac also said "initial sentiment reaction to the June rate cut will be somewhat disappointing for the Bank". After disappointing Q1 GDP, RBA will need to "make a further downgrade to its growth forecasts". And "the case for further policy easing remains clear". Westpac expects another 25bps cut in August.
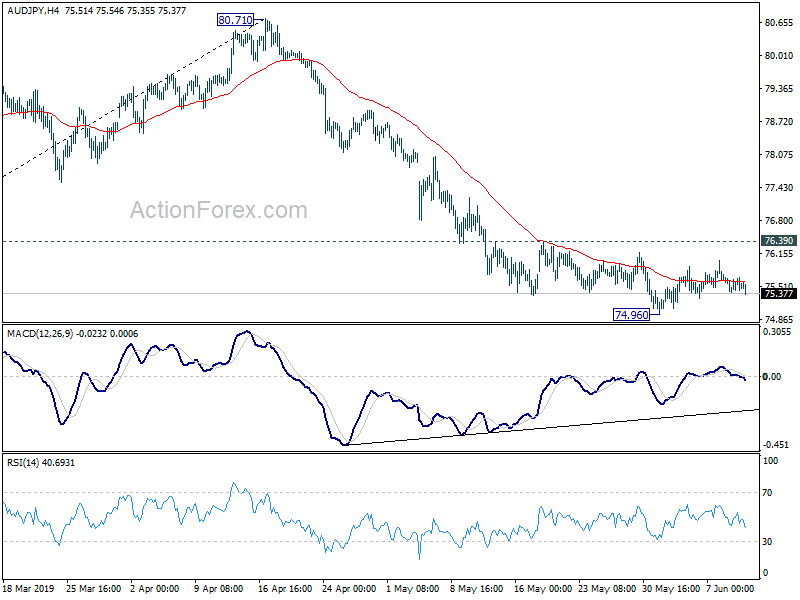
AUD/JPY is staying in consolidations above 74.96 temporary low for looks vulnerable For now, further decline is expected as long as 76.39 minor resistance holds. Break of 74.96 will resume the fall form 80.71.
Yuan Steady As China Inflation Accelerates
Prices up most in more than a year
China's inflation met expectations in May, confirming an acceleration to +2.7% y/y from +2.5% in April. That's the fastest pace since February 2018, and was mostly led by food prices, with pork prices rising 18.2% y/y and fruit prices 26.7%.
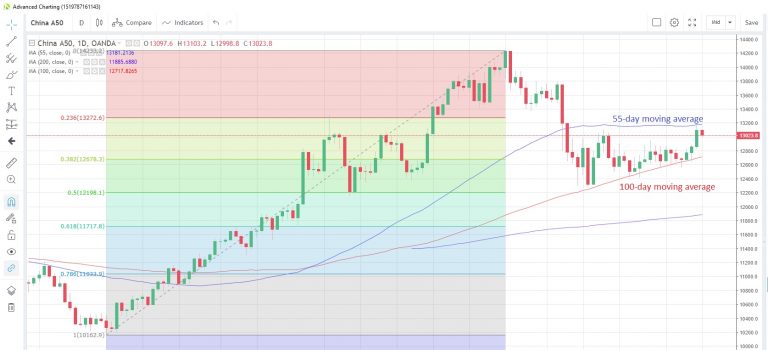
The China50 index traded negatively for the first time in four days, retreating from 55-day moving average resistance at 13,181. Shares were already trading in the red before the data after US President Trump he was delaying any China trade deal until the G-20 meeting since China had allegedly reneged of earlier concessions. The index is currently down 0.52% and could have its eyes on the 100-day moving average at 12,717.
China50 Index Daily Chart
The negative vibes had a knock on effect with most other indices, with Wall Street indices down between 0.07% and 0.17% while the Japan225 index managed to climb 0.06%. The offshore yuan was steady, losing just 0.02% against the greenback, while other beta-risk currencies slid in a broader mild risk-off environment.
Hong Kong protests
Protest against a new proposed extradition law with China appear to be escalating. Following on from weekend protests, crowds are blocking key roads next to government offices as the bill is due for its second round of debate today in Hong Kong's 70-seat Legislative Council. Press reports that police were using pepper spray on protesters. The local stock exchange came under pressure, with the HongKong33 index dropping 1.38% to 27,315 and giving back almost half of Monday's gains.
The Hong Kong dollar was more sanguine, gaining almost 0.1% versus the US dollar but staying close to the upper band threshold of 7.85.
ECB speakers out in force
There are no major economic data releases for either Germany or the Euro-zone today, but we have a slew of central bank speakers. ECB President Draghi is slated to speak along with board members De Guindos and Coeure.
The main event for the US session will be the release of May's CPI data. Expectations are for a slight drop to 1.9% y/y from 2.0% in April. The data could define the next steps for the Fed, with a lower number likely fueling speculation that a Fed rate cut could come sooner rather than later. At the moment, market pricing is suggesting a 16% chance of a cut at the June meeting but 78% chance of one in July.
Market Morning Briefing: Euro Is Holding Well Above 1.13
STOCKS
Equities continue to remain positive. Though the Dow has dipped, the supports can limit the downside and push it higher again. DAX has risen past a key resistance and can rise further. Nikkei and Shanghai also looks bullish to extend its upmove in the near term. On the contrary, India's Sensex and Nifty seems to lack strength and likely to remain in a sideways range.
The resistance at 26250 on the Dow (26048.41, -14.17, -0.05%) is holding as expected for now. However, the key supports at 26000 and 25750, which can be tested in the near term, can limit the downside and keep the bullish outlook intact for a test of 26500-26600.
As against our expectation, DAX (12155.81, +110.43, 0.92%) has risen breaking above 12100 and has turned the near-term view bullish. While above 12100, DAX can now move up to 12300 in the coming sessions.
Nikkei (21210.94, +6.66, +0.03%) has risen past 21200 as expected. While above 21000, the outlook is bullish to test 21500 and 21750 in the coming days. A break above 21250 can accelerate the rally.
Shanghai (2919.35, -6.36, -0.22%) has dipped slightly after witnessing a sharp rally yesterday. A test of 2950 - the upper end of the 2835-2950 is likely now. If it continues to sustain above 2900 in the coming days, the possibility of see an upside breakout above 2950 is high going forward which will then pave way for a test of 3000.
Sensex (39950.46, +165.94, +0.42%) and Nifty (11965.60, +42.90, +0.36%) have been inching higher, but at a slower pace signaling lack of strength. The indices can remain range bound for some time. Nifty can trade in the 11800-12200 while the Sensex can remain range bound between 39300 and 40300.
COMMODITIES
Gold and copper can dip in the near term while silver can trade sideways before a fresh fall. Brent and WTI have declined below their intermediate support and are signaling the resumption of the broader downtrend.
Gold (1326.40) fell to test 1320 as expected yesterday and has bounced from there. The near-term view remains negative for a fall to 1315-1310. A break below 1320 can accelerate the downmove.
The support at 15.6 on Silver (14.69) is holding as of now. Silver may consolidate between 14.6 and 14.8 before testing 14.5-14.4 on the downside. While below 15, the broader bearish view is intact to test 14.25-14 over the medium term.
Copper (2.67) spiked to 2.70 and has come-off from there. While below 2.70, the near-term view is negative to test 2.62-2.60 on the downside. A strong rise past 2.70 will prove our bearish view wrong which will then pave way for 2.75-2.77 on the upside.
Brent (61.54) has declined below 62 and is signaling the resumption of the downtrend. It can test 60 again and eventually fall to 57 and 55 in line with our long-term bearish view.
WTI (52.55) can fall to 51 and 50 in the near term. The long-term bearish outlook is intact to test 45 on the downside.
FOREX
Currencies signal a near-term weakness in the dollar. The Euro and Euro-Yen are bullish while the Dollar-Yen is bearish. The Dollar Index looks vulnerable to break 96.5 and fall to 95.8 in the coming days. Aussie holding above a key support, but looks vulnerable to break below it. Pound can continue to trade sideways.
Dollar Index (96.69) is consolidating between 96.5 and 97 as expected. While below 97, the outlook is bearish for the index to break 96.5 and fall to 95.8
Euro (1.1312) is holding well above 1.13 and is bullish in the near term to test the crucial resistance level of 1.1370. A strong rise past 1.1370 could boost the momentum for a further rise. But while 1.1370 holds, a corrective dip to 1.1300-1.1270 is possible.
Euro-Yen (122.85) has been inching higher consistently over the last few days. The uptrend is intact to test of 124. Support is at 122.
The corrective bounce in the Dollar-Yen (108.49) seems to be losing steam indicating that the resistance in the 109-109.50 region could be holding well.. While the 109-109.5 resistance region holds, we could see the pair break below 108 and fall to 107.
Aussie (0.6956) looks vulnerable to break below key support level of 0.6950 which can take it lower to 0.6935 and 0.6900 and would negate the possibility of seeing a rise to 0.7000.
Pound (1.2719) retains its 1.2650-1.2750 sideways range. The bias remains positive within this range to seen an upside break above 1.2750 and a rally to 1.2800-1.2850 in the coming days.
The support at 6.90 on USDCNY (6.9147) is holding well. While above this support the outlook will be bullish and a revisit of 6.93 levels is possible in the coming days.
The resistance in the 69.60-69.65 region is holding well on the USDINR (69.4450). While below 69.65 the chances of seeing 70.00-70.10 on the upside is less and a dip to 69.25-69.20 is possible.
INTEREST RATES
The US yields have dipped yesterday. However, the near-term view remains positive for rise before we see the resumption of the broader downtrend. The 30Yr (2.61%) has support at 2.60% and can test 2.70% in the coming days. Similarly, the 10Yr (2.14%) and 5Yr (1.91%) yields have support at 2.10% and 1.90%. The 10Yr can rise to 2.20% and the 5Yr can test 1.95% on the upside.
The German yields remains stable above their key supports. The short-term view is positive. The 30Yr (0.38%) can rise to 0.50% while the 10Yr (-0.23%) and 5Yr (-0.59%) yields can test -0.10% and -0.50% respectively on the upside.
The 10YR GOI (7.1798%) has come-off sharply after testing the resistance at 7.24%. It can dip to 7.10 which in turn can pull the Dollar-Rupee lower..
Trump tells China: Go back to that deal or I have no interest
Trump said he's now holding up the deal with China and he's only interested if China goes back to "that deal" before negotiations collapsed. He said, "it's me right now that's holding up the deal... We had a deal with China and unless they go back to that deal I have no interest."
While Trump might meet Chinese President Xi at G20 in Osaka later this month, expectations are generally low. White House Acting Chief of Staff Mick Mulvaney it's an opportunity to get talks "hard-wired again." However, he added, "I do not see the president's meeting as a deal closer."
US Commerce Secretary Wilbur Ross also said "At the G20, at most it will be ... some sort of agreement on a path forward, but certainly it's not going to be a definite agreement. Though he added, "Eventually, this will end in negotiation. Even shooting wars end in negotiations."
USD/CAD Broke Key Support, Recovery Could Be Capped
Key Highlights
- The US Dollar declined heavily below the 1.3400 support area against the Canadian Dollar.
- USD/CAD is likely to face resistance near the 1.3330 and 1.3350 levels.
- The US PPI in May 2019 increased 1.8% (YoY), less than the +2.0% forecast.
- The US CPI in May 2019 could increase 0.1% (MoM), less than the last +0.3%.
USDCAD Technical Analysis
In the past few days, the US Dollar struggled against the Canadian Dollar and declined sharply from well above 1.3500. The USD/CAD pair broke the key 1.3440 and 1.3400 support levels to move into a bearish zone.
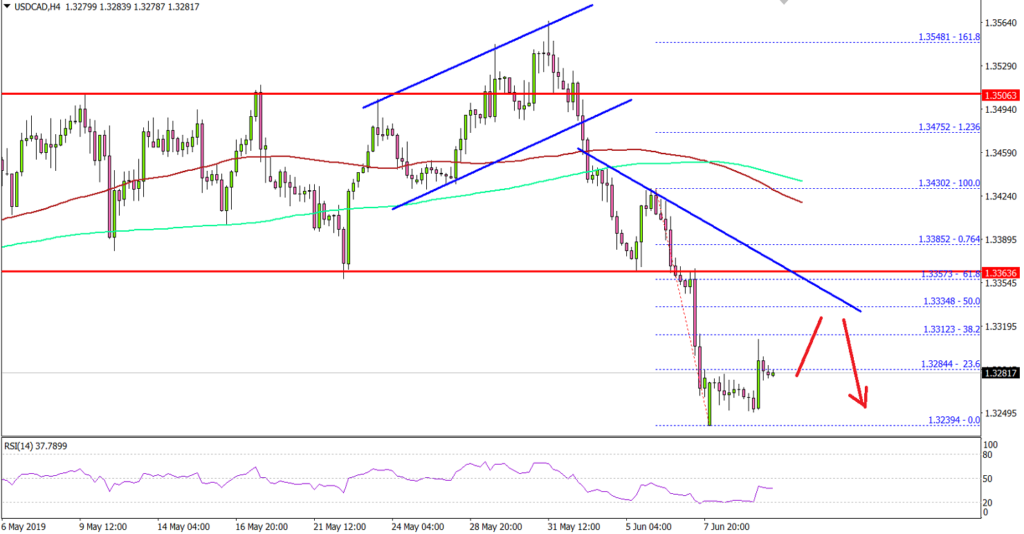
Looking at the 4-hours chart, the pair gained bearish momentum below the 1.3350 level and the 100 simple moving average (red, 4-hours). The pair even broke the 1.3300 support and settled well below the 200 simple moving average (green, 4-hours).
A new monthly low was formed near 1.3239 and recently the pair corrected higher. It cleared the 1.3280 level plus the 23.6% Fib retracement level of the last downward move from the 1.3430 high to 1.3239 low.
On the upside, there are many resistances near the 1.3320, 1.3330 and 1.3350 levels. There is also a major bearish trend line in place with resistance near 1.3350 on the same chart.
Moreover, the 50% Fib retracement level of the last downward move from the 1.3430 high to 1.3239 low is likely to prevent gains near 1.3334.
Fundamentally, the US PPI report for May 2019 was released by the Bureau of Labor statistics, Department of Labor. The market was looking for a 2.0% rise in the PPI compared with the same month a year ago.
However, the actual result was disappointing as the PPI increased 1.8% (YoY). Looking at the Producer Price Index ex Food & energy, there was a 2.3% rise, similar to the forecast.
The report stated that:
Final demand services: Prices for final demand services moved up 0.3 percent in May, the fourth consecutive increase. Most of the May advance can be traced to the index for final demand services less trade, transportation, and warehousing, which rose 0.5 percent.
Overall, USD/CAD remains in a downtrend as long as it is below the 1.3350 resistance. On the downside, an initial support is at 1.3250, below which there is a risk of a drop to 1.3200.
Economic Releases to Watch Today
- US Consumer Price Index May 2019 (MoM) – Forecast +0.1%, versus +0.3% previous.
- US Consumer Price Index May 2019 (YoY) – Forecast +1.9%, versus +2.0% previous.
- US Consumer Price Index Ex Food & Energy May 2019 (YoY) – Forecast +2.1%, versus +2.1% previous.
Daily Markets Broadcast
Wall Street closes lower on trade wait
US President Trump said yesterday he is causing a delay to the US-China trade agreement until China goes back to an earlier agreement. Inflation numbers out of China and the US will be the major events today.
US30USD Daily Chart
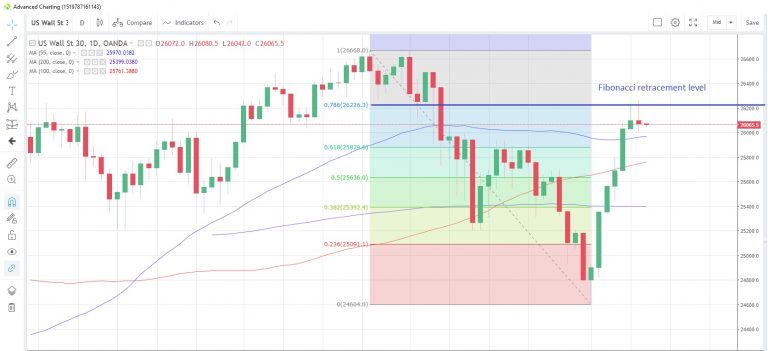
The US30 index closed slightly lower yesterday, bringing a six-day rally to a halt. The index is little changed in early trading today
The index has tested the 78.6% Fibonacci retracement of the April-June drop at 26,226 but again failed to close above it. The 55-day moving average is at 25,970 today
US consumer prices are seen rising 1.9% y/y in May, the latest survey of economists shows, a slower pace than the 2.0% recorded in April. A lower reading could stoke ideas that the Fed may soon be switching to an easing bias.
DE30EUR Daily Chart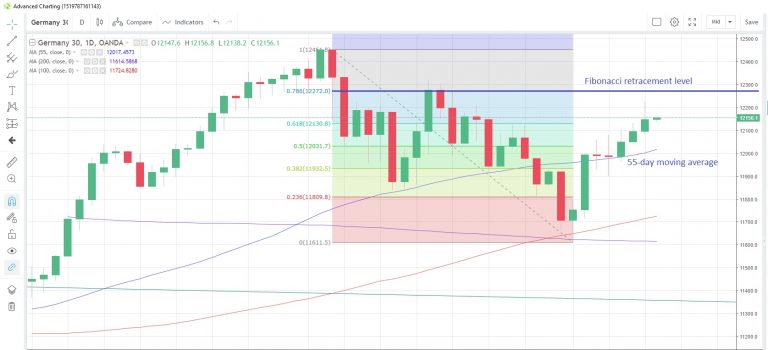
The Germany30 index touched the highest in three weeks yesterday and extended the recent bull run to a third day. There has been little change since the open this morning
The index breached the 61.8% Fibonacci retracement of the May-June drop at 12,131 and now has eyes on the 78.6% retracement at 12,272. The 55-day moving average is at 12,017 and has supported prices on a closing basis since June 3
There are no major data releases for either Germany or the Euro-zone today but ECB speakers are out in force. Speeches from Draghi, De Guindos and Coeure are scheduled.
CN50USD Daily Chart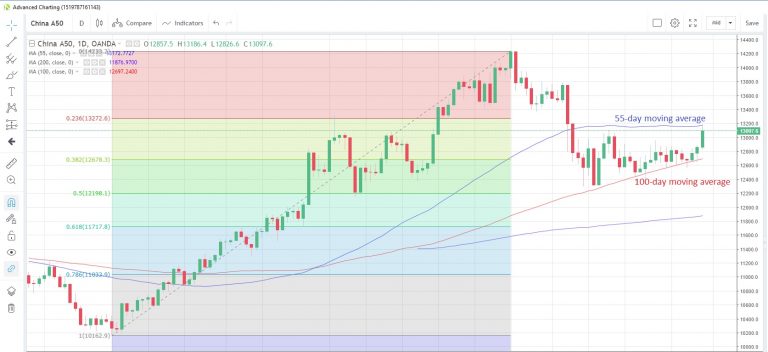
The China50 index advanced for a third consecutive day yesterday but may struggle to extend those gains today following Trump’s overnight comments regarding a trade deal
The index is testing the 55-day moving average at 13,172, which has capped prices since May 7. The 100-day moving average, now at 12,697, has supported prices on a closing basis since January 23
CPI in May is expected to rise 2.7% y/y after a 2.5% increase in April, the latest survey of economists shows. Producer prices however are showing more benign tendencies, with a slowdown to +0.6% y/y expected from +0.9% in April.