Sample Category Title
USDJPY Right Shoulder Forming
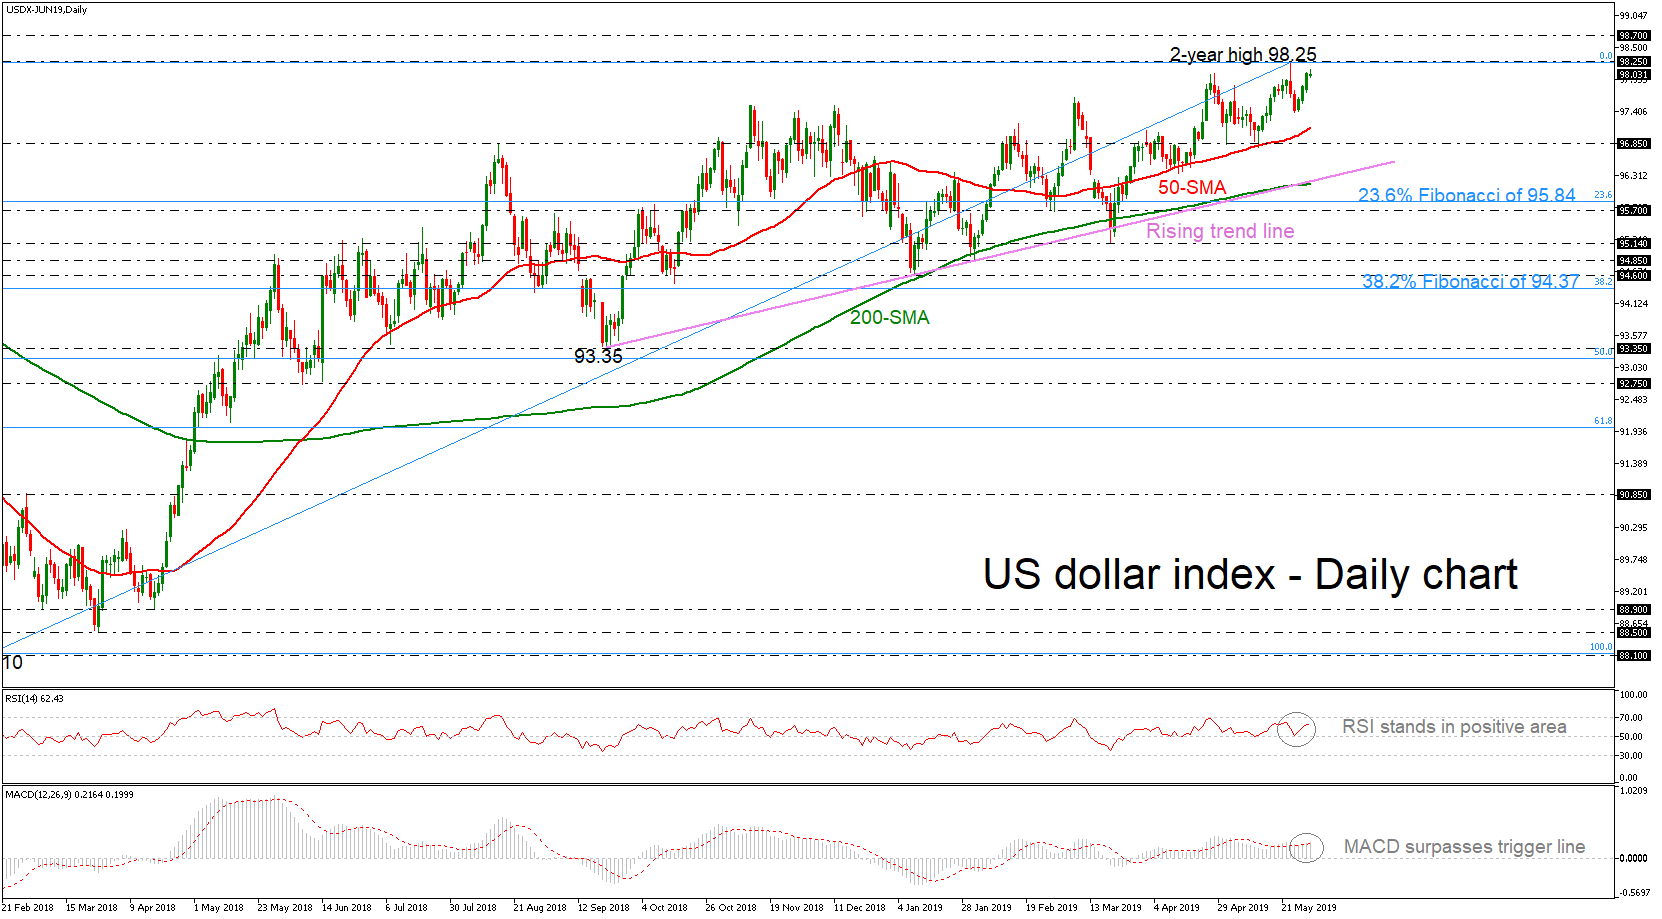
The US dollar has corrected back towards the 109.80 level against the Japanese yen currency due to an improvement in risk-on trading sentiment. The four-hour time frame shows that the recent move may be corrective, further completing a right-hand shoulder to the existing bearish pattern. A move above the 110.60 level is now needed to invalidate the bearish pattern.
The USDJPY pair is bearish while trading below the 109.80 level, key support is found at the 109.00 and 108.40 levels.
If the USDJPY pair trades above the 109.80 level, key technical resistance is found at the 110.10 and 110.60 levels.
Economic Terrorism Has Equities And Bond Yields Under Pressure
Thursday May 30: Five things the markets are talking about
Euro equities are trading a tad higher along with U.S futures following a mixed session in Asia overnight as investors continue to assess all the warning signals for global growth amid the latest trade developments.
This Thursday, China has ramped up trade rhetoric aimed at Washington. Vice Foreign Minister Zhang Hanhui indicated that provoking trade disputes is “naked economic terrorism” and that they “opposed a trade war but are not afraid of a trade war.”
U.S Treasury yields are steady but do trade atop of their two-year low yields. The much-watched yield gap between U.S 3-month T-Bills and 10's is sending a warning signal of impending recession now that it slid to a 12-year low yesterday.
Note: It's a Bank holiday (Ascension Day) in Switzerland, Germany and France and market volumes are expected to be lower.
In FX, the 'big' dollar continues to trade near its five-month high, while the EUR and GBP are steady.
Crude prices have had a difficult week as Sino-U.S trade tensions reached the highest levels with China lining up their response to the additional tariffs from the U.S. Oil prices have been dragged down by growing expectations that OPEC+ may fail to agree upon when to meet next, and more importantly if they can agree on continuing productions, while filling the void from sanctioned stricken countries.
Today's U.S revised GDP (08:30 am) should provide further clues on the health of the U.S economy while on Friday, the Fed's preferred measure of inflation, core PCE Price Index, is released (08:30 am).
On tap: CH, Fr. & DE bank holiday, US preliminary GDP & CNY manufacturing PMI (May 30), CAD GDP & U.S core PCE Price Index (May 31).
1. Stocks mixed results
In Japan, the Nikkei share average closed at a 3-1/2-month low overnight, on growing anxiety that the Sino-U.S trade dispute will be prolonged and damaging to the economy. The Nikkei fell -0.29%, its lowest close since mid-February, while the broader Topix also slipped -0.29%.
Down-under, Aussie shares closed lower, led by commodity firms and weighed by fresh exchanges in the Sino-U.S. trade war that has hurt global investor appetite. The S&P/ASX 200 index finished -0.7% lower. The benchmark has lost -2% since it scaled a decade high last week. In S. Korea, the Kospi index rebounded from its -1.3% fall in the previous session to close higher on Thursday. The index ended up +0.77% higher.
In China, equities remained under pressure as trade war fears heightened after Beijing stepped up its rhetoric against Washington. The blue-chip CSI300 index fell -0.6%, while the Shanghai Composite Index lost -0.3%. In Hong Kong, stocks hit a four-month closing low as trade woes gather sentiment. The Hang Seng index ended down -0.4%, its lowest closing level since January 24, while the China Enterprises Index closed up +0.6%.
In Europe, regional bourses have rebounded after yesterday steep losses, following higher U.S futures in a quieter day as certain European nations observe Ascension Day.
U.S stocks are set to open small in the 'black' (+0.31%).
Indices: Stoxx600 +0.35% at 371.82, FTSE +0.24% at 7,202.60, DAX +0.50% at 11,896.48, CAC-40 +0.47% at 5,246.75, IBEX-35 +0.79% at 9,151.85, FTSE MIB +0.37% at 20,074.50, SMI n/c, S&P 500 Futures +0.31%

2. Oil higher on declining U.S stocks, but trade war worries linger
Oil prices are small better bid after U.S inventory reports showed a bigger-than-expected decline in crude stocks, although concerns that the Sino-U.S trade war will trigger a global economic downturn is capping gains.
Brent crude futures are at +$69.85 per barrel, up +40c, or +0.6%, from yesterday's close. Brent fell nearly -1% on Wednesday. U.S West Texas Intermediate (WTI) crude futures are up +48c, or +0.8%, at +$59.29 a barrel.
API data yesterday showed that U.S. crude inventories fell by -5.3M barrels in the week to May 24 to +474.4M barrels. Expect dealers to take directional clues from today's official data from the EIA release (10:00 am ET).
Ex-U.S, oil prices remain supported by output cuts from OPEC+ as well as falling supplies from Iran. Data this week showed that Iranian May crude exports dropped to less than half of April levels at around +400K bpd. Crude exports remain Iran's main source of income.
Market consensus still believes that OPEC+ cuts will be extended in a meeting to be held either late June or early July, especially since Saudi Arabia wants to prevent oil prices from falling back to levels seen seven-months ago when Brent slumped to +$50 per barrel. Since OPEC+ started withholding supply in January, oil prices have risen by about +30%.
For the crude 'bears,' concerns that the trade dispute between the U.S and China will trigger a global economic downturn and a slowdown in fuel consumption is capping any significent gains for now.
Ahead of the U.S open, gold prices have fallen to one-week low overnight as sovereign bonds have rallied and the 'big' dollar trades atop a five-month high, offsetting support for the 'yellow' metal from an increasingly bitter Sino-U.S trade dispute. Spot gold is down -0.3% at +$1,275.59 per ounce, while U.S gold futures have edged -0.5% lower to +$1,274.70 an ounce.
3. Sovereign yields edge a tad higher
As month end approaches, investors seem content to square up some positions. German Bund yields have climbed for the first time in four days having hit record lows.
Despite the Ascension Day holiday in many countries in Europe, the 10-year Bund yield continues to trade rather close to its all-time lows of -0.20% as global growth fears prevail. Currently, the 10-year Bund yield trades at -0.156%, up about +1.5 bps.
Elsewhere in Europe, the wide spread level between 10-year Italian BTP's and German Bund yields continues to reflect the pending clash with the E.U over Italy's budget deficit. With both Italian deputy prime minister Salvini and the E.U eager to honor their respective mandates, has caused the spread to widen in recent days, albeit still way off levels which repeatedly triggered reconciliation nine-months ago. The 10-year BTP-Bund spread trades at +281 bps.
Note: Money Markets are now pricing in roughly two U.S rate cuts by the Fed at the start of next year and the European Central Bank (ECB) is set to turn on its “money taps” again next month as trade worries weigh on the global economy.
Stateside, the yield on 10-year Treasuries has increased +2 bps to +2.28%, the largest climb in more than a week, while the yield on two-year notes also rose +2 bps to +2.13%.
4. Dollar trades at five-month highs
As we head to the U.S open the WSJ Dollar Index, which tracks the dollar against a basket of 16 currencies, is flat, however, the 'big' dollar continues to trade at its five-month highs outright.
EUR/USD trades flat at €1.1136, close to the lowest level it has seen so far this year – it reached last week at around €1.1107. Techies believe the 'single' unit's sentiment would have to worsen significantly for the EUR to break below psychological €1.11 handle with any momentum. There is little in the way of economic data releases today that could push EUR/USD either way. Expect risk sentiment to remain the main driver.
GBP/USD (£1.2635) is also trading lower, continuing its slow grind towards the psychological £1.26 handle. With nothing new being said, just usual comments about Brexit and no data, £1.26 is expected to create worthy support in the short term.
Down-under, AUD (A$0.6931) is keeping to its tight range, but with a mild rebound overnight. Support has come despite a weak set of data which might encourage the RBA to commit to easing rates. Private capital expenditure fell -1.7% in Q1, missing market forecasts of a +0.5% reading.
5. China puts U.S soy purchases on hold as tariff war escalates
According to a Bloomberg report this morning, China, the world's largest soybean buyer, has put purchases of American supplies on hold after the trade war between Washington and Beijing escalated.
It's believed that state-grain buyers “have not received any further orders to continue with the so-called goodwill buying and don't expect that to happen given the lack of agreement in trade negotiations.”
U.S Government data indicates China bought about +13M metric tons of U.S soybeans after the countries agreed to a truce in December, in a move that showed goodwill toward getting the trade dispute resolved.
However, in February U.S Agriculture Secretary Sonny Perdue said that China had pledged to buy an additional +10M tons of soy – it's believed those purchases have now stopped.
EUR/USD – Euro Takes Pause From Slide In Thin Holiday Trade
EUR/USD has declined for a third straight day on Wednesday. Currently, the pair is trading at 1.1142, down 0.10% on the day. German markets are closed for Ascension Day, and there are no eurozone or German events. It’s a busy day in the U.S., highlighted by second estimate GDP, with an estimate of 3.1%. Unemployment claims is expected to rise to 216 thousand. On Friday, Germany and the U.S. both release inflation and consumer spending data.
The slowdown which has gripped the eurozone has also dampened growth in Germany, but the labor market has performed well and remained a bright spot. However, there was negative news in April, as unemployment rolls ballooned by 60 thousand in May, surprising the markets. The indicator has recorded consecutive declines for almost two years, and the estimate stood at -8 thousand. The unemployment rate edged up to 5.0% in May, up from 4.9% in April. The Federal Labor Agency said that the weak numbers indicate “a weakening economy on unemployment”. Trade tensions have hurt the German manufacturing and export sectors, but a tight labor market has boosted consumer spending, a key driver of economic growth.
It’s report card day for the U.S. economy, which releases Preliminary GDP. This second estimate of Q1 growth is expected to be revised downwards to 3.1%. This reading was just below the initial release of 3.2%, which easily surpassed the forecast of 2.2%. If the second estimate follows suit and beat expectations, the euro could head lower and flirt with the 1.11 level.
AUD/USD Outlook: Sideways Mode Between Two Fibo Points Extends
The Australian dollar regained traction and bounced from near-term base at 0.6913, after weaker than expected Australian housing data had no negative impact.
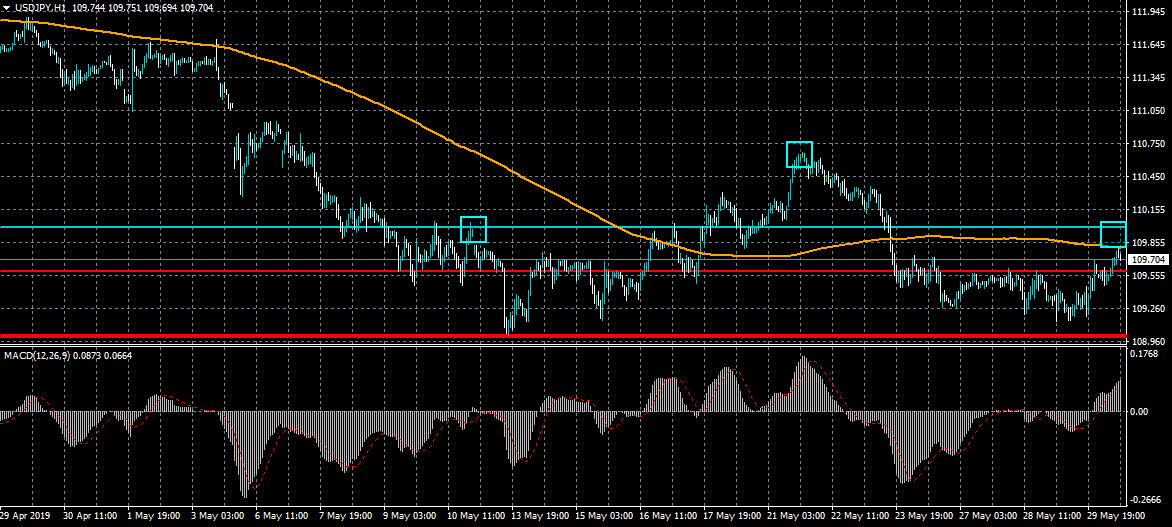
Near-term price action remains congested for the fourth straight day, limited from the downside by 0.6913 (Fibo 23.6% of 0.7068/0.6864) while falling 20SMA (0.6937) caps, guarding upper pivot at 0.6942 (Fibo 38.2% of 0.7068/0.6864).
Flat momentum and mixed setup of daily MA’s (5,10,20) supports near-term neutral tone, which needs break of either side of congestion to generate fresh direction signal.
Sustained break below congestion floor, reinforced by 10SMA (0.6905) would generate negative signal and risk retest of key support of 0.6864, where the base is forming.
Bullish scenario requires close above 20SMA and 0.6942 Fibo barrier to signal extension of recovery from 0.6864 base.
Res: 0.6937, 0.6942, 0.6966, 0.6990
Sup: 0.6913, 0.6904, 0.6881, 0.6864
EUR/USD Unlikely To Increase
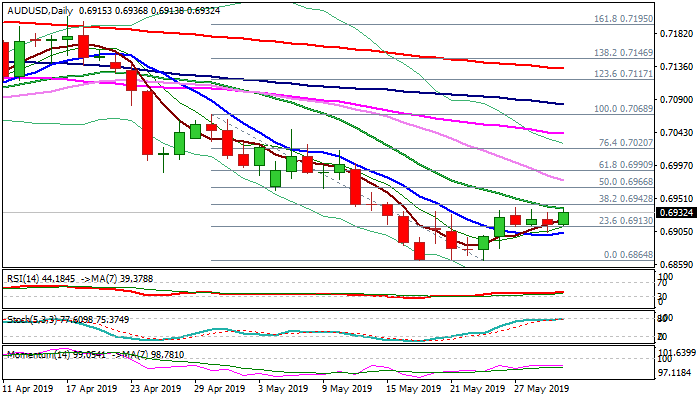
On Wednesday, the EUR/USD currency pair tumbled to the 2018/2019 minimum located at 1.1124. During today's morning, the pair was testing the given level.
If the given level holds, it is likely, that a reversal north could occur within the following trading hours. It is unlikely, that the Euro could exceed the 1.1159/1.1175 range due to the resistance cluster formed by the 55-, 100– and 200-hour SMAs, as well the weekly PP.
Otherwise, the currency pair could maintain its decline. Note, that the pair could be supported by the monthly S1 at the 1.1110 mark. However, if the given support does not hold, the rate could reach the lower boundary of the short-term descending channel located circa 1.1100.
GBP/USD Pressured By 55-, 100– And 200-Hour SMAs
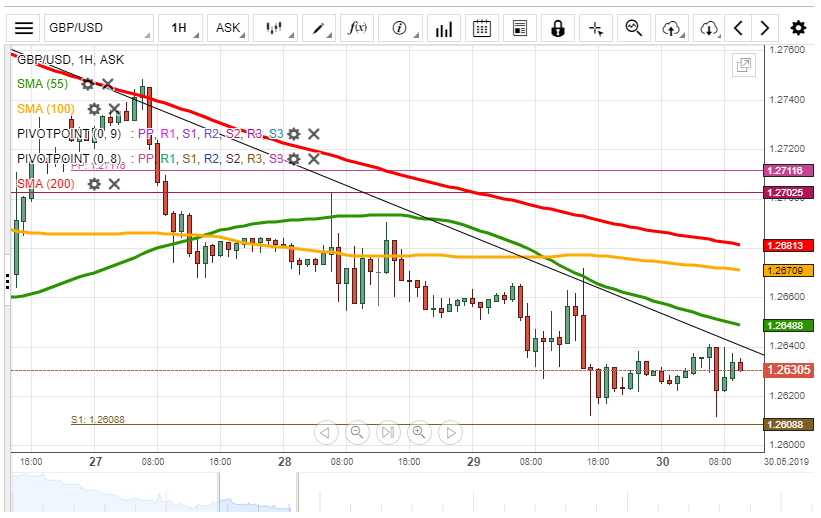
During the previous trading session, the GBP/USD exchange rate declined to the support level—the weekly S1 at 1.2609. During Thursday's morning, the rate was testing the given support.
Given that the currency is pressured by the 55-, 100– and 200-hour SMAs, currently located in the 1.2650/1.2682 range, it is likely, that some downside potential could prevail in the market. The rate could target the psychological level at 1.2580.
However, if the given support holds, it is likely, that the pair could trade sideways between it and the given resistance cluster. Also, note, that the rate could be pressured by the upper boundary of the short-term descending channel in the 1.2620/1.2640 range
USD/JPY Could Trade Down
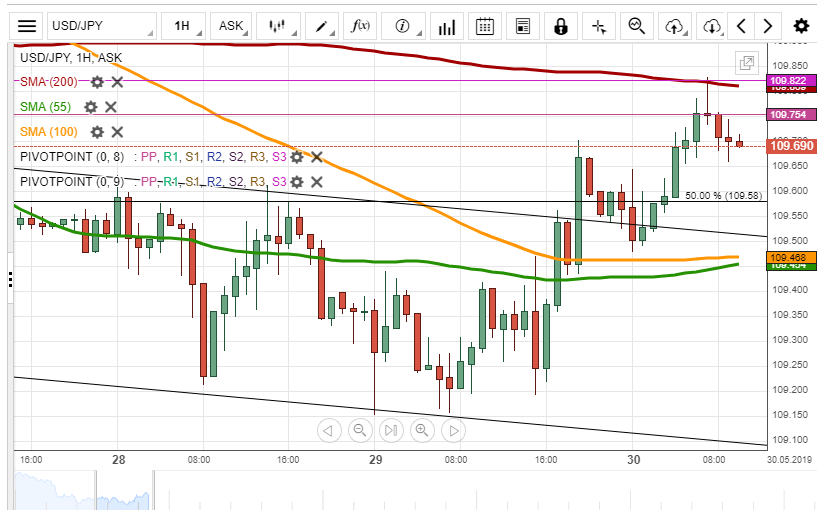
Yesterday, the USD/JPY currency pair breached the short-term descending channel north. During Tuesday's morning, the pair reached the resistance level formed by the 200-hour SMA and the weekly PP at 109.75.
If the given resistance holds, it is expected, that a reversal south could occur in the nearest future. Note, that the exchange rate has to surpass the support level—the Fibonacci 50.00% retracement at 109.58.
If the given support does not hold, it is likely, that the rate could decline to the support level formed by a combination of the 55– and 100-hour SMAs, currently located circa 109.48.
XAU/USD Likely To Tumble
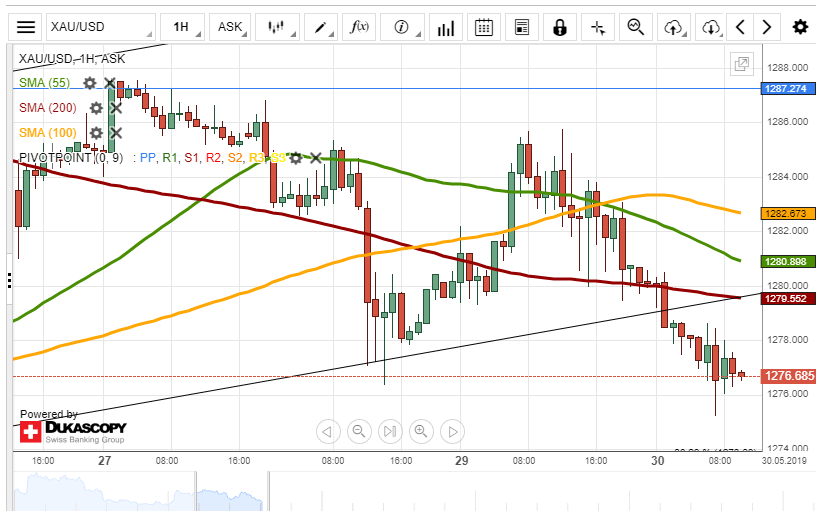
On Wednesday, the XAU/USD exchange rate dropped to the psychological level at the 1,278.00 mark. During today's morning, the rate maintained south direction.
It is expected, that the price for gold could continue to decline. A potential downside target is the support level formed by the Fibonacci 38.20% retracement at 1,273.68.
From a technical point of view, it is unlikely, that gold could exceed the 1,279.58/1,282.75 range in the short term due to the resistance cluster formed by the 55-, 100– and 200-hour SMAs.
GBPJPY Creates Bullish Doji Near 4 ½-Month Lows
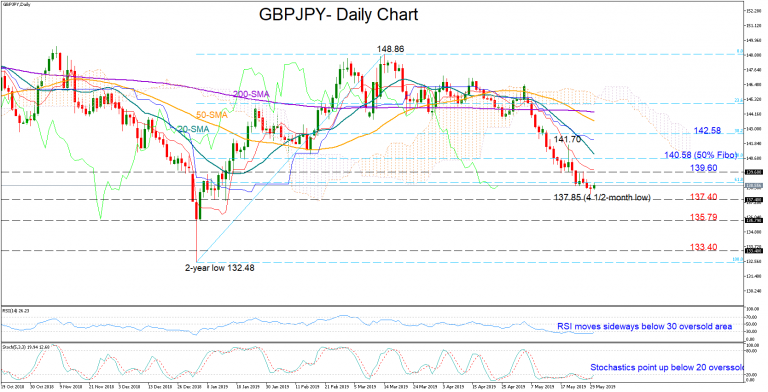
GBPJPY is in red for the fourth consecutive week, with the price pausing the sell-off at the 4 ½-month low of 137.85 on Wednesday. According to the RSI and the Stochastics, the pair is trading in oversold area and upside corrections are possible in the short term as the former hovers below 50 and the latter under 20. The bullish doji created yesterday could be another sign that a price reversal may be in progress.
Should the market beat key resistance around 139.60, the door would open for the 50% Fibonacci of 140.58 of the upleg from 132.48 to 148.86. Higher, the 38.2% Fibonacci of 142.58 could be the next target if the price manages to overcome the May 21 high of 141.70.
Alternatively, the decline may get new legs below the 137.40 strong support area, turning the spotlight towards the January 4 low of 135.79. Further down, another important barrier may appear around 133.40.
In the medium-term picture, GBPJPY is strongly bearish as long as the price holds below 142.58.
US Dollar Index Approaches 2-Year High Again, Positive Profile In Long Term
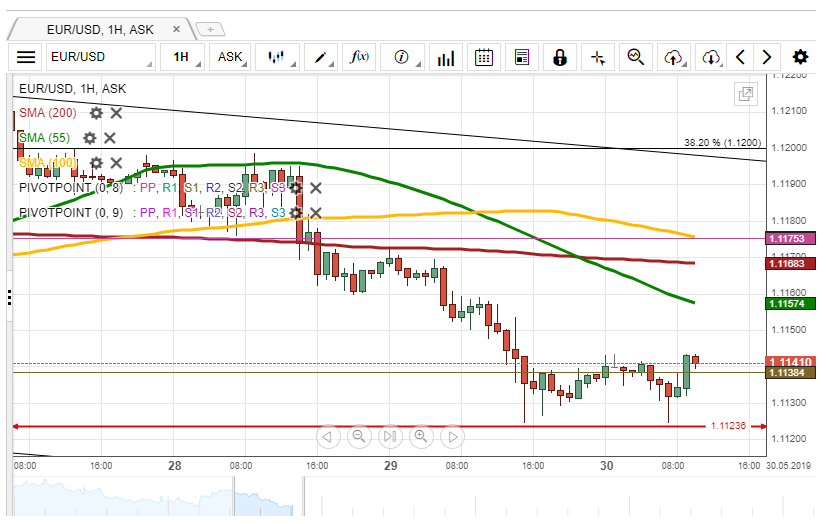
The US dollar index is edging higher towards the two-year high of 98.25 over the last three consecutive days, remaining well above the long-term ascending trend line and the moving averages. The short-term bias is tilted to the upside as the RSI indicator is turning marginally higher in the positive region, while the trigger line of the MACD oscillator is rising in the positive region.
If the index moves higher, the two-year high of 98.25 could attract traders’ attention once again and any violation above this hurdle could open the way for the 98.70 resistance, posting a higher high in the long term.
On the other hand, if the price posts a bearish retracement next support could come from the 50-day simple moving average (SMA) currently at 97.12 before touching the 96.85 hurdle. More losses could challenge the uptrend line, which overlaps with the 200-day SMA, currently at 96.18.
In the bigger picture, the dollar index has held in an upside tendency, however, looking at the very short-term, the price is trying to post a higher high confirming the ascending profile.