Sample Category Title
Daily Markets Broadcast
Stocks weaken after Trump imposes more tariffs
US indices are weaker in early trading this morning after US President Trump announced an additional 5% tariff an all goods from Mexico effective June 10. Fed's Clarida implied yesterday that a rate cut was an option, depending on economic developments. China's PMI numbers for May are due today.
US30USD Daily Chart
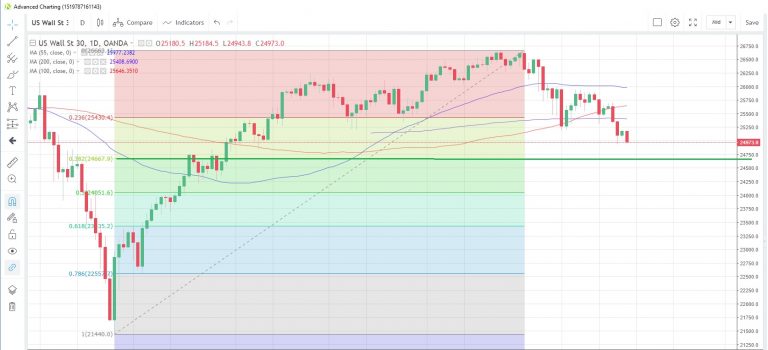
The US30 index snapped a two-day losing streak yesterday but has seen further weakness in early trading this morning after Trump announced more tariffs on Mexican imports. The index is facing its worst down-month in five months.
The index is falling toward the 38.2% Fibonacci retracement of the December to May rally at 24,668
US core personal consumption expenditure price index is seen steady at 1.5% in April, the latest survey of economists shows. A lower figure could spark speculation that the Fed may adopt a rate-cutting bias.
DE30EUR Daily Chart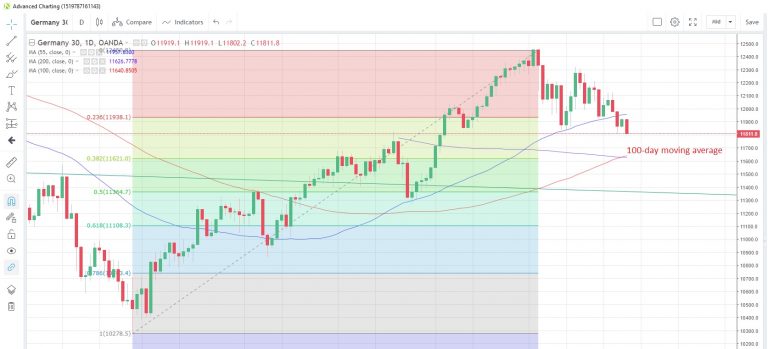
The Germany30 index has fallen to a near two-month low in early trading this morning, echoing the move seen in US indices
The index is dropping toward the 100-day moving average at 11,640, which has supported prices since February 19
Germany's retail sales are expected to rise 0.1% m/m in April after a 0.2% decline in March. CPI is expected to fall to +1.6% y/y in May from +2.0% last month.
CN50USD Daily Chart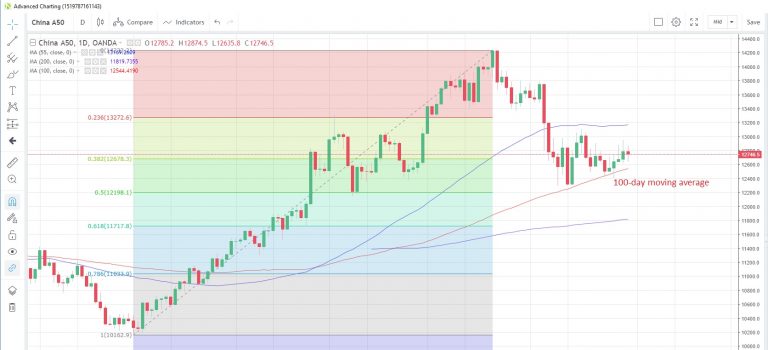
The China50 index fell for the first time in five days yesterday and, given Trump's latest move on the tariff front (even though it was with Mexico), could feel further pressure today
The index is holding above the 100-day moving average at 12,544, as it has done on a closing basis since January 23
China's manufacturing PMI is seen dropping below the 50 contraction/expansion threshold again in May, which would be the fourth time in six months. Expectations are fro a drop to 49.9 from 50.1, but a worse reading could pile additional pressure on Chinese stocks.
Eco Data 5/31/19
[php_everywhere instance="1"]
Loonie Awaits Q1 GDP Growth on Friday
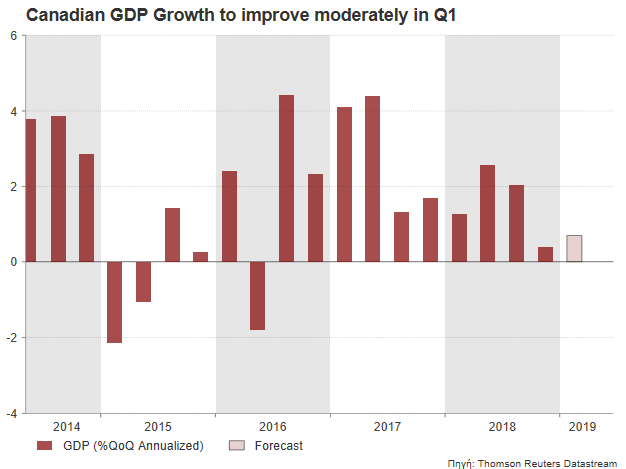
The Bank of Canada reiterated at its policy meeting on Wednesday that the economy will likely pick up growth in the second quarter of 2019. Market specialists, however, predict that GDP growth data could show early signs of recovery on Friday at 1230 GMT despite the global trade risks.
After recording the smallest expansion of 0.4% in more than two years in Q4, the Canadian annualized GDP growth is expected to have inched up to 0.7% q/q in the first three months of this year. While such an outcome would still undershoot the two-year average of around 2.4%, investors could raise their confidence in the economy as the continued jobs growth and further improvement in average hourly earnings shows that economic weakness in previous quarters was likely temporary.
The decision by the US administration to remove tariffs on Canadian aluminum and steel imports earlier this month provides additional reasoning why Canada could experience better days ahead. Getting rid of the tariffs, Canada could move with ratifying the new USMCA trade deal before national elections in October, creating a more fruitful environment for exports and investments. The endless trade dispute between Washington and Beijing, however, remains a source of uncertainty for the commodity-depended economy and a cause of caution for the BoC policymakers who wisely wait for all sides to secure an agreement before hiking rates. Note that trade relations between Canada and China are also at a freezing point after the arrest of Huawei’s finance chief in Vancouver in December on a US warrant.
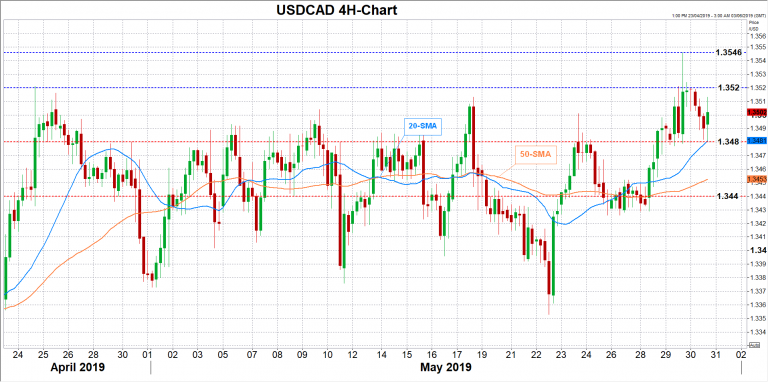
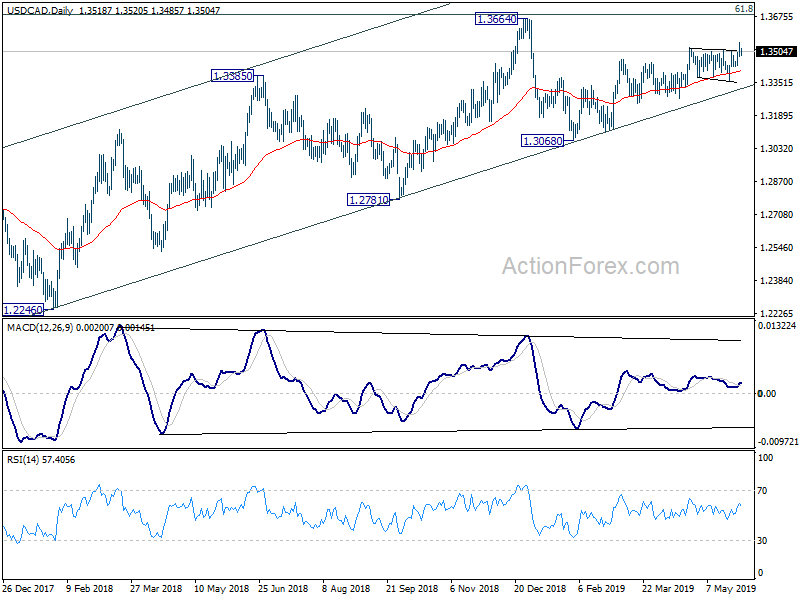
In market reaction, the loonie may attract demand should GDP growth beat expectations, but gains could appear limited as the BoC has clearly signaled that steady interest rates are the appropriate policy for current conditions. In such a case, USDCAD could shift south to retest support between 1.3480 and 1.3440.
In the negative scenario, lower than expected readings could undermine hopes for a stronger economic recovery in the second quarter, helping USDCAD to reach resistance between 13520-1.3546. A bigger disappointment could also open the door for the 1.36 level.
Recession Update: Elevated Interest, Low Risk
The recent inversion of the yield curve has elevated investors' interest in the risk of a recession. However, our models indicate a low probability that a recession will occur within the next six months.
Inverted Yield Curve and Recession: Mirage or Reality?
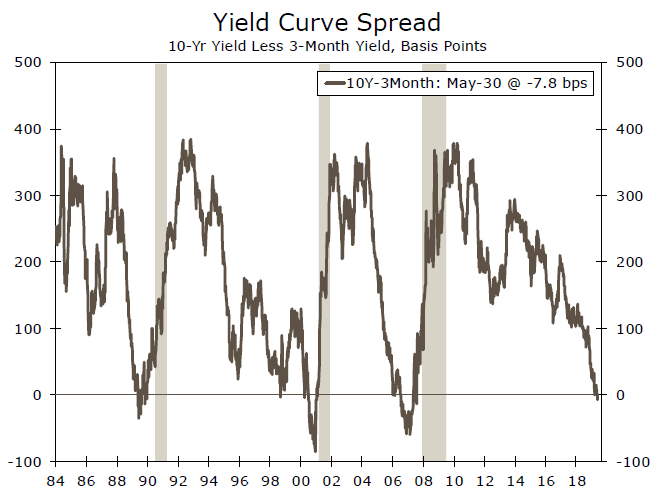
The recent inversion of the yield curve has brought heightened market sensitivity to an imminent recession and caused analysts to question the yield curve as a reliable recession indicator. As we have previously discussed, the depth and duration of the inversion is important to predict an imminent recession.1 For example, before the last two recessions, the spread of the 10-year note over the 3-month bill fell to as little as -60 bps in early 2007 and to nearly -100 bps in late 2000. The yield curve remained in negative territory for several consecutive months prior to the last three recessions (top chart). While the curve stayed above the zero line in April, in late March the spread slipped into the negative zone for the first time in the post-Great Recession era, and fell to -12 bps on May 29. Compared to historical standards, the current inversion is very shallow, and the depth and duration do not indicate a recession in the near-term. In our opinion, the yield curve would need to invert significantly and for a longer duration to be a reliable recession signal. Furthermore, the Federal Reserve's quantitative easing (QE) program may have affected the yield curve, depressing longer-term yields and making the curve more inverted than it may otherwise be. Essentially, because of the QE purchases, the yield curve needs to invert even further than it did in the past and stay there for longer before we would feel more confident in making a recession call.
Recession Probability Models
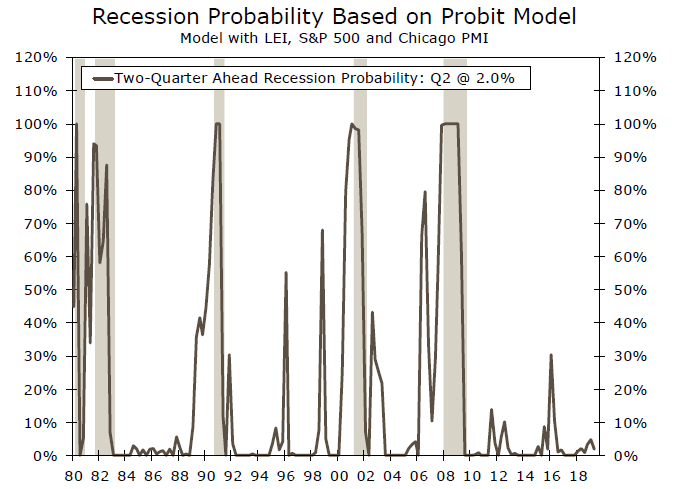
Our official Probit model estimates the probability of a recession during the next six months. We built the model in 2007 and over the past 12 years it has helped us to accurately predict recessionary periods. Using data through April 2019, our model suggests a meager 2.0% chance of a recession in the shortrun (middle chart).2
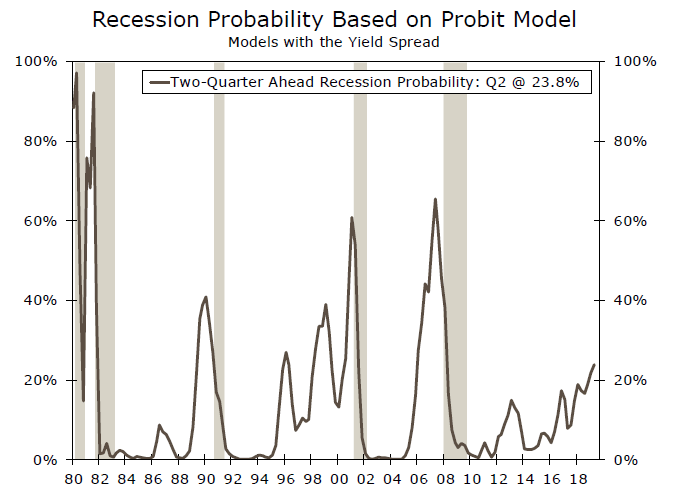
Our Probit model that uses the yield curve as a predictor estimates a 23.8% probability of a recession during the next six months. Although elevated (highest in the post-Great Recession era), the probability of a recession remains below previous thresholds associated with a recession (bottom chart). The model predicted a 55% probability in Q1-2007 and a 61% probability in Q1-2001.
The recent inversion of the yield curve is interesting but it is the only indicator in our model that is suggesting trouble may be lurking around the corner. The index of Leading Indicators (LEI) is healthy, with the average monthly growth rate at 0.16% this year. The stock market remains generally supported and employment growth is positive. Acknowledging downside risks to the outlook, we would need to see a further sustained inversion of the curve, along with a generalized restriction in financial market conditions and deterioration in the economic fundamentals to become more worried about the sustainability of the economic expansion.
1 See "Inverted Yield Curve: Is It Different This Time?" (March 26, 2019).
2 See "Recession Update: Should We Worry?" (April 01, 2019).
New Zealand Dollar Close to 7-month Low on Trade Jitters, Business Pessimism
The New Zealand dollar is steady on Thursday, after considerable losses on Wednesday. In North American trade, NZD/USD is trading at 0.6507, down 0.07% on the day. On the release front, New Zealand released the annual budget. In the U.S., U..S Preliminary GDP came in at 3.1%, matching the forecast.
With the trade war between the U.S. and China in full swing, it’s no surprise that the business sector in New Zealand is deeply pessimistic about economic conditions. China is a major trading partner, with some 25% of New Zealand exports going to the Asian giant. The ANZ Business Confidence survey remains mired deep in negative territory. Still, the indicator moved slightly higher in May, good enough for a 3-month high. Meanwhile, the semi-annual RBNZ Financial Stability Report stated that financial risks had not increased since the last report in November. The bank circled high consumer debt and New Zealand’s exposure to global developments as the main points of concern.
The U.S. economy continues to perform well, as growth remains above the 3.0% level. The second estimate GDP showed a gain of 3.1%, matching the estimate. This was just shy of the initial estimate in April, which came in at 3.1%. The U.S. economy is firing on all cylinders while New Zealand’s growth has been dampened by the slowdown in China, a key trading partner. Investors are understandably wary about the kiwi, which has fallen below 0.65 on Thursday. Last week, NZD/USD touched a low of 0.6581, its lowest level since late October.
FTSE Rebounds but Trade Tensions Persist
The FTSE has posted gains on Thursday, after two losing sessions. Currently, the FTSE index is trading at 7,221, up 0.50% on the day. In the U.S., Preliminary GDP came in at 3.1%, matching the forecast. In the U.K., GfK Consumer Sentiment is expected to remain deep in negative territory, with an estimate of -12 points.
Reports that China has raised the ante in a bitter trade dispute have rocked global equity markets on Wednesday. Chinese media has reported that China is threatening to curb the supply of rate metals to the U.S. These products are used in the production of items such as cell phones and electric cars, so any interruption in supply could hurt U.S. technology companies. Technology company listings on the FTSE, such as Micro Focus and Vodafone, posted sharp losses on Wednesday. Investors remain jittery over escalating tensions between the U.S. and China, and this latest salvo from China is a reminder that the trade dispute continues to cause turmoil on the equity markets.
The Bank of England is anticipating soft economic growth for the U.K. Earlier in May, the bank’s projected growth of 1.5% in 2019 and 1.6% in 2020, and that is on the assumption that the Brexit process goes smoothly. On Thursday, Deputy Governor Dave Ramsden took issue with his MPC colleagues, saying that he is more pessimistic about the economic outlook and believes that growth will be less than the bank’s forecast. Ramsden warned that a no-deal Brexit without a transition period would have “large negative economic effects”. Ramsden added that even if the U.K. crashed out of the EU without a deal, it did not automatically mean that interest rates should be cut.
WTI oil heading back to 56.92 after brief and weak recovery
WTI crude oil drops sharply as data show less than expected decline in oil inventory. In the week ending May 24, commercial oil inventories decreased by 0.3 Mbarrels only, versus consensus of -0.9M. WTI is quickly back below 58 handle after the release.
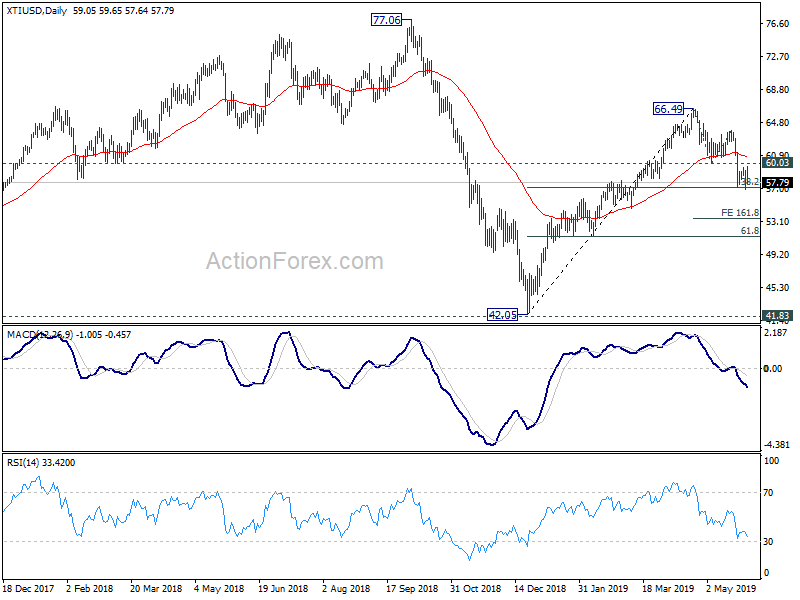
As follow up to last post here, WTI did recover after trying to draw support from 38.2% retracement of 42.05 to 66.49 at 57.15. However, as the subsequent recovery was limited well below 60.03 support turned resistance, there is no sign of bottoming yet. Focus is immediately back on 56.92 temporary low. Break there will extend the fall from 66.49 to 161.8% projection of 66.49 to 60.03 from 63.90 at 53.44.
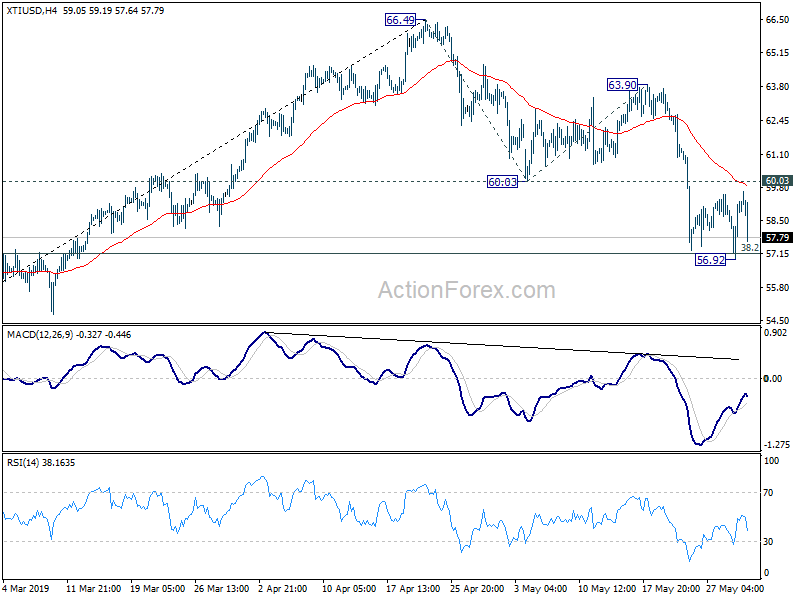
For now, we're still viewing the decline from 66.49 as a corrective pull back. Hence, while's it's likely deeper than expected, strong support should be found at 61.8% retracement of 42.05 to 66.49 at 51.38 to complete the correction.
If it happens that way, break of 56.92 in WTI should solidify the upside momentum in USD/CAD to retest 1.3664 high.
May Month End Relief Rally
May 27-31
E.U parliamentary party election results last weekend did not bring the market volatility that many had been expecting. For currency investors, the good news is that populist parties failed to secure significant inroads, while the bad news is that the political landscape remains deeply fragmented.
As we are about to close out May, global stocks are a tad higher, providing a sense of relief after several nervous sessions over fears of a slowing global economy. The bullish mood has extended to U.S bond yields, which have ticked up to +2.260% from year low yields of +2.208%.
For days, stock markets have been dropping, threatening an end to their bullish run as investors sold shares and sought safety in bonds. Trade tensions have raised concerns about the U.S and Chinese economies, leading many investors to wonder if the Fed could be forced to cut rates sooner rather than later to boost growth.
PM May’s short lifeline
Brexit issues are on pause until after the leadership election. Not sure we’ll even get the Brexit bill now although I’ve not heard anything of it being cancelled.
Central Banks
The Fed now has data that warrants rate cuts. The Fed’s favorite inflation measure, Core PCE’s second reading for Q1 showed inflation falling to +1.0% this week, well below the +2% target. The Q1 GDP reading was also revised lower from +3.1% to +3.0%. First quarter profits also declined -2.8%, much worse than the -0.4% drop seen in the prior quarter. Money Markets are now pricing in roughly two U.S rate cuts by the Fed at the start of next year, while the European Central Bank (ECB) is set to turn on its “money taps” again next month as trade worries weigh on the global economy.
On Wednesday, the European Central Bank (ECB) said in its financial stability report that while growth slowed down in the euro area in the first half of the year, “the available data suggest that the economic recovery in the euro area has been delayed but not derailed.”
Hungary Central Bank (NBH) left its Base Rate unchanged at +0.90% (as expected) for its 36th straight pause in the current easing cycle. It also left the Overnight Deposit Rate unchanged at -0.05% (as expected). Governor Matolcsy reiterated the need for cautious policy as CPI remains very volatile. We “need to look at underlying inflation: as they see dichotomy in inflationary trends. Domestic growth is seen slowing in coming quarters and that monetary policy in Euro Area may still be loose for a longer period than previously forecasted.
The Bank of Canada (BoC) kept its benchmark overnight interest rate unchanged at +1.75% while talking up the overall improvement in domestic economy. Governor Poloz said that recent data, such as record job gains in April, have “reinforced the governing council’s view that the slowdown in late 2018 and early 2019 was temporary.” Policy makers also cited expected improvements in consumer spending and exports, and pointed to improvements in business investment, the energy sector, and the housing market. As expected, BoC stressed risks associated with escalation of the Sino-U.S trade row. They also indicated a breakthrough on ratification of revised Nafta could have positive implications for Canadian exports and investment. Overall, it’s a neutral statement with a positive tilt.
In Poland’s Central Bank (NBP) May Minutes, policy makers reiterate that the Base rate is likely to stay steady in coming quarters. However, a rate cut is possible if the economy deteriorates or a rate hike is possible if inflation rises.
Iran
With market participants focused on trade war games and a potential global slowdown, developments on Iran might not be getting the attention they merit. Earlier this week, the White House threatened penalties against the financial body created by some key European nations to shield its trading with the Iran from U.S sanctions. However, expect Iran tensions to come back into focus if other risks subside.
Economic events
On the Economic Calendar it’s a Bank Holiday in New Zealand and China releases Caixin Manufacturing PMI at 09:45pm EDT (June 2).
Market concerns
- UK leadership scramble & Brexit fallout
- US-Sino – China standing firm against US
- Trans-Atlantic trade tensions to intensify
- OPEC, Saudis, Venezuela, Libya & Trump
- Iran is threatening to close the Strait of Hormuz
- Venezuela/Russia/U.S tension
- Geo-political concerns in Iran, Russia, Ukraine & France
- U.S ramps up trade talks with India and Turkey
- Italian deputy PM Salvini is threatening to end the Govt tenure
Next week: CAD GDP (May 31), NZD Bank Holiday & CNY Caixin Manufacturing PMI (Jun 2), UK inflation report hearings, USD ISM Manufacturing PMI & AUD retail sales (Jun 3), RBA monetary policy statement & AUD GDP (Jun 4), ECB monetary policy statement & press conference, CAD trade balance & CNY Bank Holiday (Jun 6), CAD & U.S employment data (Jun 7).
Wobbly Pound Breaks Below 1.26, U.S GDP Hits Estimate
GBP/USD has lost ground for a fourth straight day. Currently, GBP/USD is trading at 1.2589, down 0.30% on the day. On the release front, U..S Preliminary GDP came in at 3.1%, matching the forecast. Unemployment claims rose to 215 thousand, just shy of the estimate of 216 thousand. In the U.K., GfK Consumer Sentiment is expected to remain deep in negative territory, with an estimate of -12 points. On Friday, the U.S. releases key inflation and consumer spending data.
The Bank of England is forecasting weak growth for the economy. The bank’s May projection stands at 1.5% in May and 1.6% in 2020, and that is on the assumption that the Brexit process goes smoothly. On Thursday, Deputy Governor Dave Ramsden took issue with his MPC colleagues, saying that he is more pessimistic about the economic outlook and believes that growth will be less than the bank’s forecast. Ramsden warned that a no-deal Brexit without a transition period would have “large negative economic effects”. Ramsden added that even if the U.K. crashed out of the EU without a deal, it did not automatically mean that interest rates should be cut.
Inflation in the U.K. has been moving higher. Consumer inflation pushed above the 2% level in April, with a gain of 2.1%. This marked a 4-month high, and is good news for the BoE, which has an inflation target of 2.0%. The upward trend has continued with shop price inflation, which accelerated to 0.8% in May, up from 0.4% in the previous release.
GBP/USD Mid-Day Outlook
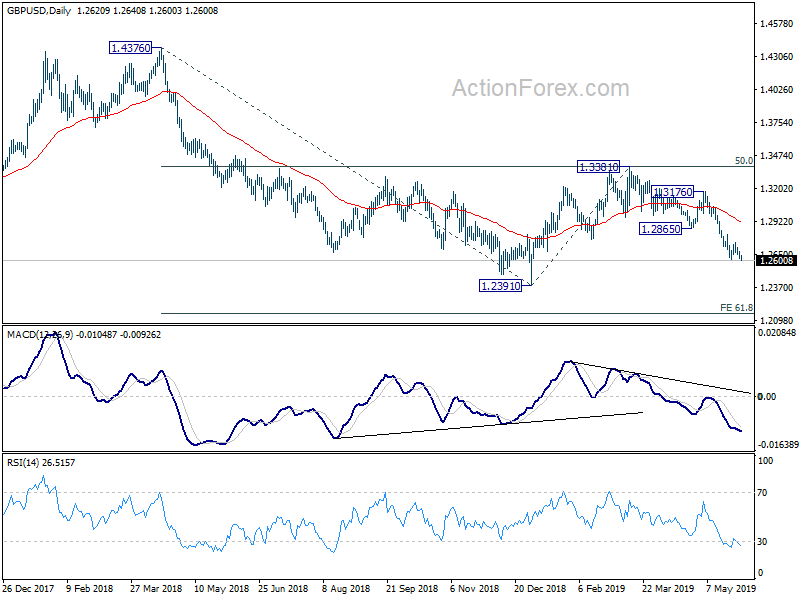
Daily Pivots: (S1) 1.2602; (P) 1.2636; (R1) 1.2661; More....
GBP/USD's breach of 1.2605 temporary low suggests that fall from 1.3381 is resuming. Intraday bias is back on the downside. Current decline should target a test on 1.2391 low first. Firm break there will resume larger down trend to 61.8% projection of 1.4376 to 1.2391 from 1.3381 at 1.2154 next. On the upside, break of 1.2747 resistance is needed to indicate short term bottoming. Otherwise, outlook will remain bearish in case of recovery.
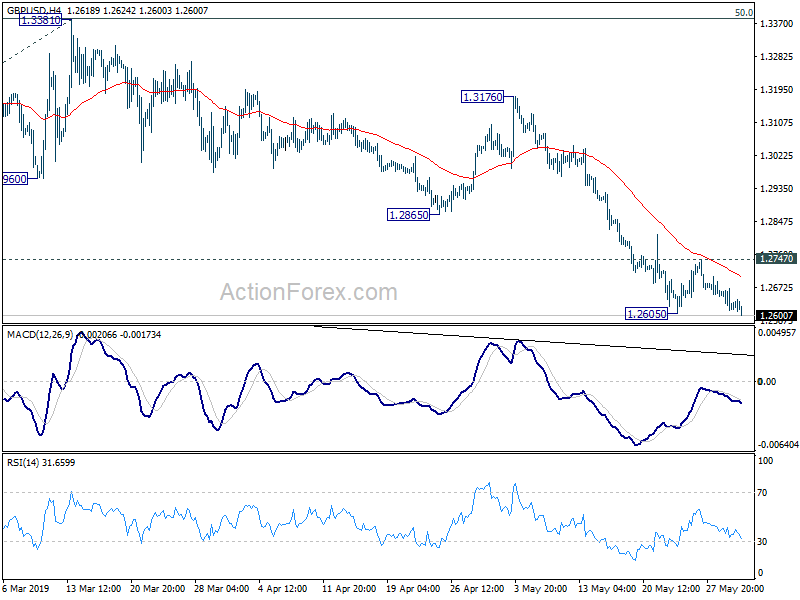
In the bigger picture, current development suggests that medium term decline from 1.4376 (2018 high) is not completed, and is possibly ready to resume. Decisive break of 1.2391 would target a test on 1.1946 long term bottom (2016 low). For now, we don't expect a firm break there yet. Hence focus will be on bottoming signal as it approaches 1.1946. In any case, medium term outlook will stay bearish as long as 1.3381 resistance holds, in case of strong rebound.