

Sample Category Title
EUR/USD Bullish Zigzag Possible With 88.6% Fib Bounce
The EUR/USD has probably completed a deep wave B (dark red) pattern but a break below the support trend line invalidates this wave pattern and indicates an immediate downtrend continuation. Price would need to break above the resistance trend lines (red) before a larger bullish reversal (green arrows) can become confirmed. In that case, a bullish breakout is expected to reach the Fibonacci levels of wave Y vs W.
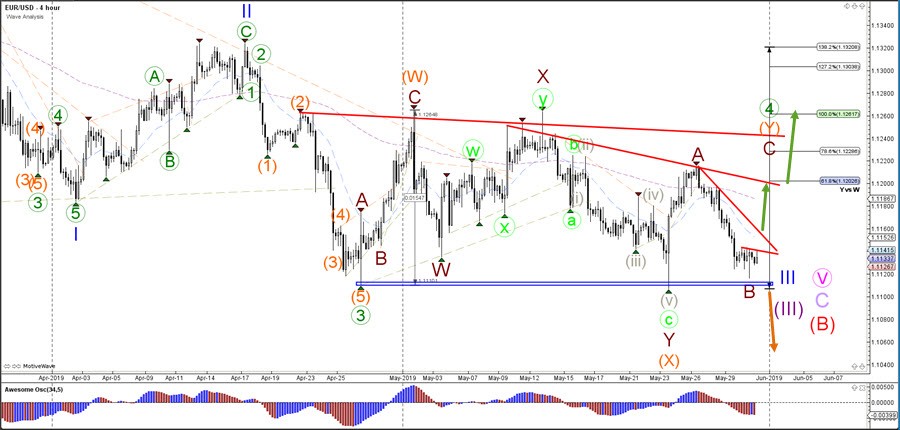
The EUR/USD bounced at the deep 88.6% Fibonacci retracement level of wave B vs A but it is unclear at the moment whether price will indeed reverse higher or whether price will actually continue with the downtrend. The support (blue) and resistance (red) trend lines play a key role in this equation and can help decide whether price is building a bullish reversal or a bearish continuation.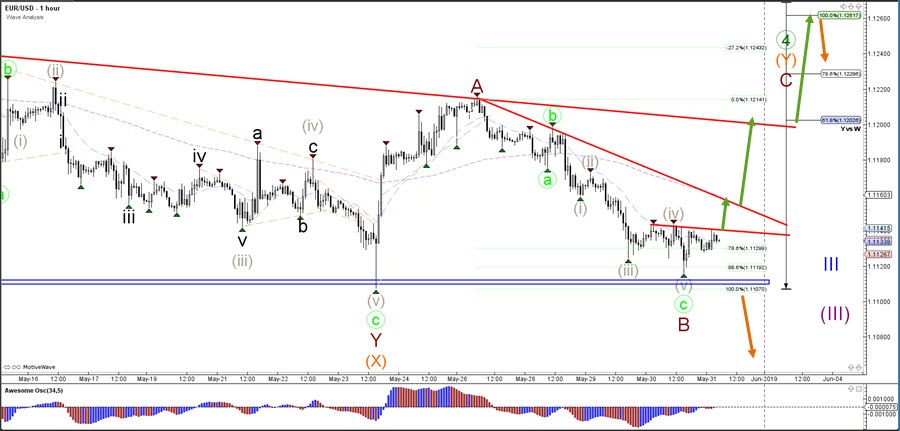
BoC Wilkins: Trade war is a wild card and our major preoccupation
BoC Senior Deputy Governor Carolyn Wilkins reiterated the central bank's view that " the slowdown in late 2018 and early 2019 was temporary." However, "global trade risks have increased". Thus, the current accommodation provided by BoC remains "appropriate". And upcoming rate decisions will remain data dependent, with attention to "household spending, oil markets and the global trade environment."
She described trade war as the "wild card" on global and domestic outlook. "How costly are trade wars for the global economy? In April, we said tariffs over the past two years and trade policy uncertainty would chop 0.4 per cent from global GDP by the end of 2021—that's about US$350 billion. While this can only be a rough estimate, we know it matters more for trade-dependent economies like Canada's."
Wilkins noted the positive development that US has dropped steel and aluminum tariffs recently, increasing chance of ratification of USMCA. But "other developments are discouraging", with US and China escalated their dispute and Canada "caught in the crossfire". She also noted the "potential for more friction between the United States and European Union."
She warned "if the disputes were to worsen and become long lasting, the outlook would be quite different. Not only would we see weaker economic demand, but the supply side of the economy would also take a hit as companies deal with disruptions to their supply chains. Obviously, this remains a major preoccupation for us."
China Manufacturing PMI Drops Below 50 Again
PMI at a three-month low
China's manufacturing PMI fell to 49.4 in May, the lowest reading since February and below economists' estimates of 49.9. This marks the fourth month in six that the reading has been below the 50 contraction/expansion threshold, with the new orders sub-index falling deeper into contraction territory while the new exports sub-index slumped dramatically from 51.4 in April to 49.8.
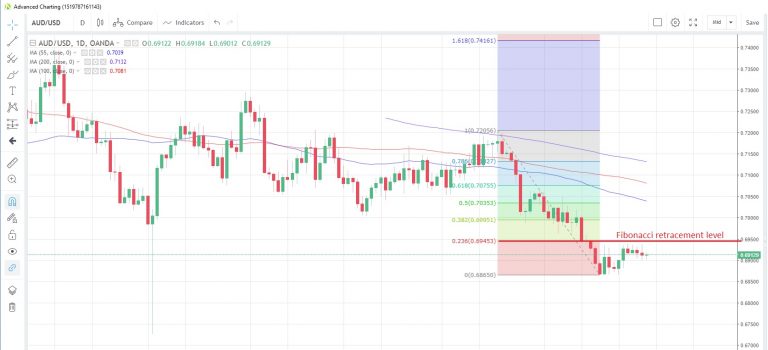
The response in the currency markets saw AUD/USD rebounding from intra-day lows before the release and is now at 0.6912, almost flat on the day. The FX pair currently appears to lack the momentum to break above the 23.6% Fibonacci retracement of the April-May drop at 0.6945.
AUD/USD Daily Chart
Trump's tariff target swings to Mexico
US President Trump announced addition tariffs of 5% on all imports from Mexico, effective June 10. He added that the tariff rate would increase steadily from July 1 and could reach as high as 25% until the flow of illegal immigrants into the US stops.
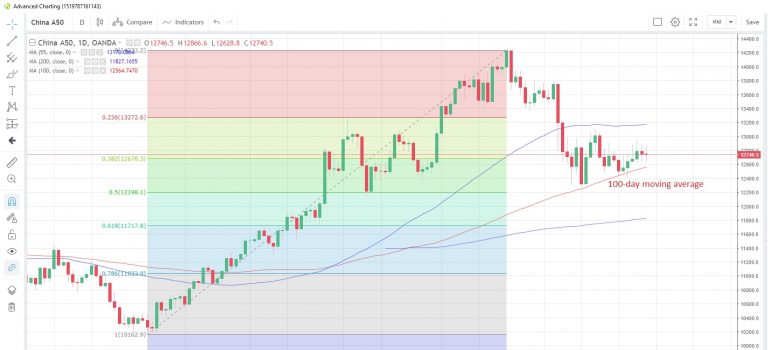
Markets reacted negatively to the developments (even though it was not against China), with the US30 index down 0.69%, and the NAS100 index down 0.74%. China shares bucked the global trend with a 0.18% bounce after yesterday's sell-off. The China50 index is holding above the 100-day moving average at 12,565, as it has done on a closing basis since January 23.
China A50 Daily Chart
German CPI seen easing
Germany's data slate today includes retail sales for April, which are expected to rebound to +0.1% after a 0.2% decline in March, and May's consumer price index, which is expected to ease off to +1.6%y/y from +2.0% last month. The UK's Nationwide house prices for April and mortgage data for the same month complete the European session.
The US session features personal income and spending data for April along with the prices index in personal consumption expenditures. That's seen holding steady at +1.5% y/y, though a weaker reading could prompt more speculation that the Fed might consider a shift to an easing bias. Yesterday Fed Vice Chairman Clarida commented that inflation expectations currently sit at the low end of the range consistent with Fed policy, though the Fed still views this weakness as transitory.
Fed Clarida: Interest rate consistent with Talyor-type rule results
Fed Vice Chair Richard Clarida reiterated the view that US economy is in a "very good place". Also current interest rate lies in the range of neutral and remain appropriate. Softness in recent inflation is seen as "transitory". Though, he also outlined the conditions for a rate cut, in persistent inflation miss or deterioration in global economic financial developments.
In a speech delivered yesterday, he said "the U.S. economy is in a very good place, with the unemployment rate near a 50-year low, inflationary pressures muted, expected inflation stable, and GDP growth solid and projected to remain so."
Also, the federal funds rate is now in the range of estimates of its longer-run neutral level, and the unemployment rate is not far below many estimates of u*. And, "plugging these inputs into a 1993 Taylor-type rule produces a federal funds rate between 2.25 and 2.5 percent, which is the range for the policy rate that the FOMC has reaffirmed".
Fed's decision to leave interest rate unchanged in May "reflects our view that some of the softness in recent inflation data will prove to be transitory."
Nevertheless, Clarida also noted "if the incoming data were to show a persistent shortfall in inflation below our 2 percent objective or were it to indicate that global economic and financial developments present a material downside risk to our baseline outlook, then these are developments that the Committee would take into account in assessing the appropriate stance for monetary policy."
Gold Price Climbing While Crude Oil Price Is Declining
Gold price started a decent upward move after forming a support base near $1,274. Crude oil price declined heavily and it remains at a risk of more losses below $55.00
Important Takeaways for Gold and Oil
- Gold price started a nice upward move after testing the $1,274 support against the US Dollar.
- There was a break above a major bearish trend line with resistance at $1,284 on the hourly chart of gold.
- Crude oil price declined sharply and traded below the $62.00 and $60.00 support levels.
- There was a break below a bearish flag pattern with support at $58.40 on the hourly chart of XTI/USD.
Gold Price Technical Analysis
Gold price found support near the $1,270 level and recently started an upward move against the US Dollar. The price settled above the $1,274 pivot level and extended gains above the $1,280 level.
The recent rise was positive above the $1,285 and $1,290 resistance levels. Moreover, there was a close above the $1,285 level and the 50 hourly simple moving average.
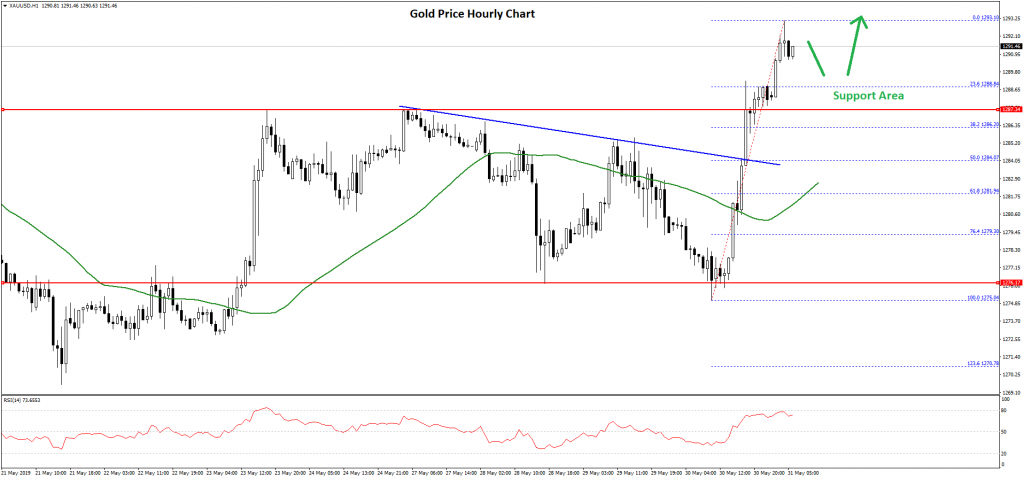
During the upward move, there was a break above a major bearish trend line with resistance at $1,284 on the hourly chart of gold. The price traded above the $1,290 level and recently traded close to the $1,294 level on FXOpen.
At the moment, the price is correcting lower towards $1,288. An initial support is near the 23.6% Fib retracement level of the recent wave from the $1,275 swing low to $1,294 high.
However, the main support is near the $1,288 level (the recent resistance area). The next support is near the $1,286 level and the 38.2% Fib retracement level of the recent wave from the $1,275 swing low to $1,294 high.
If there are more losses, the price might test the $1,285 support or the 50 hourly SMA. On the upside, if the price breaks the $1,294 and $1,295 levels, it could test the $1,300 resistance area.
Oil Price Technical Analysis
Crude oil price started a strong decline from well above the $64.00 level against the US Dollar. The price broke the key $62.40 support level to enter a bearish zone and start a downtrend.
The decline was strong as the price cleared the $60.00 support level and settled below the 50 hourly simple moving average. During the decline, there was a break below a bearish flag pattern with support at $58.40 on the hourly chart of XTI/USD.
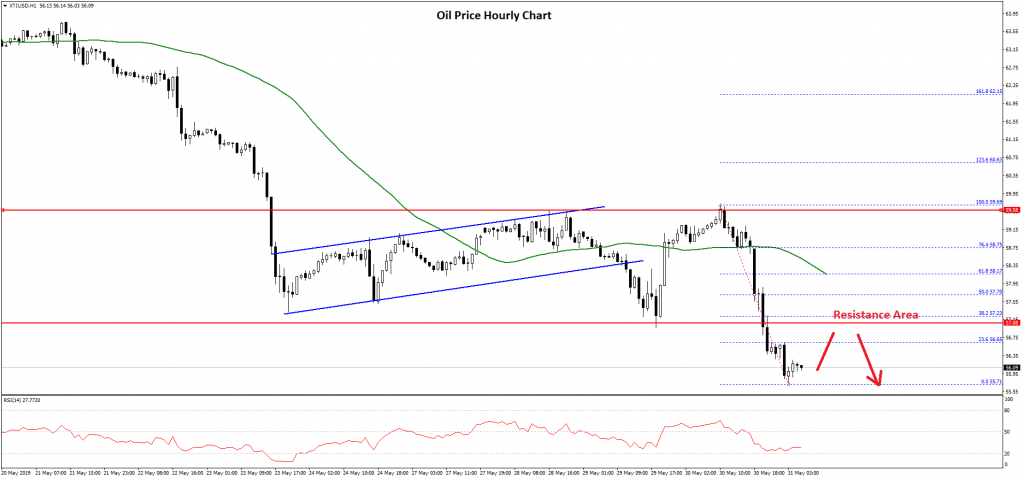
There was a decent recovery from the $57.00 support and the price revisited the $59.50 level. However, the price struggled to clear the $59.50 and $60.00 resistance levels.
Finally, there was a fresh decline below the $58.00 and $57.00 levels. A new weekly low was formed near the $55.71 level and the price is currently trading in a bearish zone.
An initial resistance is near the $56.65 level and the 23.6% Fib retracement level of the recent decline from the $59.69 high to $55.71 low. More importantly, the previous support level is near the $57.00 level is likely to act as a crucial barrier.
Above $57.00, the main resistance is near the $57.70 level, and the 50% Fib retracement level of the recent decline from the $59.69 high to $55.71 low.
On the downside, an initial support is near the $55.70 level, below which the price is likely to accelerate below the $55.00 support level.
Market Morning Briefing: Euro Is Likely To Test 1.11-1.10
STOCKS
Dow and DAX take a breather within their overall downtrend. Key resistances on both these indices can cap the upside and keep the downtrend intact. Nikkei remains bearish while Shanghai trades mixed within its sideways range. Sensex and Nifty have bounced as against our expectation to see an intermediate dip. The broader picture continues to remain bullish for both the Sensex and Nifty.
Dow (25169.88, +43.47, +0.17%) has key resistances at 25250 and 25500 which can cap the upside and keep our bearish view intact for a test of 24792 (38.2% Fibonacci retracement support) initially and then 24500 and 24000 eventually.
DAX (11902.08, +64.27, +0.54%) may now find it difficult to rise past 12000. While below 12000, the outlook is bearish for a fall to 11800 and 11600.
Nikkei (20798.51, -144.02, -0.69%) has declined further. The bearish view is intact for it to test 20500.
Shanghai (2915.89, +10.08, +0.35%) oscillates around 2900 over the last few days. The 2835-2950 sideways range remains intact. A breakout of this range will decide the next direction of move.
Sensex (39831.97, +329.92, +0.84%) is holding above 39500 and remains bullish to test 40000 and 40200.
Contrary to our expectation for a fall Nifty (11945.90, +84.80, +0.71%) has bounced back above 11900 again. The outlook remains bullish for a rise to 12150. But the possibility of a sideways consolidation between 11800-12000 cannot be ruled out before we see a fresh rally.
COMMODITIES
Gold has risen sharply as the expectations are turning high for the Fed to cut rates. Gold and Silver have room for further rise, but the upside is expected to be capped. Copper remains bearish. Oil prices have tumbled after the US inventory data failed to meet the market expectation. The US crude inventories fell 300,000 barrels as against the market expectation for a draw-down of 900,000 barrels. Our bearish view on oil remains intact.
Contrary to our expectation for a fall, Gold (1291) has risen sharply. The possibility of a head and shoulder formation (as a continuation pattern) seems to have negated. Immediate support is at 1287. while this support holds, gold can rise to 1296 and 1300 - the upper end of its 1265-1300 sideways range.
Silver (14.51) can test 14.60-14.65 while it sustains above 14.50. But the upside is likely to be capped and silver can reverse lower again targeting 14.25 and 14.
Copper (2.65) remains bearish for a fall to 2.60. As mentioned yesterday, a break below 2.65 will strengthen the downmove.
Brent (66.18) has tumbled towards 66 and can test 65-64 in line with our expectation in the coming sessions. A corrective bounce to 67-68 cannot be ruled out from the 65-64 support region. However, our long-term bearish view will continue to remain intact to test 60 and 55 eventually.
Similarly, WTI (56.21) can bounce to 57-58 from the 55-54 support region and then can resume the downtrend towards 50 and even lower levels over the long term.
FOREX
Major currency pairs are stable and trading near important supports. Aussie, Pound, Euro and Dollar-Yen could be headed towards near term supports and could soon see a bounce back in the medium term.
Dollar Index (98.10) is stable and could test 98.50-99.00 on the upside before falling from there. Overall trade for the next week could possibly be within 99-97.50 with a possibility of testing the upper limit first.
Euro (1.1136) is likely to test 1.11-1.10 which is an important support zone for the coming sessions. A bounce from 1.11 is possible before 1.10 is tested in the medium term.
Euro-Yen (121.61) is trading just above support near 121.50/30 and while that holds, we could see a bounce towards 122.50 in the near term. View is bullish while immediate support holds.
Dollar-Yen (109.22) has dipped and could test support at 109 or lower at 108.50 before a bounce from there is seen. A bounce from support levels by end of next week looks likely.
Aussie (0.6913) could continue to trade within 0.6950-0.6860 in the near term.
Pound (1.2612) is trading just above support at 1.26 which may produce a bounce and push the currency back to higher levels in the near term.
USDCNY (6.9107) has dipped from levels near 6.9125 yesterday. Yuan could slowly strengthen towards 6.90 in the near term.
USDINR (69.88) has immediate support near 69.60 and while that holds, we could see a trade within 70.0-69.60 in the near term. We are cautious to look for a break above 70 because that could trigger a rise towards 70.10/25 in the medium term. For now we would prefer 70 to hold and produce a rejection within the next couple of sessions.
INTEREST RATES
US yields looks bearish for the near term. The US 30YR (2.63%), 10Yr (2.19%), 5YR (1.99%) and 2Yr (2.02%) have fallen sharply and looks weak for another 1-2 sessions before the yields pause and starts to see some corrective upmove. The 10Yr (2.19%) yield may get some support near current levels while 2Yr (2.02%) could test 2%.
The German-US 10Yr (-2.36%) has risen sharply breaking above immediate resistance and while the near term directional correlation with Euro is negative, a further rise in the spread could lead to weakness in Euro in the near term. The spread looks likely to rise towards -2.28%.
The US-Japan 10YR (2.28%) has fallen breaking below immediate support. There is now scope of falling towards 2.20% in the near term that could pull down Dollar Yen also in the near term.
FX Weekly: A$ Resilient in Face of Deepening Trade Tensions
A$ has been resilient in the face of deepening trade tensions but faces major challenges in the week ahead from a likely RBA rate cut and dovish statement plus Australia's Q1 GDP report.
Trade wars have dominated global financial markets in May and bond markets are clearly warning of weaker global growth ahead as tariff hikes start to bite.
Global markets have had a lot to worry about over recent weeks. We’ve had Trump announce that tariffs on $200bn of goods imports from China would increase from 10% to 25% and that work on next round of tariffs on the final $300bn of imports had started too.
We had Huawei put on a ‘blacklist’ and the Commerce Department announce they were looking at a rule change that could place countervailing duties on imports from countries that act to undervalue their currency.
We’ve also seen a step up in retaliation from China too. Chinese tariffs on $60bn of imports from the US increase tomorrow and the People’s Daily suggested this week that China is “seriously” considering restricting rare earth exports to the U.S.
Rare earth elements such as lanthanum and neodymium are used in a host of complex electronic goods such as smartphones, night vision goggles and guidance systems and China has become the dominant supplier of these rare elements to the rest of the world.
As we move into June, with a G20 meeting at the end of the month which is supposed to see Trump and Xi sit down to talk trade, these increased signs of aggression from both leaders have left equity markets unsettled.
The S&P 500 is set to finish the month down circa 5% and China’s Shanghai index down close to 7%. Concerns about global growth have driven US 10yr yields down to the lowest level seen since September 2017 and copper back to the lows for the year.
If Fed vice chair Clarida is a fair reflection of views within the FOMC, then it appears the board is watching trade developments closely. In Q&A after a speech to market participants in NY Thursday, he commented that “If the incoming data were to indicate that global economic and financial developments present a material downside risk … then these are developments that the committee would take into account in assessing the appropriate stance for monetary policy”.
While there are a number of ‘ifs’ in that comment, it’s one of the clearest statements yet that the Fed is watching trade wars closely. Markets brought pricing of a rate cut in the US forward to September.
Despite this, a widely watched measure of the US dollar is at 2yr highs and that’s despite Trump facing more political pressure at home after Special Counsel Mueller’s statement earlier in the week.
Trump will also likely face criticism for the emergency measures announced to address the Mexican border crisis which will see a 5% tariff on all goods imported from Mexico starting June 10 rising to 10% July 1 and so on until 25% on October 1 unless “Mexico substantially stops the illegal inflow of aliens coming” into the US.
Back in Australia, the RBA outlook remains the key talking point. Westpac was the first major bank to forecast a cash rate below 1%. On 24 May, Chief Economist Bill Evans wrote that “Westpac is now forecasting three cuts in 2019 in June; August and November to push the cash rate from 1.5% to 0.75% and to hold at that level through 2020.” We are therefore confidently forecasting a rate cut next week.
An important area of support for the A$ has continued this week, with iron ore touching the highest level back to April 2014, and in A$ terms it hit the highest seen since August 2013. It was probably this factor alone that helped the A$ trade in a quiet range just above 69 cents to the US$ this week.
Clearly the RBA will dominate a very busy week for financial markets. All forecasters expect a 25bps cut Tuesday, so the guidance from the RBA on the prospects for more cuts will be key to price action in domestic money markets. We also have retail sales and the current account deficit on Tuesday, Q1 GDP on Wednesday and the April trade balance. Westpac is forecasting 0.6% real GDP growth in the first quarter, but with downside risks, adding to the possibility that the A$ drops below 0.69 next week.
Event risk: Aust Q1 company profits & inventories, US President Trump state visit to UK begins, US May manufacturing ISM (Mon), Aust Apr retail sales, Aust Q1 balance of payments & public demand, RBA policy decision (Tue), Aust Q1 GDP, US May non-manufacturing ISM (Wed), Aust Apr trade balance, ECB policy decision, Reserve Bank of India policy decision (Thu), Aust Apr home loan approvals, US May employment (Fri)
Cliff Notes: Fixated on the Risks
Key insights from the week that was.
The Q1 CAPEX survey provided an important update on equipment investment in the 3 months to March as well as business investment intentions for 2018/19 and 2019/20. In Q1, equipment investment disappointed, falling 0.5% to be only 2.4% higher over the year. This outcome creates downside risk for our Q1 GDP forecast of 0.6%, particularly as it follows a disappointing read on construction investment last week.
Intentions for 2018/19 were essentially unchanged from the previous estimate, a gain of 4% from 2017/18 projected. Our assessment of estimate 2 for 2019/20 is that it is consistent with a gain of only 1%. By industry, this comes as a result of increased investment in mining; little change for services; and a reduction in spending by manufacturers.
All told, the outlook for growth in investment remains subdued. We are mindful that the surprise Coalition victory in the May Federal election could see a lift in sentiment, sparking stronger investment. Partial data in coming months will therefore be a focus.
The April reading for dwelling approvals also disappointed this week, activity falling 4.7% in the month and 24%yr. April’s downside surprise is likely, in part, due to the timing of the Easter and ANZAC day public holidays. That said, the outlook is clearly weak, with recent declines broad based across the industry’s sub-sectors. As for business investment, the next few months will make clear the degree to which the election and declining interest rates could offer housing a reprieve. We remain of the view that residential investment will contract through both 2019 and 2020, and furthermore, that house prices will take time to stabilise.
Over in New Zealand, Budget 2019 was released. Spending was focused on the household sector, but there was nothing for housing or to support flagging business confidence. The New Zealand Government is more positive on the medium to long-term outlook than Westpac NZ. Hence there is a meaningful risk of the out years disappointing the Government’s forecasts.
For the US, the economic data flow has been very light. The market has therefore instead focused on uncertainty around trade, the DXY index gaining 0.5% to be near its 2019 high; the S&P500 falling 1.5% to Wednesday’s close (before recovering 0.2% on Thursday); and the cash/10-year curve inverting further as the US 10yr yield declined to 2.18% currently. The market has now priced in a federal funds rate cut by October and two further cuts by late-2020.
To us, there is currently no economic basis for ‘insurance’ cuts from the FOMC. Employment growth is very strong and real wages growth robust. Further, the economy’s wealth is at all-time highs and, thanks to the sharp drop in benchmark government yields, borrowing costs for the economy are at historically-low levels. At trend growth led by the consumer remains the most likely outcome for the US.
Federal Reserve Vice Chair Clarida did open the door for easier policy this week, but such an outcome would be conditional on there being a need. To warrant action, persistent disappointment for inflation (which the Committee does not currently expect) and/or material downside risks to the US outlook would need to eventuate. Given the market’s unease and President Trump’s decision this morning to impose tariffs on Mexico, the latter is arguably the primary concern.
Finally in Europe, the provisional results of EU Parliament elections indicate a coalition of centrist parties will retain majority status. Yet, as foreshadowed by the polls, the centre-right EPP and centre-left S&D, the two largest parties, saw a significant decline in votes, while gains were seen for the centre liberals ALDE/EM, and populist parties. Voting fragmentation has clear implications for national politics.
Of immediate concern is Italy, where EU Parliament voting indicated a sizable pick-up for the far-right Lega party, largely at the expense of their governing coalition partner Five-Star. Consequently, the Lega’s leader Salvini is now enforcing his agenda on new infrastructure and a ‘flat’ tax, threatening a breakdown of the coalition if demands are not met. As such, the possibility of an early election in September remains significant, and the ongoing budget dispute with the EU is likely to heighten.
US Crude Oil Inventory Dropped Modestly, While Production Built Further
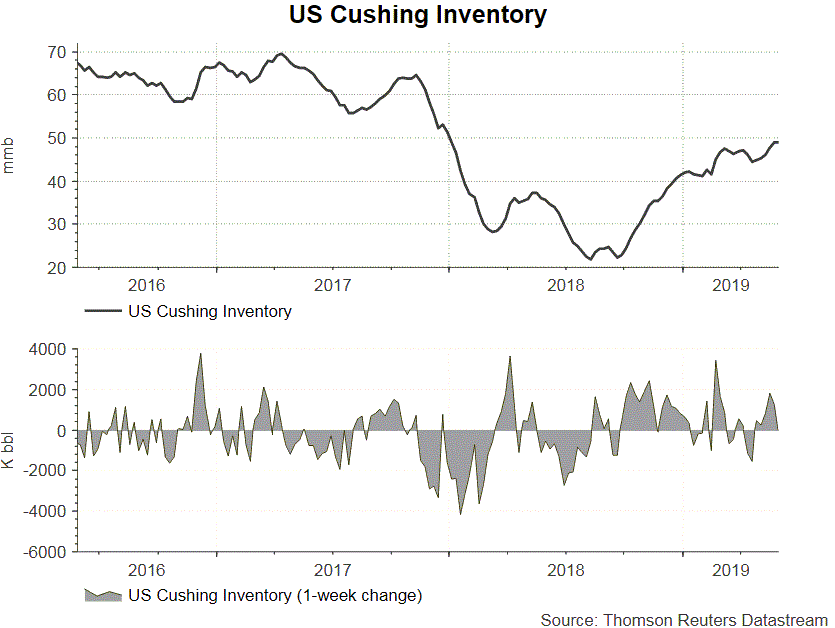
The report from the US Energy Information Administration (EIA) shows that total crude oil and petroleum products (ex. SPR) stocks declined -1.57 mmb to 1285.49 mmb in the week ended May 24. Crude oil inventory slipped -0.28 mmb to 476.49 mmb (consensus: -0.86 mmb). Inventories rose in 3 out of 5 PADDs. Yet, stockpile at PADD 5 (West Coast) declined -1.08 mmb. Meanwhile, Cushing stock dropped -0.02 mmb to 49.05 mmb. Utilization rate gained +1.3% to 91.2% while crude production added +0.1M bpd to 12.3M bpd for the week. Crude oil imports fell -0.08M bpd to 6.86M bpd in the week.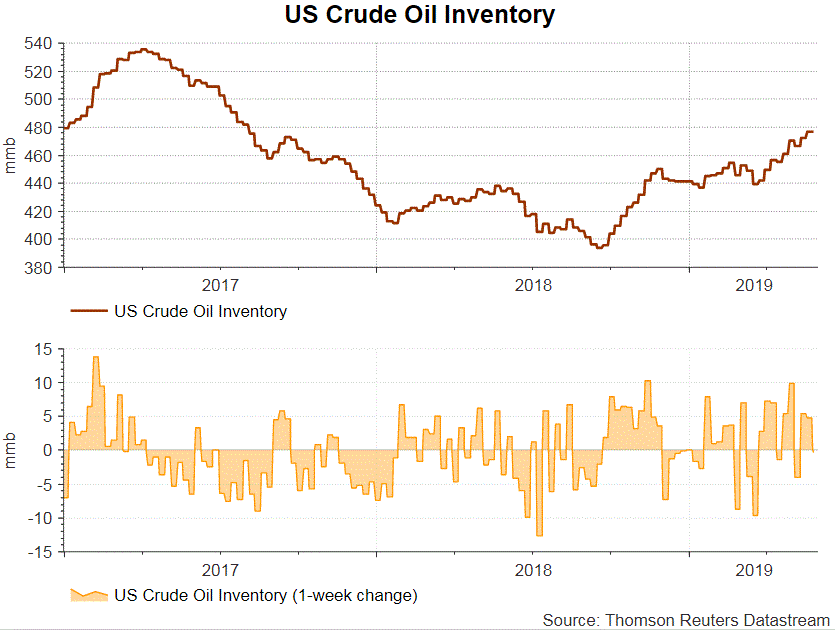
Concerning refined oil product inventories, gasoline inventory gained +2.2 mmb to 230.94 mmb as demand dropped -0.37% to 9.39M bpd. The market had anticipated a -0.53 mmb drop in stockpile. Production dropped -2.77%% to 10 bpd while imports plunged -19.48% to 1.09M bpd during the week. Distillate inventory dropped -1.62 mmb, to 124.8 mmb. Demand soared +13.1% to 4.28M bpd. The market had anticipated a -0.5 mmb decline in inventory. Imports soared +73.53% to 5.18M bpd while production slumped 73.53% to 0.18M bpd during the week.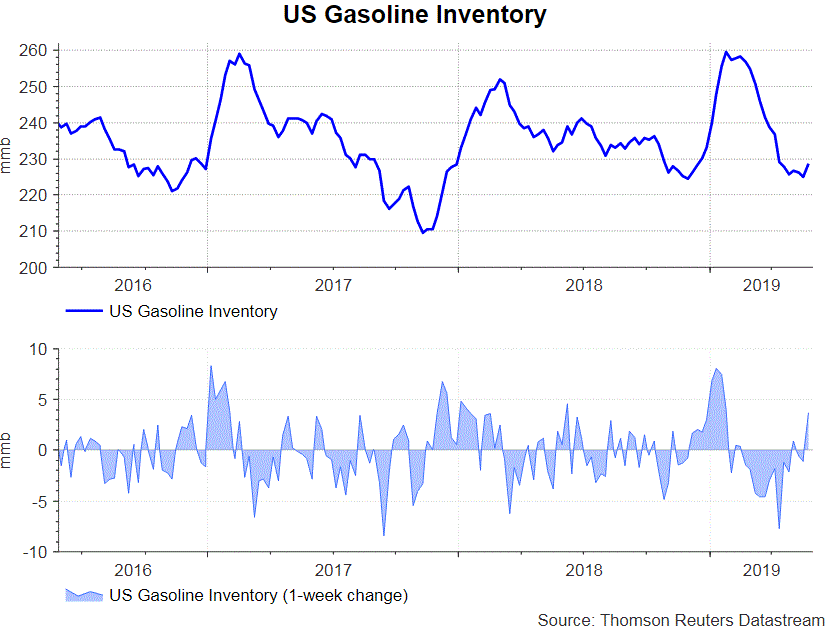
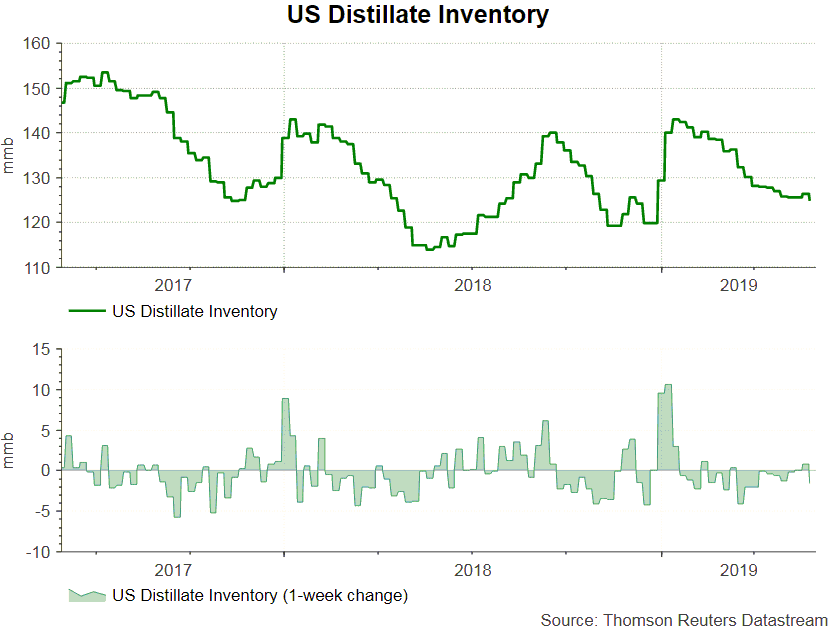
Released after market close on Thursday, the industry- sponsored API estimated that crude oil inventory declined -5.27 mmb during the week. For refined oil products, gasoline stockpile added +2.71 mmb while distillate dropped -2.14 mmb.
USD/JPY Recovery Failed Near Key Resistance
Key Highlights
- The US Dollar found support near 109.20 and recently recovered against the Japanese Yen.
- USD/JPY failed near 109.90 and remained below a key bearish trend line on the 4-hours chart.
- The US GDP grew 3.1% in Q1 2019, according to the “second” estimate.
- The US Personal Income in April 2019 could rise 0.3% (MoM), more than the last +0.1%.
USDJPY Technical Analysis
After a solid decline, the US Dollar found a strong buying interest near 109.20 against the Japanese Yen. The USD/JPY pair started a short-term rebound and traded above the 109.40 and 109.50 resistance levels.
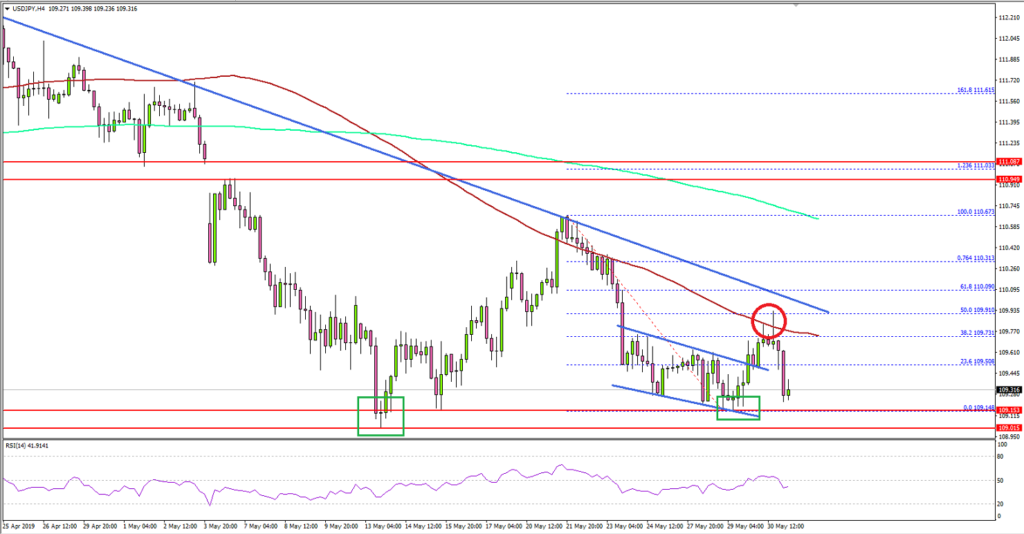
Looking at the 4-hours chart, the pair seems to have formed a solid support above the 109.10 and 109.15 levels. It broke a declining channel near 109.50 to enter a positive zone.
Moreover, the pair surpassed the 109.75 resistance plus the 38.2% Fib retracement level of the downward move from the 110.67 high to 109.14 low. On the upside, the pair failed near the 109.90 resistance level and remained below a key bearish trend line.
Besides, the pair struggled to surpass the 50% Fib retracement level of the downward move from the 110.67 high to 109.14 low, plus the 100 simple moving average (red, 4-hours).
To start a decent recovery, the pair must surpass the 109.90 and 110.00 resistance levels. A successful close above the bearish trend line and 110.00 could open the doors for a larger recovery.
Conversely, if there is no upside break above 109.90 or 110.00, the pair might decline again towards the 109.15 support level. The main support is near 109.10, below which the pair may well decline heavily.
Fundamentally, the US Gross Domestic Product report for Q1 2019 was released by the US Bureau of Economic Analysis. The market was looking for the GDP to grow by 3.1% in Q1 2019.
The actual result was similar to the forecast, as the US GDP grew 3.1% in Q1 2019, according to the “second” estimate. However, the first quarter GDP rate is less than the last 3.2%.
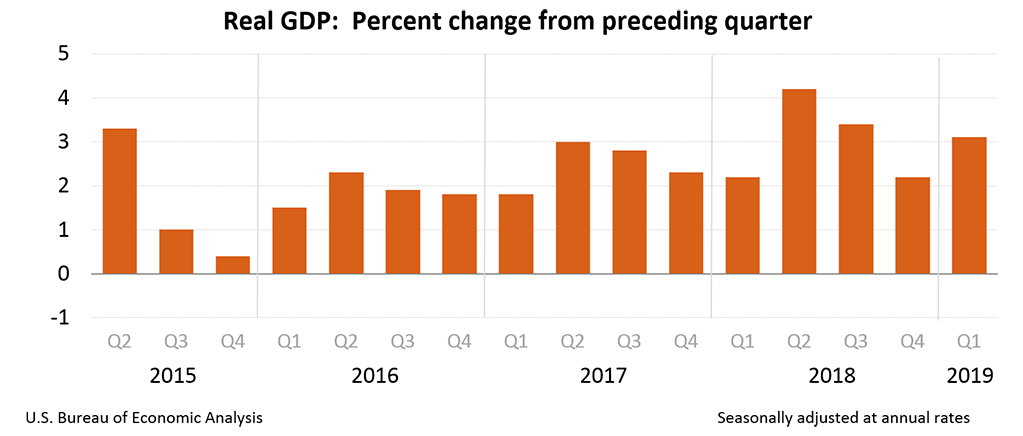
Real gross domestic income (GDI) increased 1.4 percent in the first quarter, compared with an increase of 0.5 percent (revised) in the fourth quarter. The average of real GDP and real GDI, a supplemental measure of U.S. economic activity that equally weights GDP and GDI, increased 2.2 percent in the first quarter, compared with an increase of 1.3 percent in the fourth quarter.
Looking at other major pairs, both EUR/USD and GBP/USD declined heavily and they might continue to struggle in the near term.
Economic Releases to Watch Today
- German CPI May 2019 (YoY) (Prelim) – Forecast +1.6%, versus +2.0% previous.
- German CPI May 2019 (MoM) (Prelim) – Forecast +0.3%, versus +1.0% previous.
- US Personal Income April 2019 (MoM) – Forecast +0.3%, versus +0.1% previous.
- Canadian GDP Q1 2019 (Annualized) – Forecast +1.2%, versus 0.4% previous.