Sample Category Title
Gold Pares Losses On Uncertainty
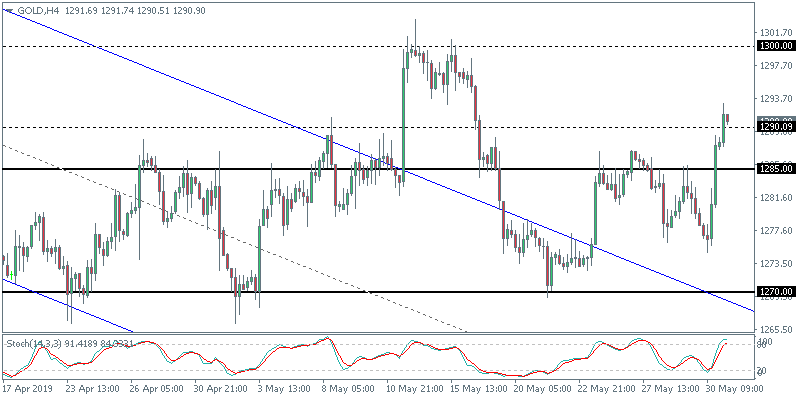
The precious metal pared losses on Thursday as it gained 0.67%, erasing the losses from earlier in the week. The rather volatile move in gold prices reflects the global uncertainty especially in regard to trade. The bond markets once again flashed a red signal with the 3/10-year spread falling to 11.9bps. This led to investors seeking the security of safe haven assets.
Gold Prices Could Extend Gains for the 2nd Week
XAUUSD is on track to potentially extend gains for the second consecutive week. Price action remains flat overall. Following the brief decline lower, gold recovered sharply on Thursday as it broke past the 1285 resistance once again. This potentially shifts the bias to the upside. However, given the current uncertainty in the markets, we expect to see a bit more volatility in the precious metal.
Oil Slips As Inventory Build-Up Continues
Crude oil prices fell 4.5% on Thursday. The declines came as data showed that US inventories of crude oil were high. The US Energy Information Administration (EIA) reported that crude oil stockpiles fell just 282,000 barrels last week compared to the forecasts of a drawdown of 1 million bpd. Meanwhile, an oil tanker with Iran crude oil left the shores heading for China, further putting the US and China to a standoff.
Crude Oil Breaks Past Support – What’s Next?
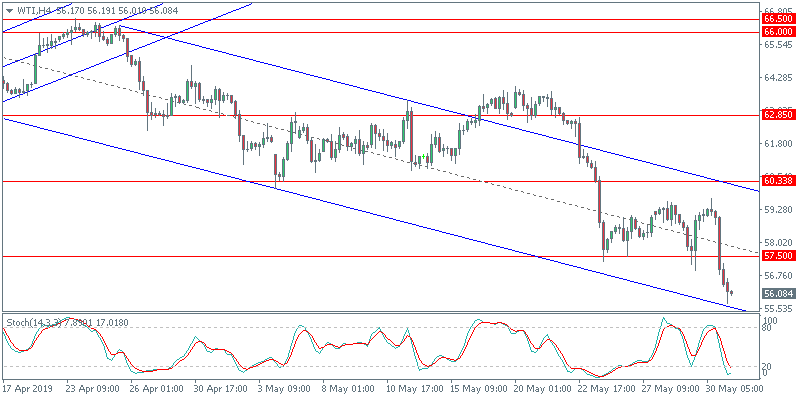
Oil prices fell sharply breaking the support level at 57.50. This led price to test a fresh two-month low as WTI crude oil closed at $56.43. Any pullback in the near term could see the 57.50 level acting as resistance. To the downside, crude oil prices could now extend the declines to the $50.00 handle. However, this will be left to be seen if the resistance can be established at $57.50.
Euro Muted as US GDP Revised Slightly Lower
The common currency was flat on Thursday despite some weak reports from the United States. The first quarter GDP’s second estimates were revised down slightly to show a 3.1% increase on the quarter, comparing to the 3.2% increase reported initially. Meanwhile, wholesale inventories rose 0.7%, recovering from the 0.1% decline in March. The weekly jobless claims stood at 215,000.
EURUSD Remains in a Range
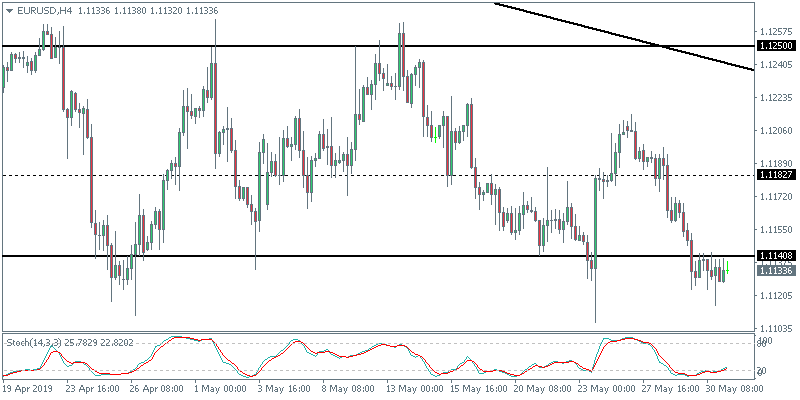
The common currency posted a doji pattern on Thursday. This comes as the currency pair remains firmly stuck in the range near a two-year low. Price action closed below 1.1140 and remains hovering slightly above the May 23 lows. A bullish follow-through on the day could see price lifting higher to test the 1.1182 level of resistance.
EUR/CHF Daily Outlook
Daily Pivots: (S1) 1.1202; (P) 1.1227; (R1) 1.1242; More....
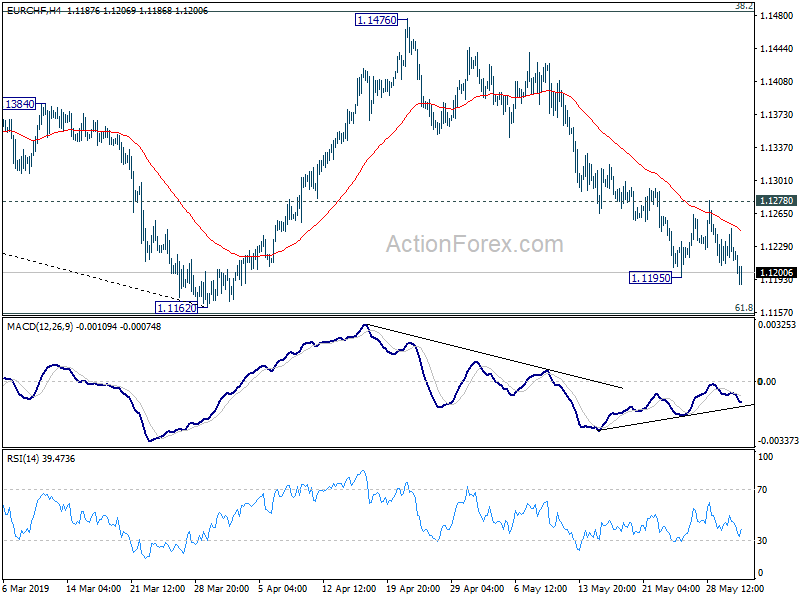
EUR/CHF's fall from 1.1476 resumes by breaking 1.1195 and intraday bias is back on the downside. For now, we'd still expect strong support above 1.1162 to bring rebound. Break of 1.1278 resistance will indicate near term reversal and turn bias back to the upside. However, sustained break of 1.1162 could carry larger bearish implication and turn outlook bearish.
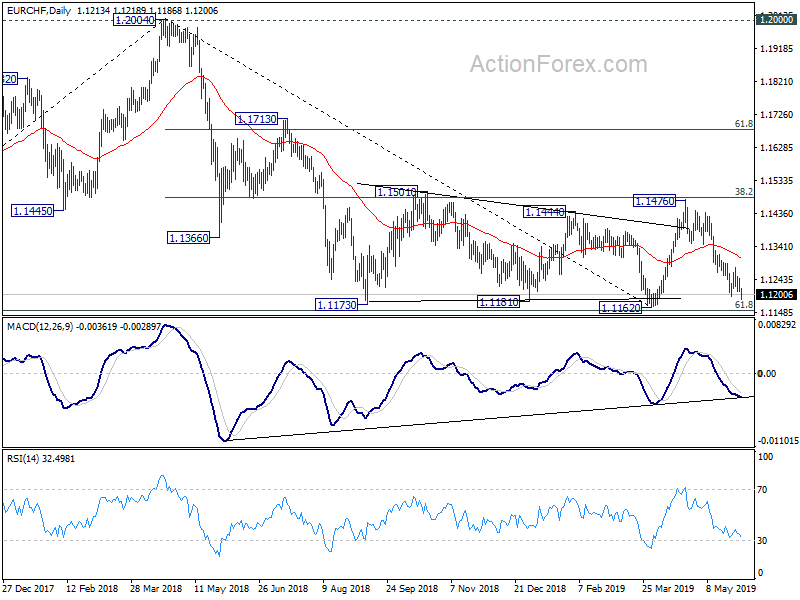
In the bigger picture, at this point, we're slightly favoring the case that corrective fall from 1.2004 has completed at 1.1162 after being supported by 61.8% retracement of 1.0629 to 1.2004 at 1.1154. Decisive break of 1.1501 resistance should confirm and target 1.1713 resistance next. On the downside, sustained break of 1.1154 will confirm resumption of decline from 1.2004 and target 1.0629 support next.
USDJPY Pattern Complete
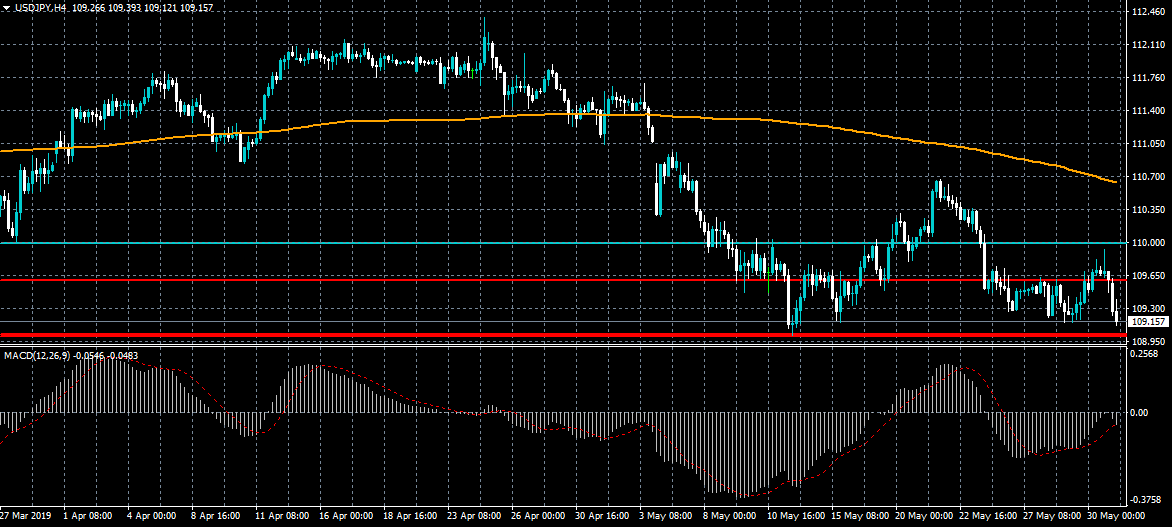
The US dollar has started to reverse direction against the Japanese yen after finding strong technical resistance from the 109.92 level. The direction of the USDJPY pair is increasingly linked to the bearish head and shoulders pattern on the four-hour time frame. Overall, the bearish head and shoulders pattern on the four-hour time frame and the releases are core PCE data from the US economy are the main themes to watch.
The USDJPY pair is only bearish while trading below the 109.80 level, key support is found at the 109.00 and 108.40 levels.
If the USDJPY pair trades above the 109.80 level, key technical resistance is found at the 109.92 and 110.30 levels.
USD/CAD Daily Outlook
Daily Pivots: (S1) 1.3480; (P) 1.3500; (R1) 1.3521; More...
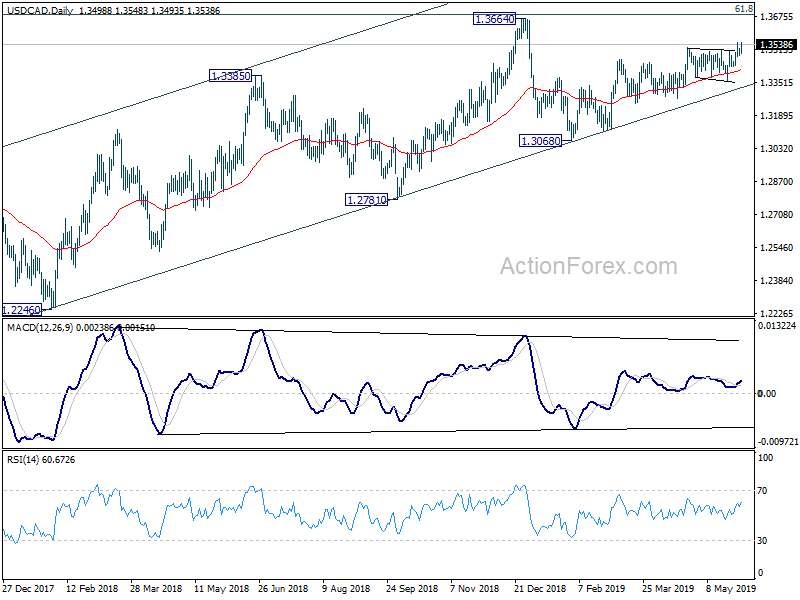
Intraday bias in USD/CAD remains on the upside at this point. Current rise is part of larger rally from 1.3068 and should target 1.3664 high. For now, break of 1.3429 support is needed to be the first sign of near term reversal. Otherwise, outlook will remain bullish in case of retreat.
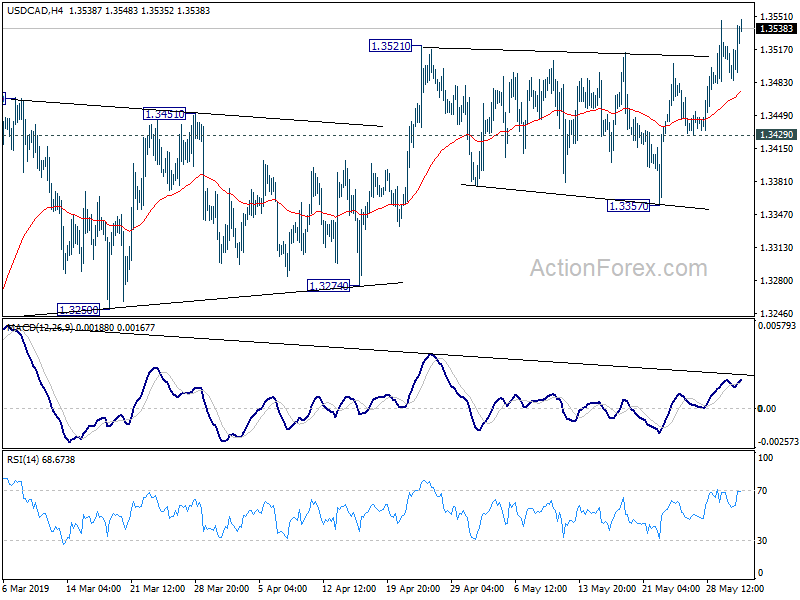
In the bigger picture, USD/CAD is staying well inside medium term rising channel (support at 1.3321). Thus, the up trend from 1.2061 (2017 low) should be in progress. On the upside, decisive break of 61.8% retracement of 1.4689 (2016 high) to 1.2061 at 1.3685 will pave the way to 78.6% retracement at 1.4127 next. This will remain the favored case as long as 1.3068 support holds. However, sustained break of the channel support will be the first sign of medium term reversal. Firm break of 1.3068 would confirm.
LTCUSD $110.00 PIVOT
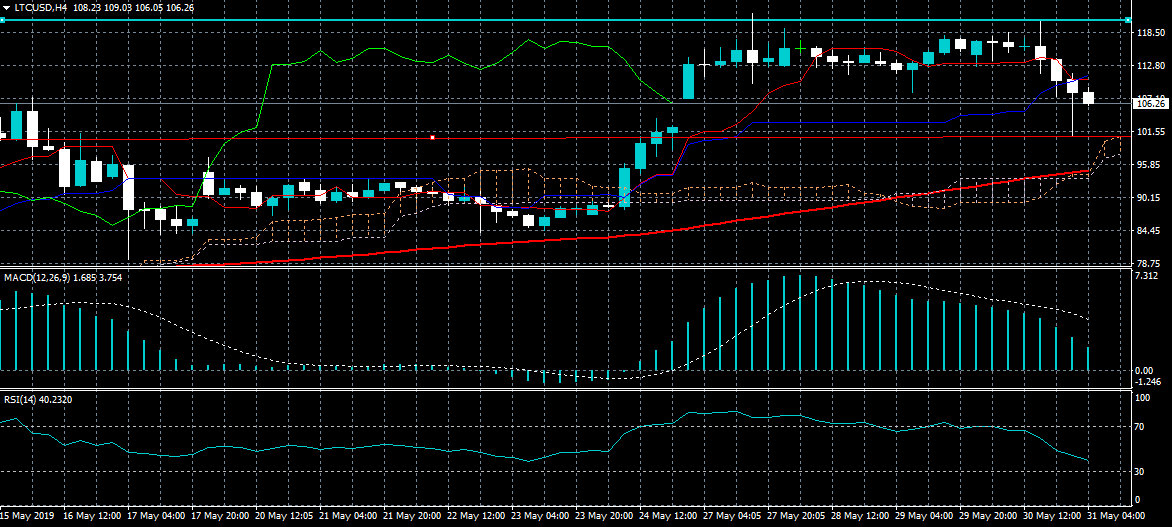
Litecoin has started to trade lower after hitting $120.00, with the sixth largest cryptocurrency so far finding support from the $100.00 level. The LTCUSD pair now needs to break above the $110.00 level to encourage new buying towards the $114.00 and $120.00 levels. The Ichimoku indicator on the four-hour time frame is showing that the $110.00 level is major support before the $90.00 region.
The LTCUSD pair is only bullish while trading above the $110.00 level, key resistance is found at the $114.00 and $120.00 levels.
If the LTCUSD pair trades below the $110.00 level, key support is found at the $100.00 and $90.00 levels.
GBPUSD Defensively Weak
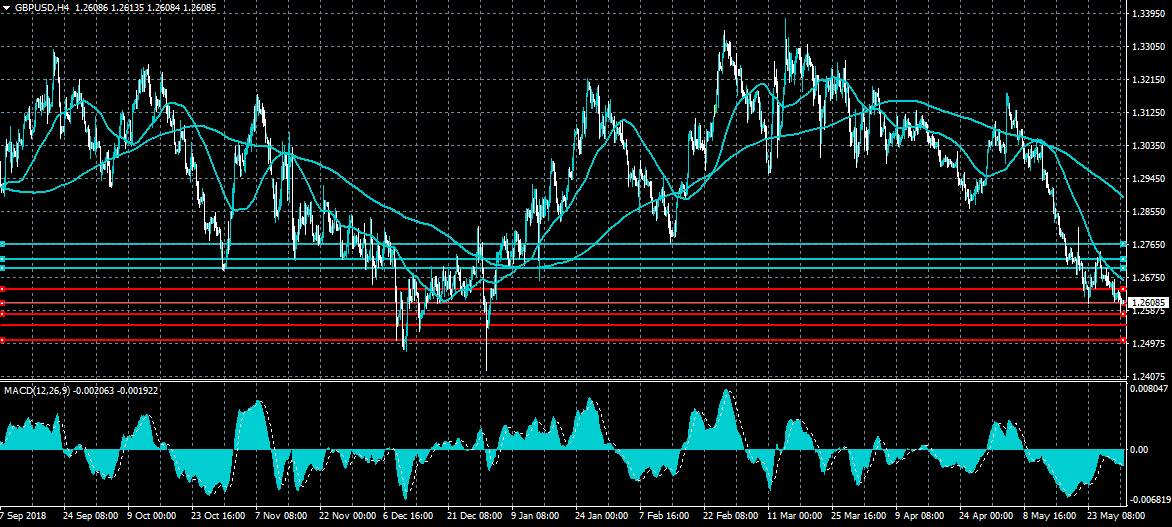
The British pound is still trading tentatively above the 1.2600 level against the US dollar, despite a minor rebound from the 1.2580 area on Thursday. The four-hour time frame is showing that the bearish pattern can cause the GBPUSD pair to slide towards the 1.2450 level. The monthly price close for the GBPUSD pair will be key today alongside the release of US economic data.
The GBPUSD pair is heavily bearish while trading below the 1.2600 level, key support is located at the 1.2550 and 1.2500 levels.
If the GBPUSD pair holds above the 1.2600 level, key intraday resistance is found at the 1.2630 and 1.2660 levels.
Trade Tensions Rise As Trump Threatens Mexico With Tariffs
The price of benchmark crude oil prices declined to 2-week lows after the EIA released inventory data for the past week. Data showed that crude inventories dropped by more than 282K, which was a smaller decline than the 857k that investors were expecting. The inventories are 5% above the five-year average. In addition, the report showed that US production had climbed to more than 12.3 million barrels per day.
Stocks declined sharply after Donald Trump threatened fresh tariffs on Mexican goods. The new 10% tariff will take effect on June 10 and climb to 25% in October. The new tariffs are intended to push the country to deter the flow of asylum-seeking Central American families to the southern border. In response to the tariff threat, the Mexican President, Andres Manuel López Obrador asked for a deeper dialogue on the migration issue. He said that Mexico was doing whatever it could to curb the flow of migrants across Mexico. The new trade war with Mexico will threaten the gains made in the new NAFTA. It will also be a difficult one because Mexico is the third-largest trading partner with the US.
Earlier today, Asian countries released mixed economic data. In Japan, the CPI for Tokyo declined to 1.1% in May. This was slightly lower than the expected 1.2% and the previous 1.3%. The Tokyo core CPI declined to 1.1% from the previous 1.4%. Retail sales declined to 0.5% from the previous 1.0%. On a positive note, the industrial production rose by 0.5% on a MoM basis from the previous decline of -0.6%. The unemployment rate dropped to 2.4%. In China, the manufacturing PMI data from the China Logistics Information Center declined to 49.4 from the previous 50.1. A PMI number below 50 is a sign of contraction. Later today, investors will focus on the Canadian GDP data, US PCE data, and Germany retail sales.
EUR/USD
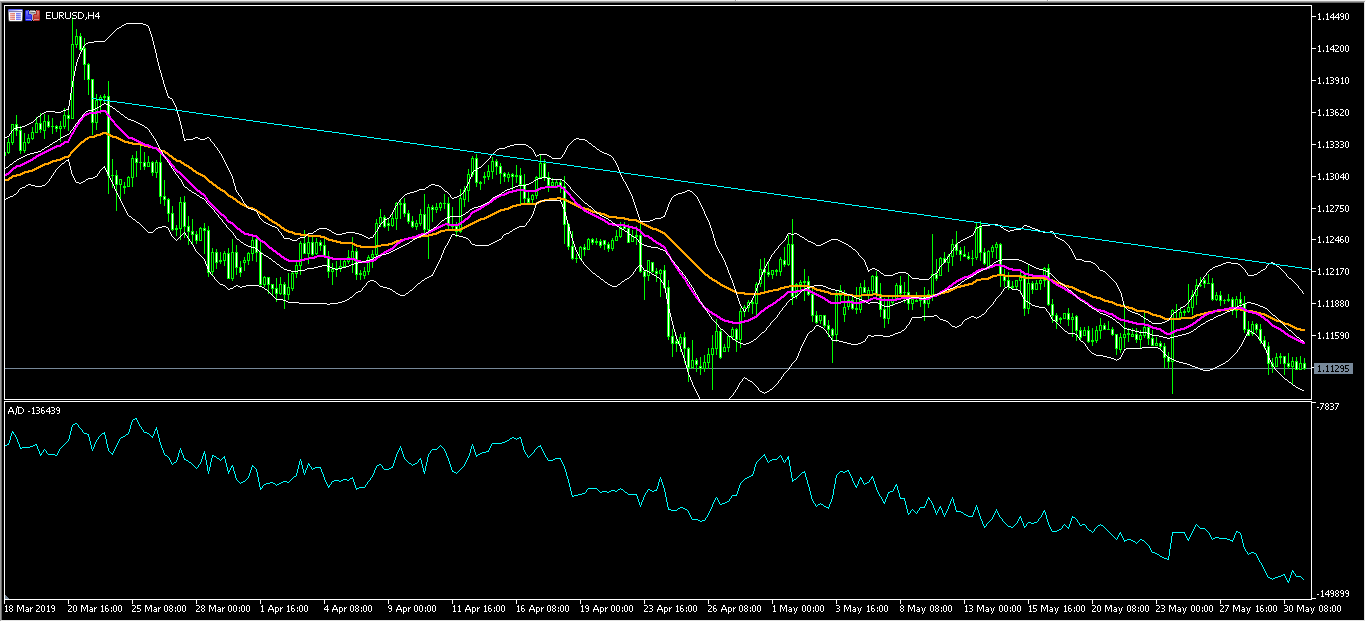
The EUR/USD pair was relatively unmoved in overnight trading. It is now trading at 1.1130. On the hourly chart, this price is below the 25-day and 50-day moving averages while the accumulation/distribution indicator is moving lower. The price is slightly above the lower line of the Bollinger Bands. The pair could remain along these levels as the month comes to an end.
XAU/USD
The XAU/USD pair rose sharply after the announcement of Mexican tariffs by the US President. The pair reached a high of 1293.12. On the hourly chart below, the price is slightly above the 61.8% Fibonacci Retracement level. It is also slightly lower than the upper line of the Bollinger Bands. It is above the overbought level of 70. The MACD has continued to rise. Gold will likely continue rising as the trade war issues escalate.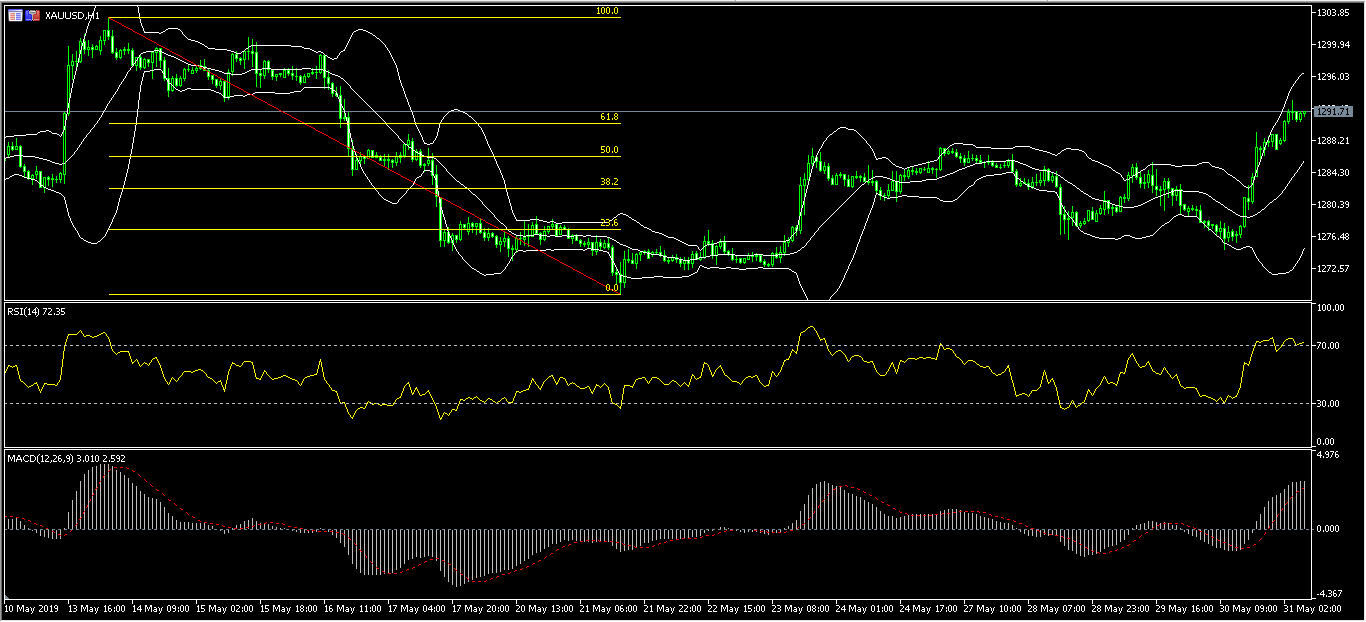
USD/JPY
The USD/JPY declined as traders moved to havens following the Mexican tariff threat. The pair reached a low of 109.11. On the 30-minute chart, the price is along the lower line of the Bollinger Bands. The RSI has dropped below the oversold level of 30. The momentum indicator and the on-balance volumes continue to decline. The pair will likely continue to drop to test the 109.00 level.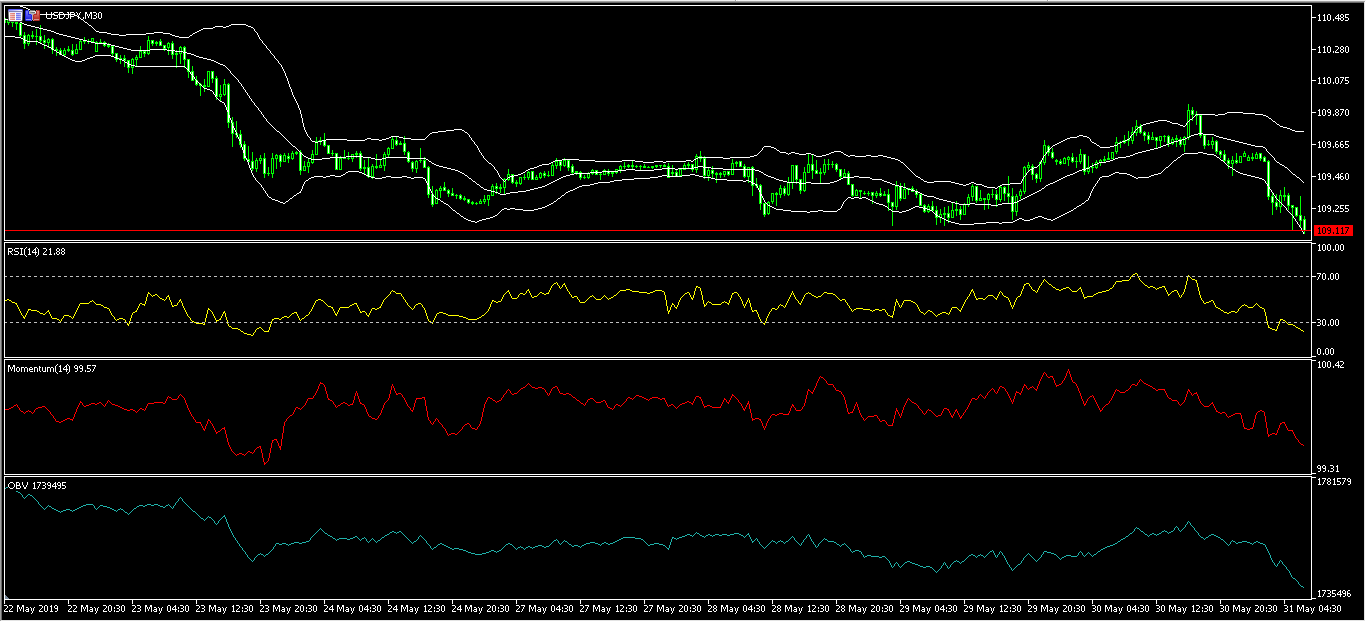
AUD/USD Daily Outlook
Daily Pivots: (S1) 0.6895; (P) 0.6916; (R1) 0.6934; More...
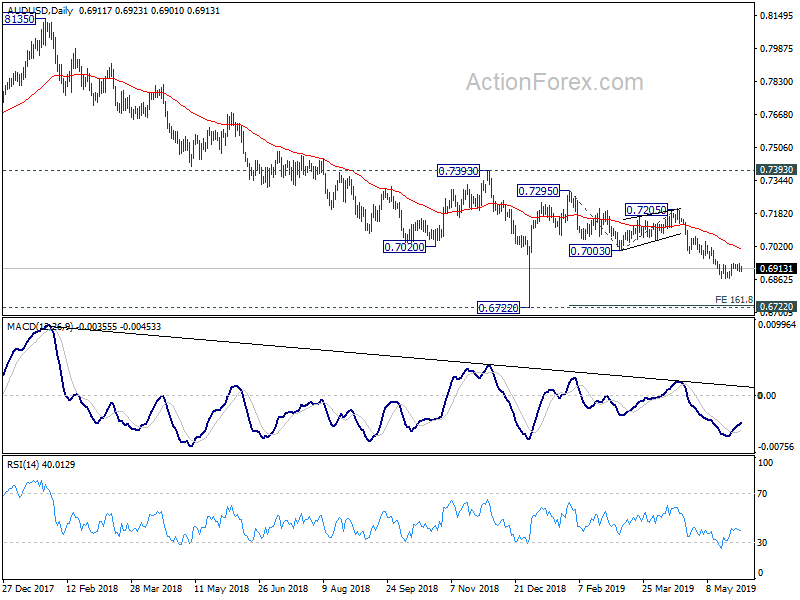
AUD/USD's consolidation from 0.6864 is still extending and intraday bias remains neutral. Further recovery could be seen but upside should be limited by 0.6988 support turned resistance to bring fall resumption. On the downside, break of 0.6864 resume the fall from 0.7295 to 161.8% projection of 0.7295 to 0.7003 from 0.7205 at 0.6733, which is close to 0.6722 low.
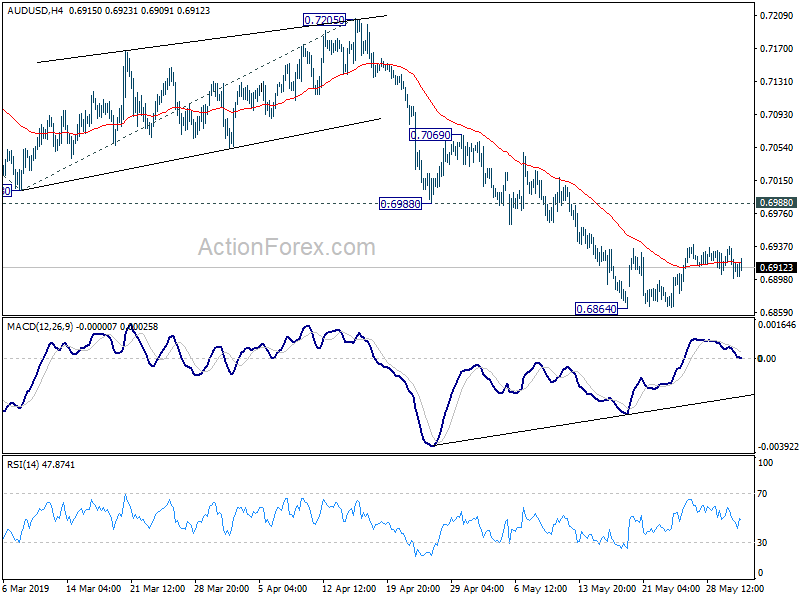
In the bigger picture, with 0.7393 key resistance intact, medium term outlook remains bearish. The decline from 0.8135 (2018 high) is seen as resuming long term down trend from 1.1079 (2011 high). Decisive break of 0.6826 (2016 low) will confirm this bearish view and resume the down trend to 0.6008 (2008 low). However, firm break of 0.7393 will argue that fall from 0.8135 has completed. And corrective pattern from 0.6826 has started the third leg, targeting 0.8135 again.