Sample Category Title
EUR/USD Pressured By 100– And 200-Hour SMAs
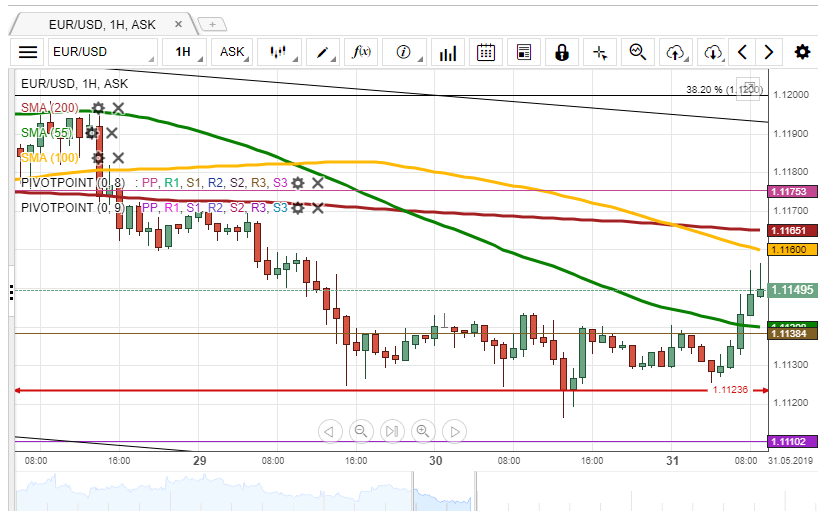
During the previous trading session, the EUR/USD currency pair tried to surpass the 2018/2019 minimum at 1.1124. During today's morning, the pair reversed north.
Note, that the exchange rate is pressured by the 100– and 200-hour SMAs, currently located circa 1.1160. If the given resistance holds, it is likely, that a reversal south could occur in the nearest future, and the rate could re-test the given minimum.
Otherwise, it is expected, that the pair could target the upper boundary of the short-term descending channel located in the 1.1180/1.1190 range. Note, that the rate has to surpass the weekly PP at 1.1175.
Tariffs On Mexico, JPY In Spree
New Tariffs on Mexico
In the G10 yields are falling. In the U.S, there have been periods were inverted yields curves have not to lead to an economic recession. However, never has a recession transpired without an inverted yield curve. Market has been debating whether the current bond pricing is signaling, weak GDP growth or abnormality of a dysfunctional market. The curves have buckled under increase expectations that the Fed will be forced to cut interest rates in the next few years. While TIPS at 1.60% is a sign that, the bond market sees no inflation ahead. In general, we have been leading towards abnormality, as a catalyst for a severe economic contraction was had not materialized. Trade tensions have tested our outlook but each time calmer events have pulled us back from the abyss. Yet, recent actions by US President Trump suggests that walking back the damage done by threats and actual tariffs have become impossible. There are reports of corporations permanently altering supply chains to avoid potential disruptions.
US equity futures are trading lower in response to Trump's recent tweet. In a typical tweeter storm, followed by a statement released by the White House, Trump said he would utilize the International Emergency Economic Powers Act to levy a 5% tariff on all goods imported from Mexico starting June 10th, and raise the tariff progressively, reaching 25% on Oct. 1st. Trade has now become Trump principal policy hammer. While the raw approach might appeal to his base, this is not how you treat allies or major trading partners. Trump wants Mexico to addressed illegal immigration to the U.S but the cross-policy approach is risky. Mexico is the US third largest trading partner, and also have levers. Mexico officials have responded with a potential 10% import tariff across the board on all imports from the United States. New tariffs on Mexico sent MXN under heavy selling pressure, which pushed USDMXN through key resistance levels, including the break above the March high at 19.6215. We would anticipate the extension of bullish momentum to 20.2070 (fibo lvl).
It might have been the Feds overtighten that has sent the US economy toward recession. But it’s Trump ignorance that will push the American economy off the cliff.
JPY in spree as trade war narrative resumes
The resumption of trade war headlines has pushed JPY into demand, as optimism over a potential recovery of world economies along 2H 2019 is mitigated. June Trump – Xi meeting at G20 summit in Japan is not expected to show much progress and the threat of potential tariffs on Mexico are not putting investors in the mood. Furthermore, recent four-day Trump – Abe meeting in Japan did not bring much as both leaders face resp. presidential elections in November 2020 and upper house elections along 21 July 2019. USD/JPY is now down -0.80% year-to-date and trades at 4 months low.
The downtrend in USD/JPY from 109.62 (30 May 2019) sustains as the pair confirms a bearish breakout after reaching major support at 108.89 (31 January 2019). The 1-month 25-delta risk reversal gauge dropped from -1.54% to -1.83%, suggesting higher volatility on the downside. Economic data published in Japan are generally positive, with April unemployment rate dropping by 0.10% to 2.40% despite a wide gap in the job availability metric given at 1.63%, its higher level in more than 40 years and which confirms major manpower shortage due to an aging population. April industrial production rose 0.60% from prior month (y/y: -1.10%) as firms were ramping up production following 10-day Golden Week Holidays while retail sales came flat m/m (y/y: 0.50%).
In current setting, we expect USD/JPY collapse to stop, as US data should somewhat support the greenback. Approaching 109.20 short-term.
Financial Markets Are Under Pressure Due To Global Trae Tensions
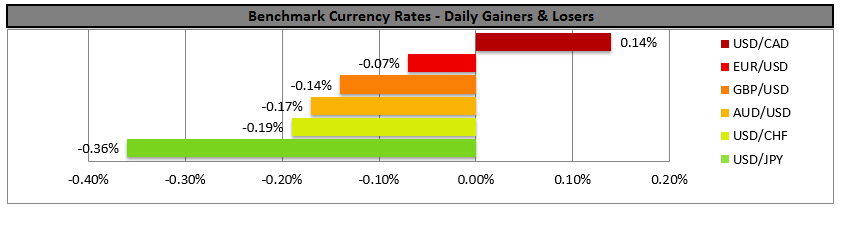
Yesterday, the US dollar did not change a lot against the basket of major currencies. The dollar index (#DX) closed with a slight increase (+0.02%). Investors' sentiment has worsened after it became known that the United States would intend to impose 5% duties on all Mexican goods from June 10. "On June 10th, the United States will impose a 5% Tariff on all goods coming into our Country from Mexico, until such time as illegal migrants coming through Mexico, and into our Country, STOP," Trump tweeted. The president also noted that the size of the tariff would increase until the flow of migrants stopped. Trade tensions with other countries could adversely affect the growth rate of the global economy.
Yesterday, mixed economic data from the US was also published. Thus, GDP growth (q/q) counted to 3.1%, which met the expectations of experts. However, pending home sales index declined by 1.5% in April, although investors forecasted growth by 0.9%.
Today, during the Asian trading session China manufacturing PMI has been published, which has counted to 49.4 in May and has occured to be worse than the expected value of 49.9. We expect important economic statistics from Canada.
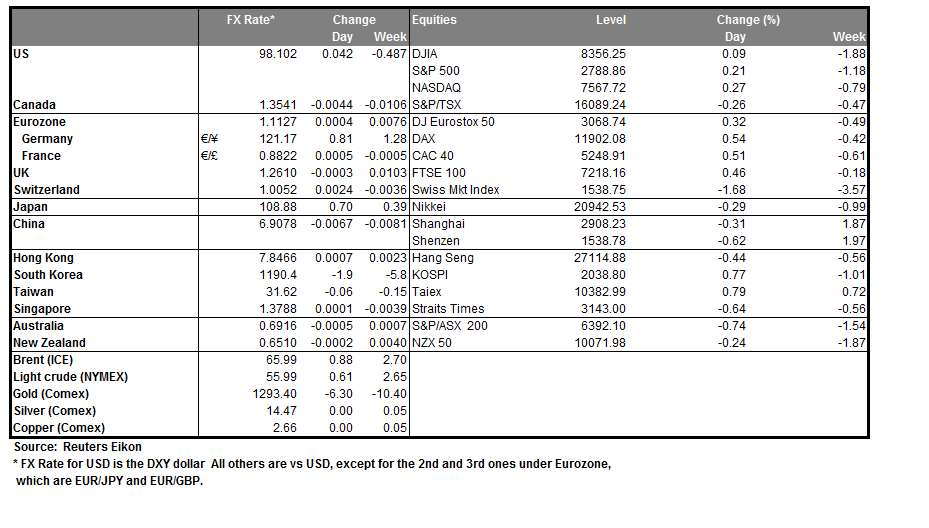
The "black gold" prices fell by more than 4% due to trade conflicts. At the moment, futures for the WTI crude oil are testing $56.00 per barrel. At 20:00 (GMT+3:00) a report on Baker Hughes oil rig count will be published.
Market Indicators
- Yesterday, the main US stock indices closed in the positive zone: #SPY (+0.27%), #DIA (+0.24%), #QQQ (+0.42%).
- The 10-year US government bonds yield fell significantly. Currently, the indicator is at the level of 2.17-2.18%.
The news feed on 2019.05.31:
- Canada GDP data at 15:30 (GMT+3:00);
- Core personal consumption expenditures (PCE) price index in the US at 15:30 (GMT+3:00);
- Michigan consumer expectations and sentiment at 17:00 (GMT+3:00).
AUD/USD Watch For The Breakout Of The Range
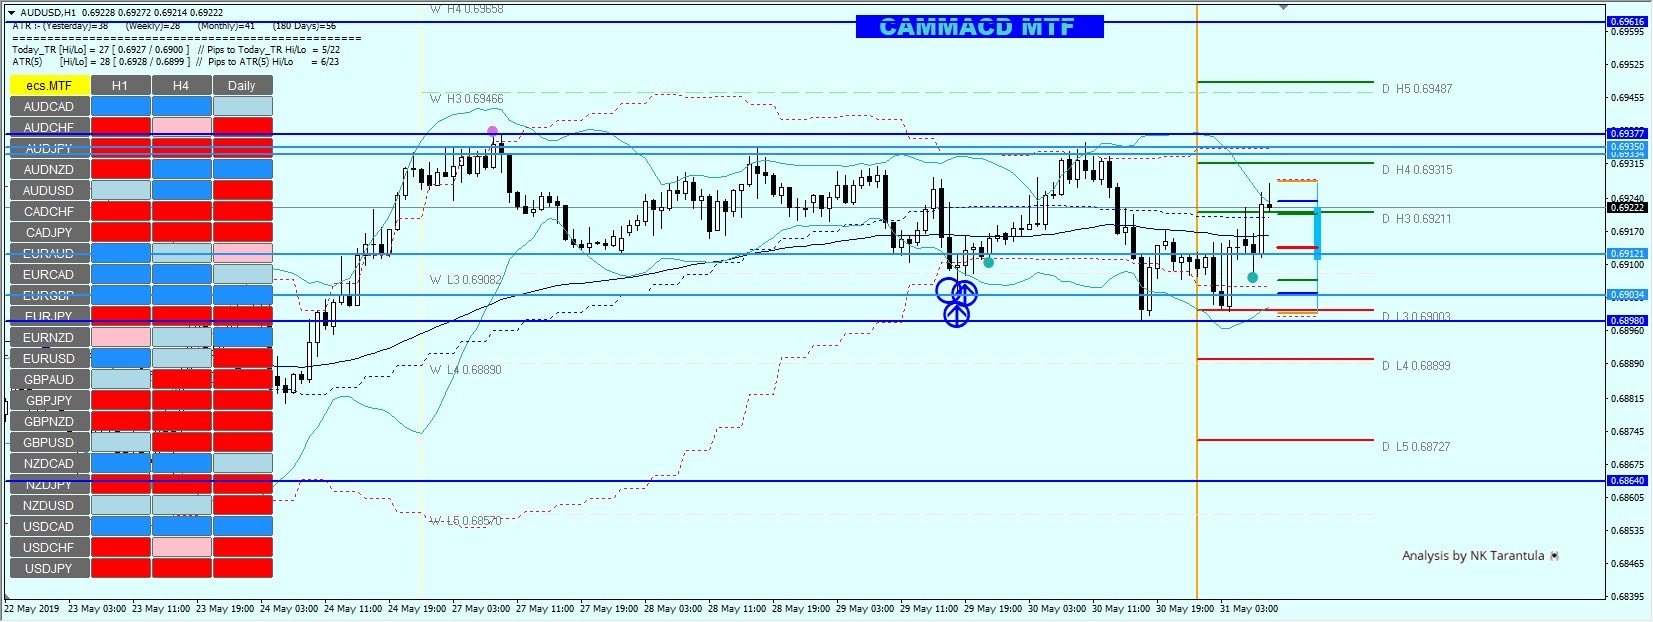
The AUD/USD has been ranging between historical levels of S/R. Those are represented by the blue lines on the chart.
However, we can see that the price is currently trying to push towards 0.6930 zone. Breakout of 0.6937 should target 0.6961. However a rejection off the 0.6930 zone might aim for 0.6898. A break below aims for 0.6840. At this point, it seems that buying into dips could be a valid option as long as 0.6889 holds. For short traders, watch the reaction around 0.6937 and 0.6960 zone. It’s Friday, so we might see a 2-way price action due to profit taking.
AUD/USD Outlook: Sideways Mode Between Two Fibo Points Extends
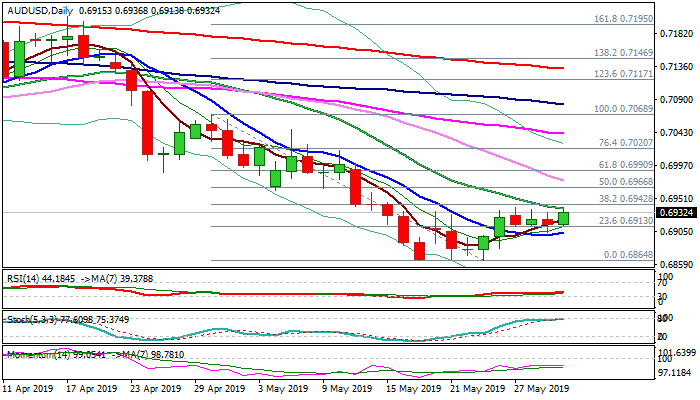
The Australian dollar regained traction and bounced from near-term base at 0.6913, after weaker than expected Australian housing data had no negative impact.
Near-term price action remains congested for the fourth straight day, limited from the downside by 0.6913 (Fibo 23.6% of 0.7068/0.6864) while falling 20SMA (0.6937) caps, guarding upper pivot at 0.6942 (Fibo 38.2% of 0.7068/0.6864).
Flat momentum and mixed setup of daily MA's (5,10,20) supports near-term neutral tone, which needs break of either side of congestion to generate fresh direction signal.
Sustained break below congestion floor, reinforced by 10SMA (0.6905) would generate negative signal and risk retest of key support of 0.6864, where the base is forming.
Bullish scenario requires close above 20SMA and 0.6942 Fibo barrier to signal extension of recovery from 0.6864 base.
Res: 0.6937, 0.6942, 0.6966, 0.6990
Sup: 0.6913, 0.6904, 0.6881, 0.6864
German 10-year yield hit record low, EUR/CHF at critical juncture
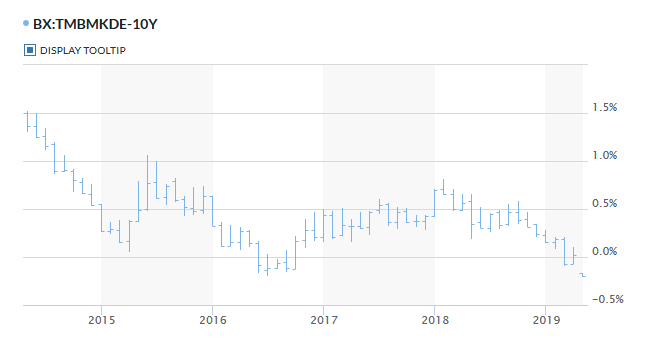
German 10-year bund yield dives sharply to new record low in the wake of Trump's action to use tariffs to force Mexico to fix border security problem of the US. 10-year bund yield hits as low as -0.206 and is currently down -0.031 at -0.202.
European stocks are broadly lower, with FTSE currently down -0.95%. DAX down -1.60% and CAC down -1.23%. DOW future is currently down -250 pts and is set to lose 25000 handle again at open.
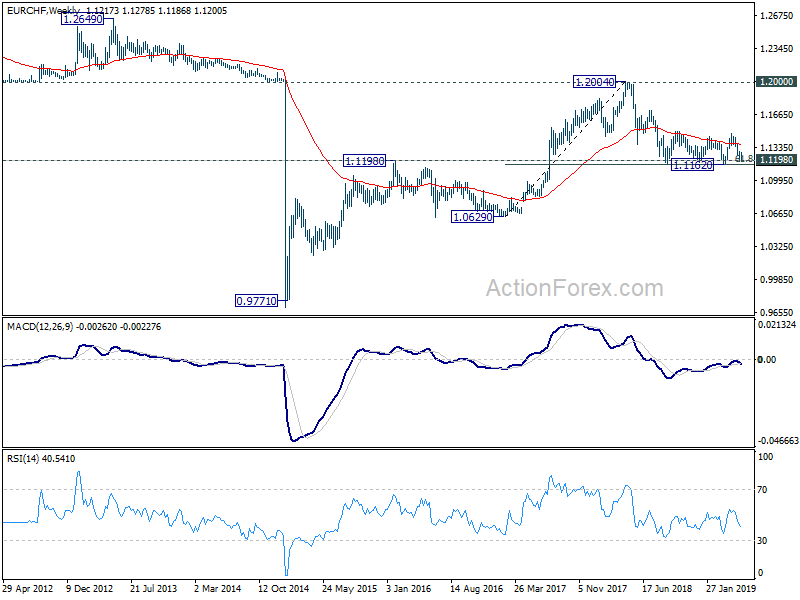
Yen and Swiss Franc surge on risk aversion naturally. A key focus is weakness in EUR/CHF, which is having its sight back on 1.1162 low. Firm break there will extend the fall from 1.2004. More importantly, it will then argue that such decline is not a correction but part of a long term down trend. And in that case, we might see EUR/CHF heading back to 1.0629 support in medium to long term.
USDMXN Rockets To 4-Month Peak, Bias Switches To Bullish
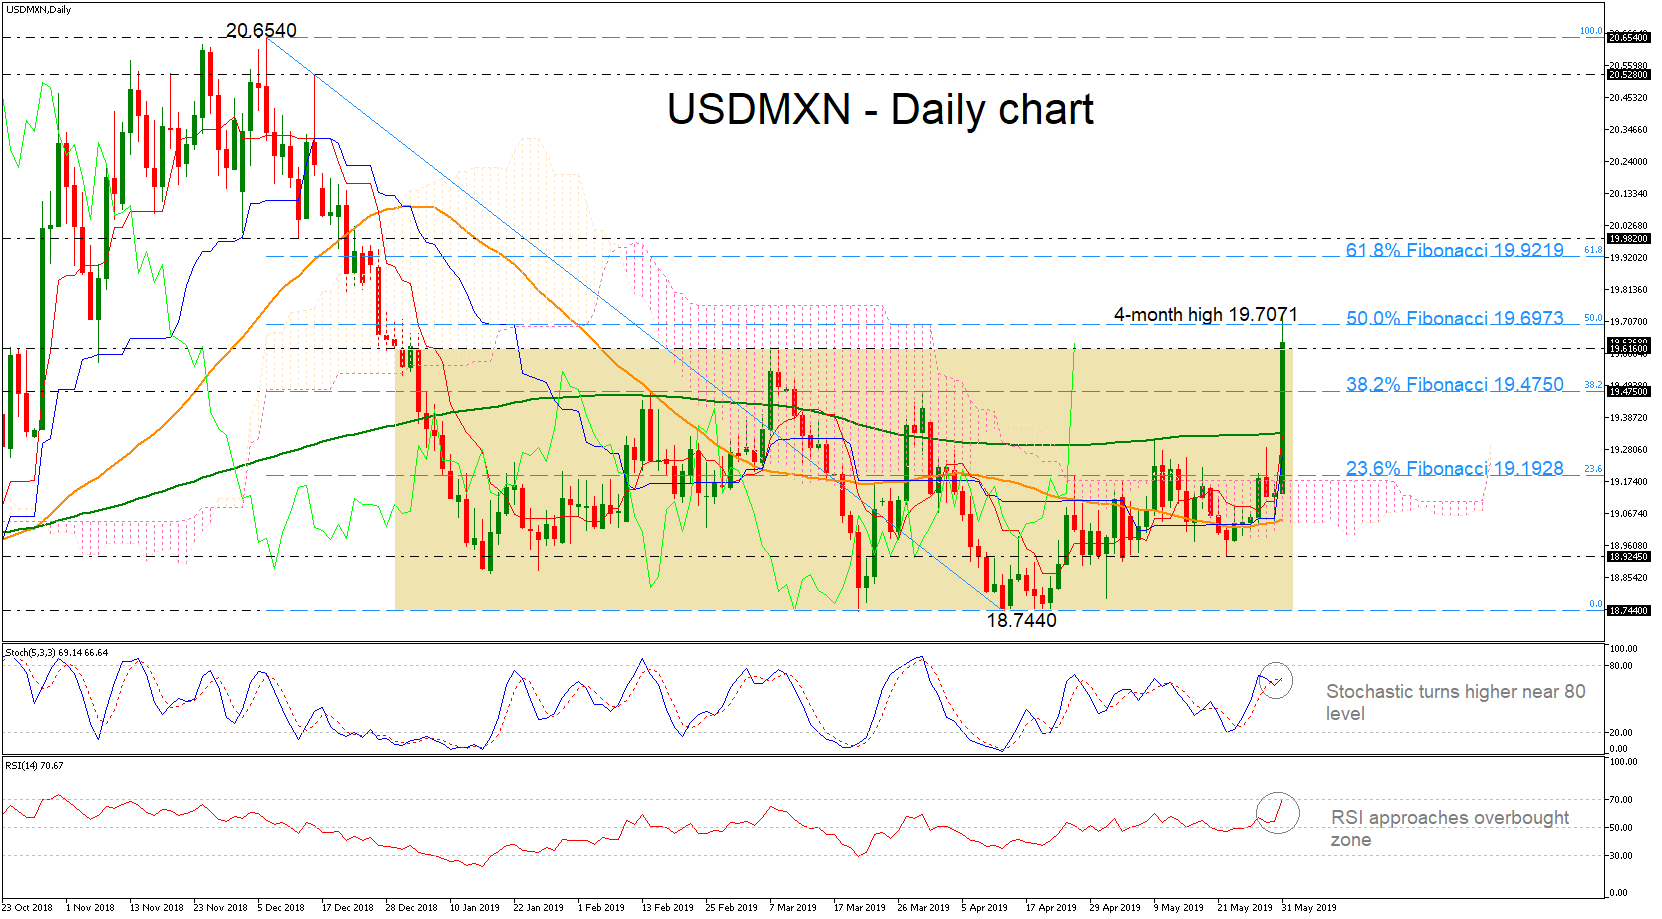
USDMXN skyrocketed to a fresh four-month high of 19.7071, penetrating the consolidation area of 18.7440 – 19.7071 to the upside and switching the short-term picture from neutral to positive.
The technical indicators are feeding prospects for a positive short-term trading; the RSI is entering overbought territory, while the stochastic trends around the 80 level. Also, in Ichimoku indicators, the red Tenkan-sen keeps rising above the blue Kijun-sen.
If the 50.0% Fibonacci retracement level of the downleg from 20.6540 to 18.7440 around 19.6973 proves easy to overcome, the spotlight would turn to the 61.8% Fibonacci of 19.9219 and the 19.9820 inside swing bottom, reached on December 12, confirming the positive structure.
A failure to overcome today’s high could send prices down to the 38.2% Fibonacci of 19.4750, which acted as strong resistance in the past. Even lower, support could be next found at the 200-day simple moving average (SMA) currently at 19.3352. More declines could drive the market straight to the 23.6% Fibonacci of 19.1928.
In the medium-term picture, USDMXN turned slightly bullish after violating its range-bound action to the upside. Should the market continue the upward pattern, the outlook may turn brighter.
The Analytical Overview Of The Main Currency Pairs
The EUR/USD currency pair
Technical indicators of the currency pair:
Prev Open: 1.11310
Open: 1.11288
% chg. over the last day: -0.02
Day's range: 1.11252 – 1.11403
52 wk range: 1.1111 – 1.2009
EUR stabilized after a long fall since the beginning of the week. The quotes are moving sideways and testing the key levels at 1.11200 and 1.11450. Donald Trump earlier announced that on June 10 the US will introduce a 5% fee on all goods imported from Mexico. The increase of tension in the world economy lowers the demand on the risky assets. Further descend of EUR/USD remains possible. Open the positions from the key levels.
The Economic News Feed for 31.05.2019:
Real Personal Consumption (MoM) (US) – 15:30 (GMT+3:00);
Michigan Expectations Indices (US) – 17:00 (GMT+3:00);
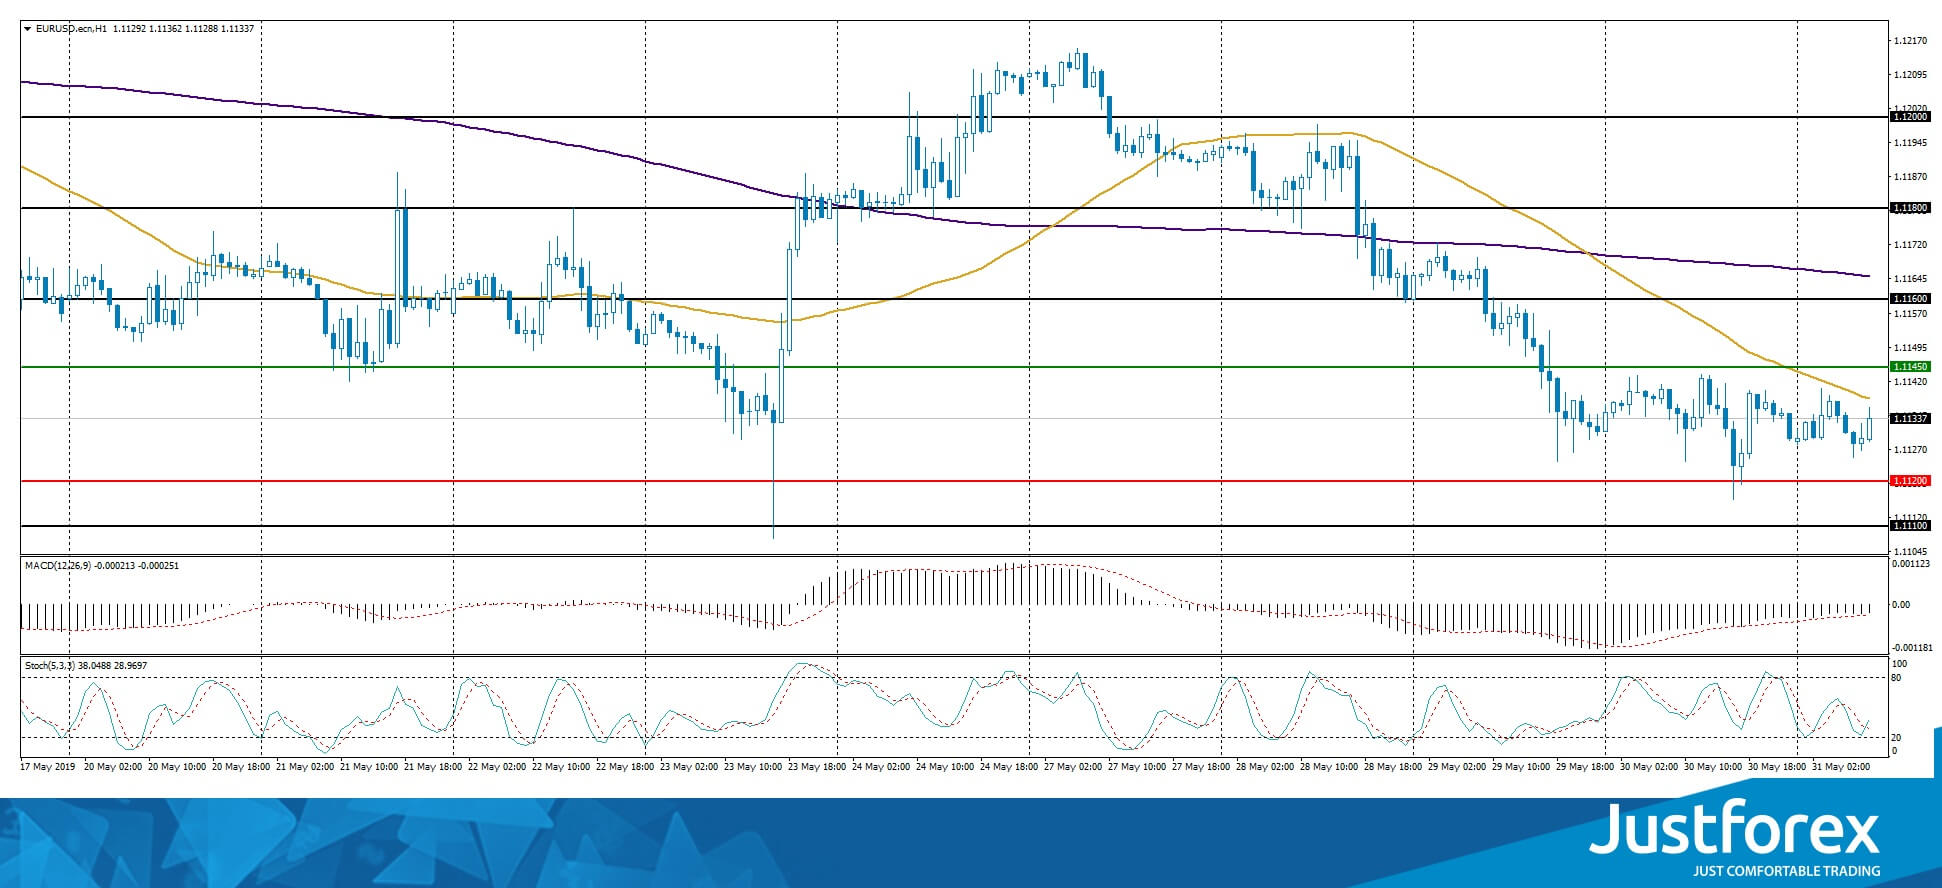
The price fixed below 50 MA and 200 MA which points to the power of the sellers.
The MACD histogram is in the negative zone but above the signal line which gives a weak signal to sell EUR/USD.
The Stochastic Oscillator is in the neutral zone, the %K line is crossing the %D line. There are no signals at the moment.
Trading recommendations
Support levels: 1.11200, 1.11000
Resistance levels: 1.11450, 1.11600, 1.11800
If the price fixes below 1.11200, expect further descend towards 1.11000-1.10700.
Alternatively, the quotes can grow towards 1.11600-1.11800.
The GBP/USD currency pair
Technical indicators of the currency pair:
Prev Open: 1.26201
Open: 1.26091
% chg. over the last day: -0.16
Day's range: 1.25988 – 1.26166
52 wk range: 1.2438 – 1.3631
GBP stabilized after a long fall. The GBP/USD quotes are consolidating around 4-month minimums. The support and resistance levels are 1.25850 and 1.26200. The financial market participants are waiting for relevant info regarding Brexit. A technical correction is possible soon. You should open positions from the key levels.
The Economic News Feed for 31.05.2019 is calm.
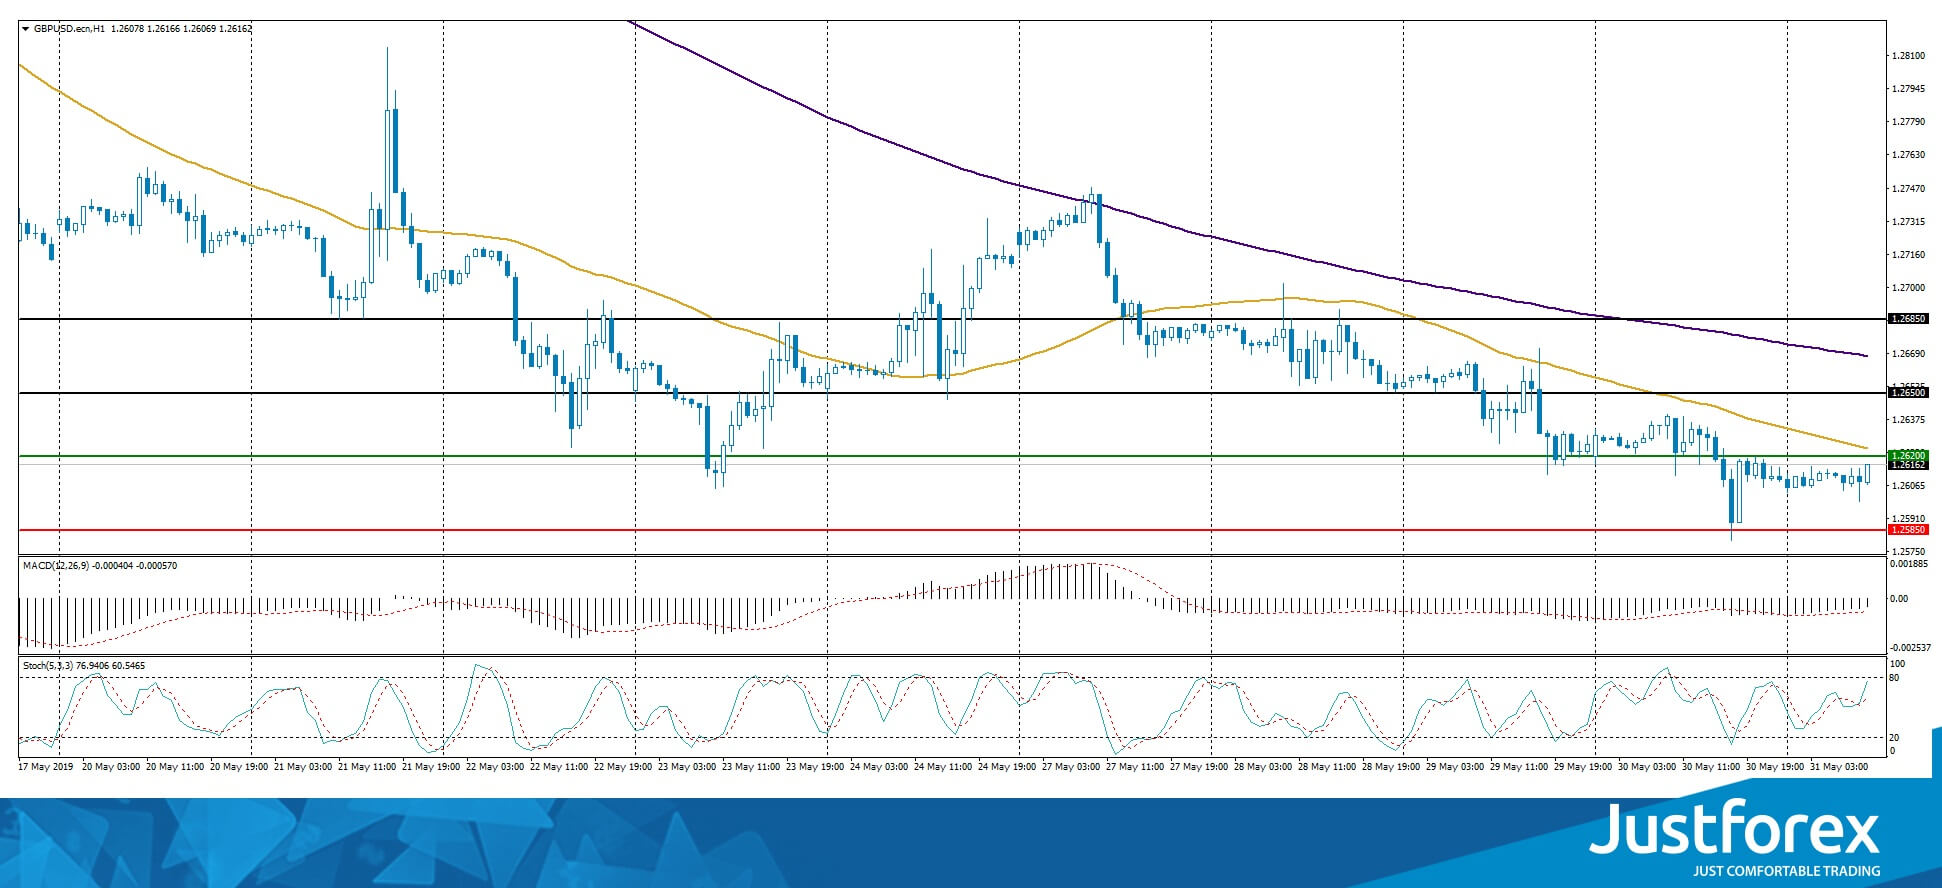
The price fixed below 50 MA and 200 MA which points to the power of the sellers.
The MACD histogram is in the negative zone but above the signal line which gives a weak signal to buy GBP/USD.
The Stochastic Oscillator is in the neutral zone, the %K line is above the %D line which points to the correction of GBP/USD.
Trading recommendations
Support levels: 1.25850, 1.25500
Resistance levels: 1.26200, 1.26500, 1.26850
If the price fixes above 1.26200, expect further correction towards 1.26500-1.26800.
Alternatively, the quotes can fall towards 1.25600-1.25400.
The USD/CAD currency pair
Technical indicators of the currency pair:
Prev Open: 1.34828
Open: 1.35164
% chg. over the last day: +0.17
Day's range: 1.34937 – 1.35205
52 wk range: 1.2727 – 1.3664
USD/CAD stabilized after a long rally. The quotes are consolidating around 1.34850 and 1.35200. The Bank of Canada kept the monetary policy at the same levels. We expect important reports from the US. Keep an eye on the oil quotes dynamics and open positions from the key levels.
At 15:30 (GMT+3:00) Canada will publish CFTC CAD speculative net positions.
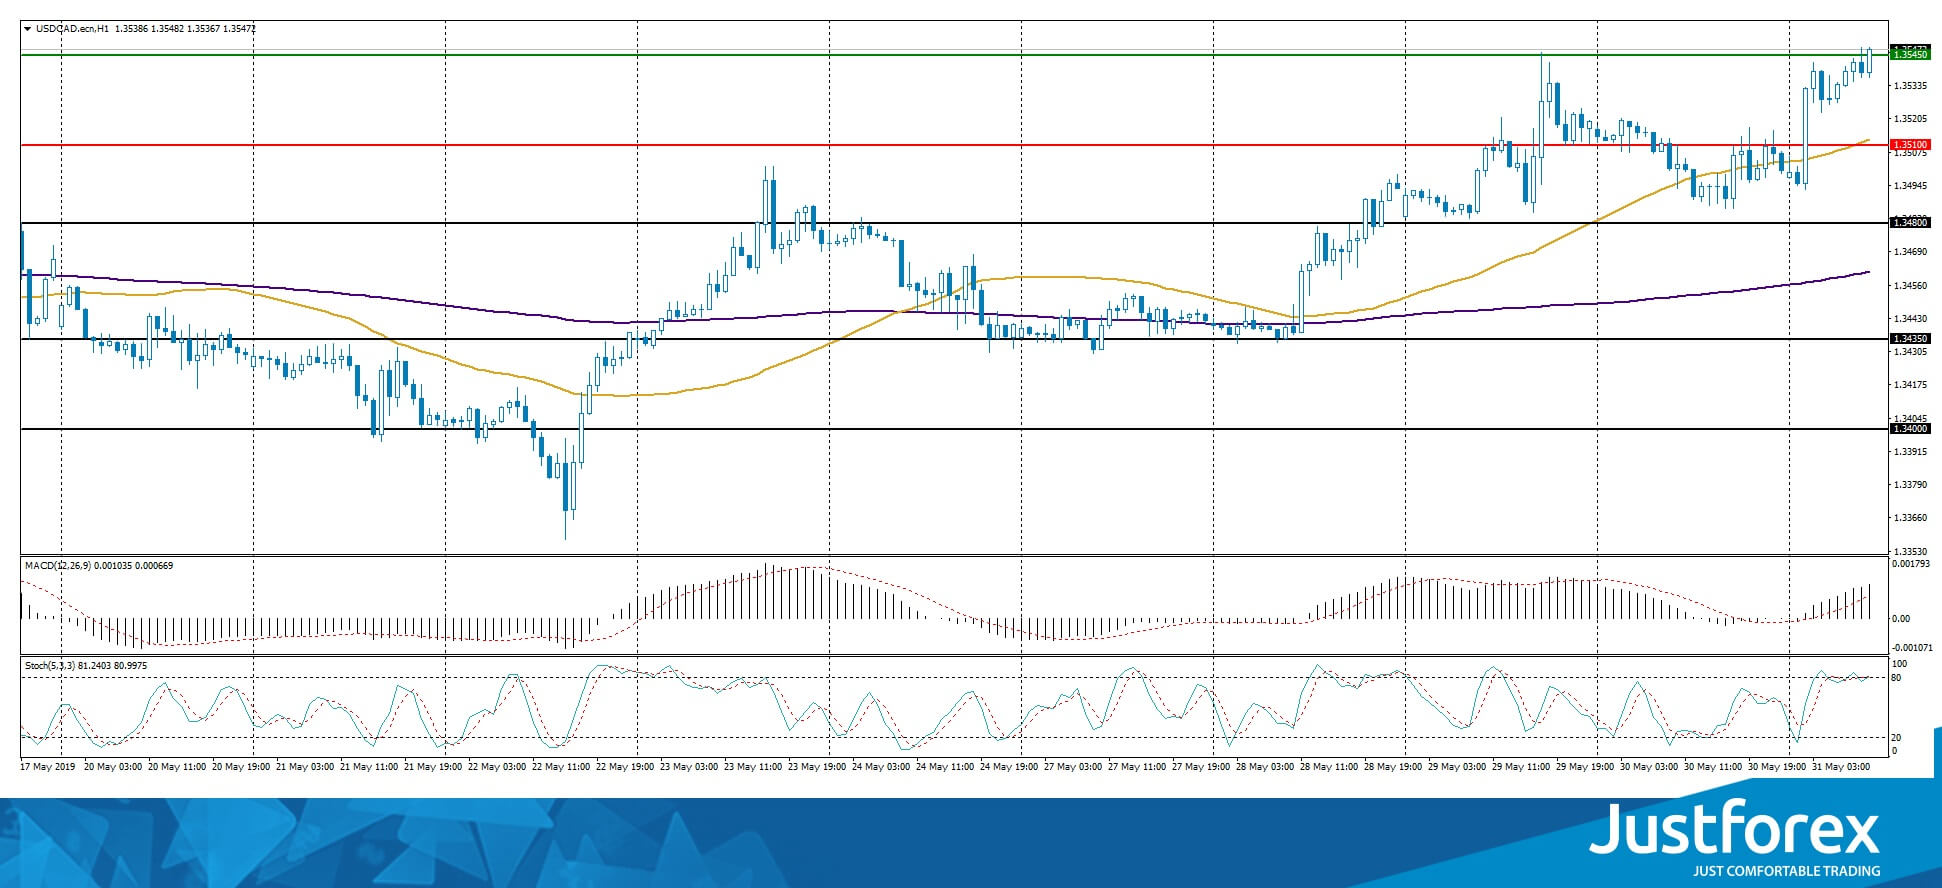
The indicators do not provide precise signals, the price is testing 50 MA.
The MACD histogram is in the positive zone but started to descend, which gives a weak signal to buy USD/CAD.
The Stochastic Oscillator is in the neutral zone, the %K line has crossed the %D line. There are no signals at the moment.
Trading recommendations
Support levels: 1.34850, 1.34550, 1.34300
Resistance levels: 1.35200, 1.35450
If the price fixes above 1.35200, expect further growth towards 1.35450-1.35700.
Alternatively, the quotes can descend towards 1.34600-1.34400.
The USD/JPY currency pair
Technical indicators of the currency pair:
Prev Open: 109.587
Open: 109.596
% chg. over the last day: +0.02
Day's range: 108.782 – 109.621
52 wk range: 104.97 – 114.56
USD/JPY started to descend. During the last two days the quotes fell by 75 points. The trading instrument updated the key extremums. The trading conflict escalation introduced new demand for the safe assets. The quotes are testing the support at 108.800 and resistance at 109.150. JPY has prospects for further descend. You should open positions from the key levels.
Keep an eye on the US news feed.
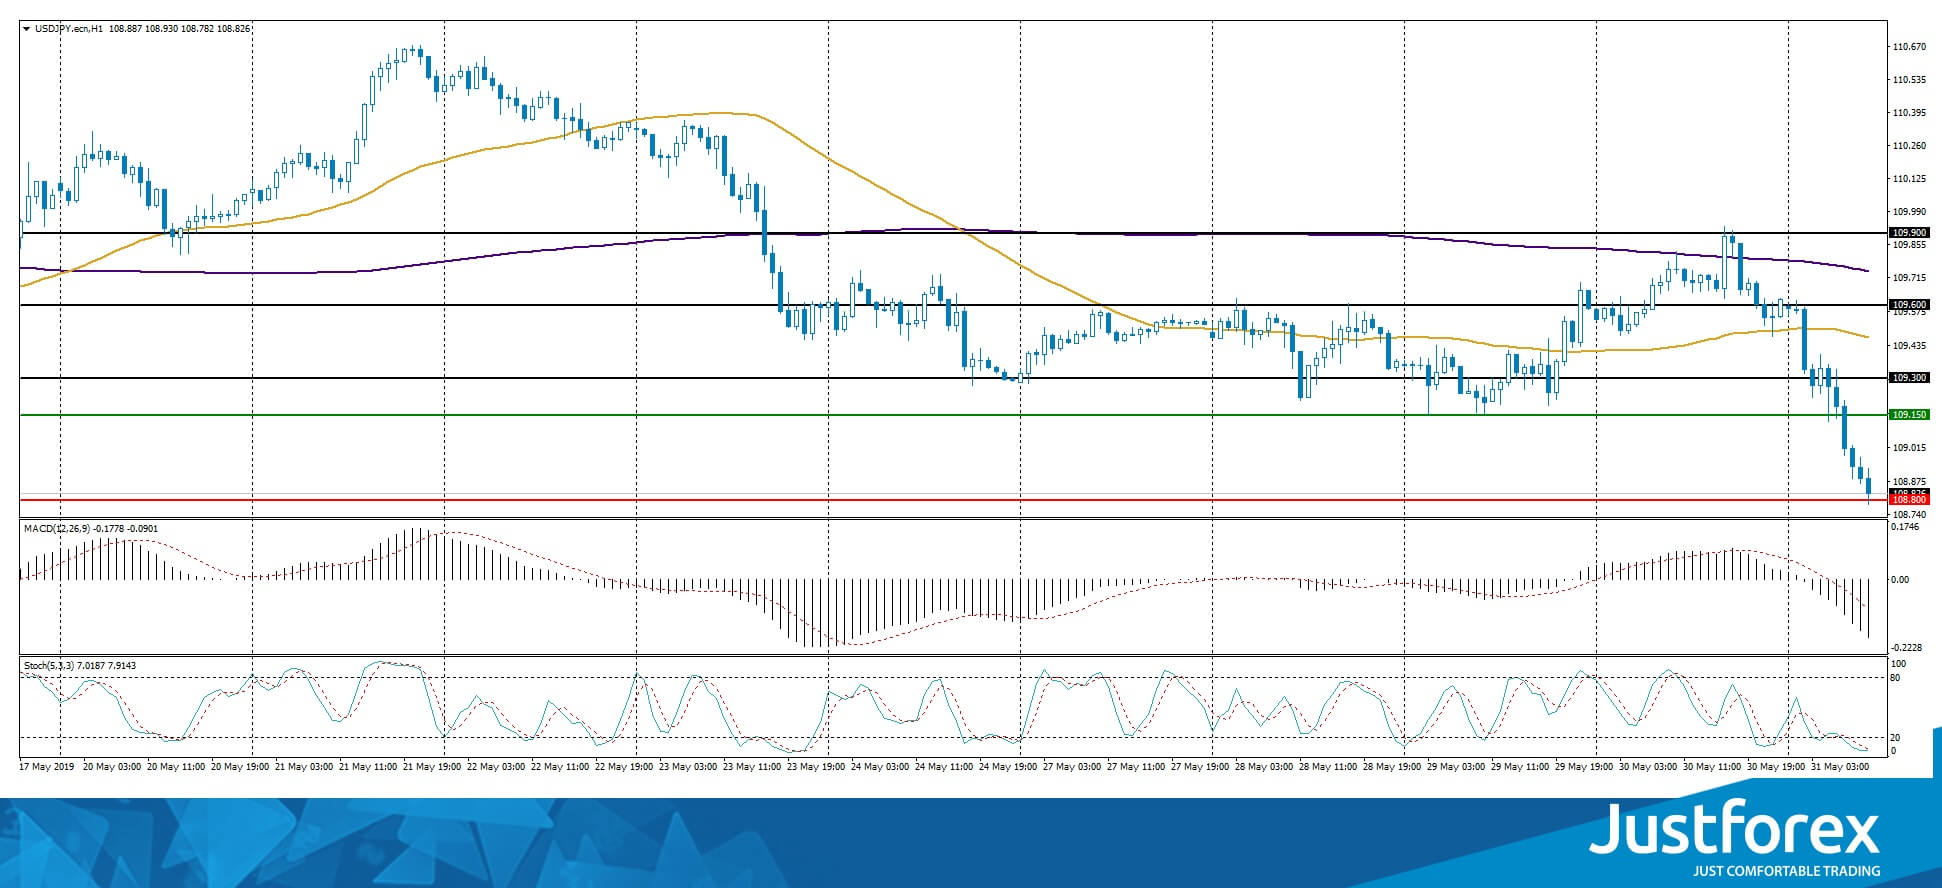
The price fixed below 50 MA and 200 MA which points to the power of the buyers.
The MACD histogram is in the negative zone and below the signal line which gives a strong signal to sell USD/JPY.
The Stochastic Oscillator is in the oversold zone, the %K line is crossing the %D line. There are no signals at the moment.
Trading recommendations
Support levels: 108.800, 108.500
Resistance levels: 109.150, 109.300, 109.600
If the price fixes below 108.800 expect further descend towards 108.500-108.300.
Alternatively, the quotes can recover towards 109.400-109.600.
MXN Weakens As US Imposes Tariffs On Mexico Over Immigrants
MXN weakened against the USD yesterday as the Trump administration announced tariffs of 5% on all imports from Mexico, until that country prevents immigrants from entering the US illegally. The newly imposed tariff is to take effect on June 10th and as per the president’s tweeter account, “until such time as illegal migrants coming through Mexico, and into our country, STOP”. The tariff is to gradually rise until the issue is dealt with and could hit also American automakers and companies having production south of the US border. Mexican officials stated that it plans to immediately retaliate until the issue has been discussed with the US first. NAFTA implications are also expected as the move is considered a clear violation of the agreement as well as WTO commitments. The new situation is expected to add further concerns about the global trading conditions and the threat of an economic slowdown, with safe havens as the Yen strengthening. Should the situation escalate further, we could see the MXN weakening even further, while safe havens could climb higher. USD/MXN had a positive gap during today’s Asian session as the MXN weakened substantially, landing above the 19.475 (S1) resistance line (now turned to support). We could see the pair maintain the bullish outlook should the Peso weaken further due to a possible escalation of the tensions in the US-Mexican relationships. Should the bulls continue to dictate the pair’s direction, we could see it breaking the 19.605 (R1) resistance line and aim for the 19.710 (R2) resistance hurdle. Should the bears take over, we could see the pair breaking the 19.475 (S1) support line and aim for the 19.365 (S2) support barrier.
Oil prices tumble, as global trade and slowdown worries grow
Oil prices dropped yesterday, despite US oil inventories decreasing a bit as shown by the EIA. Trade tensions and worries about a possible slowdown if not a recession, had a detrimental effect on oil prices, as demand for black gold could drop. Also, according to a Reuter’s survey, Saudi production levels raised in May, yet may still prove short to compensate for the loss of Iran’s exports. On the other hand the US production seems to have returned to record high levels of 12.3 million bpd (barrels per day). Should the prementioned worries intensify and production continue to be raised, we could see oil prices dropping further. WTI prices dropped yesterday, breaking consecutively the 59.10 (R2) and the 57.75 (R1) support lines, (now turned to resistance). Should worries about a possible economic slowdown be intensified, we could see oil prices dropping further and breaking the 56.00 (S1) support line aiming for the 54.45 (S2) support level. On the flip side should WTI come under the buying interest of the markets, we could see it breaking the 57.75 (R1) resistance line and aim for the 59.10 (R2) resistance level.
Other economic highlights, today and early tomorrow
Today during the European session we get Germany’s retail sales for April and later the preliminary HICP rate for May. In the American session, we get from the US the consumption rate and core PCE price index for April and a bit later the University of Michigan final Consumer Sentiment reading for May and the Baker Hughes oil rig count figure. Also during today’s Asian session, we get Canada’s GDP growth rate for Q1. In Monday’s Asian session, we get China’s Caixin Manufacturing PMI for May. Please note that Atlanta Fed President Bostic is scheduled to speak and New York Fed President William’s speech will be released.
USD/MXN H4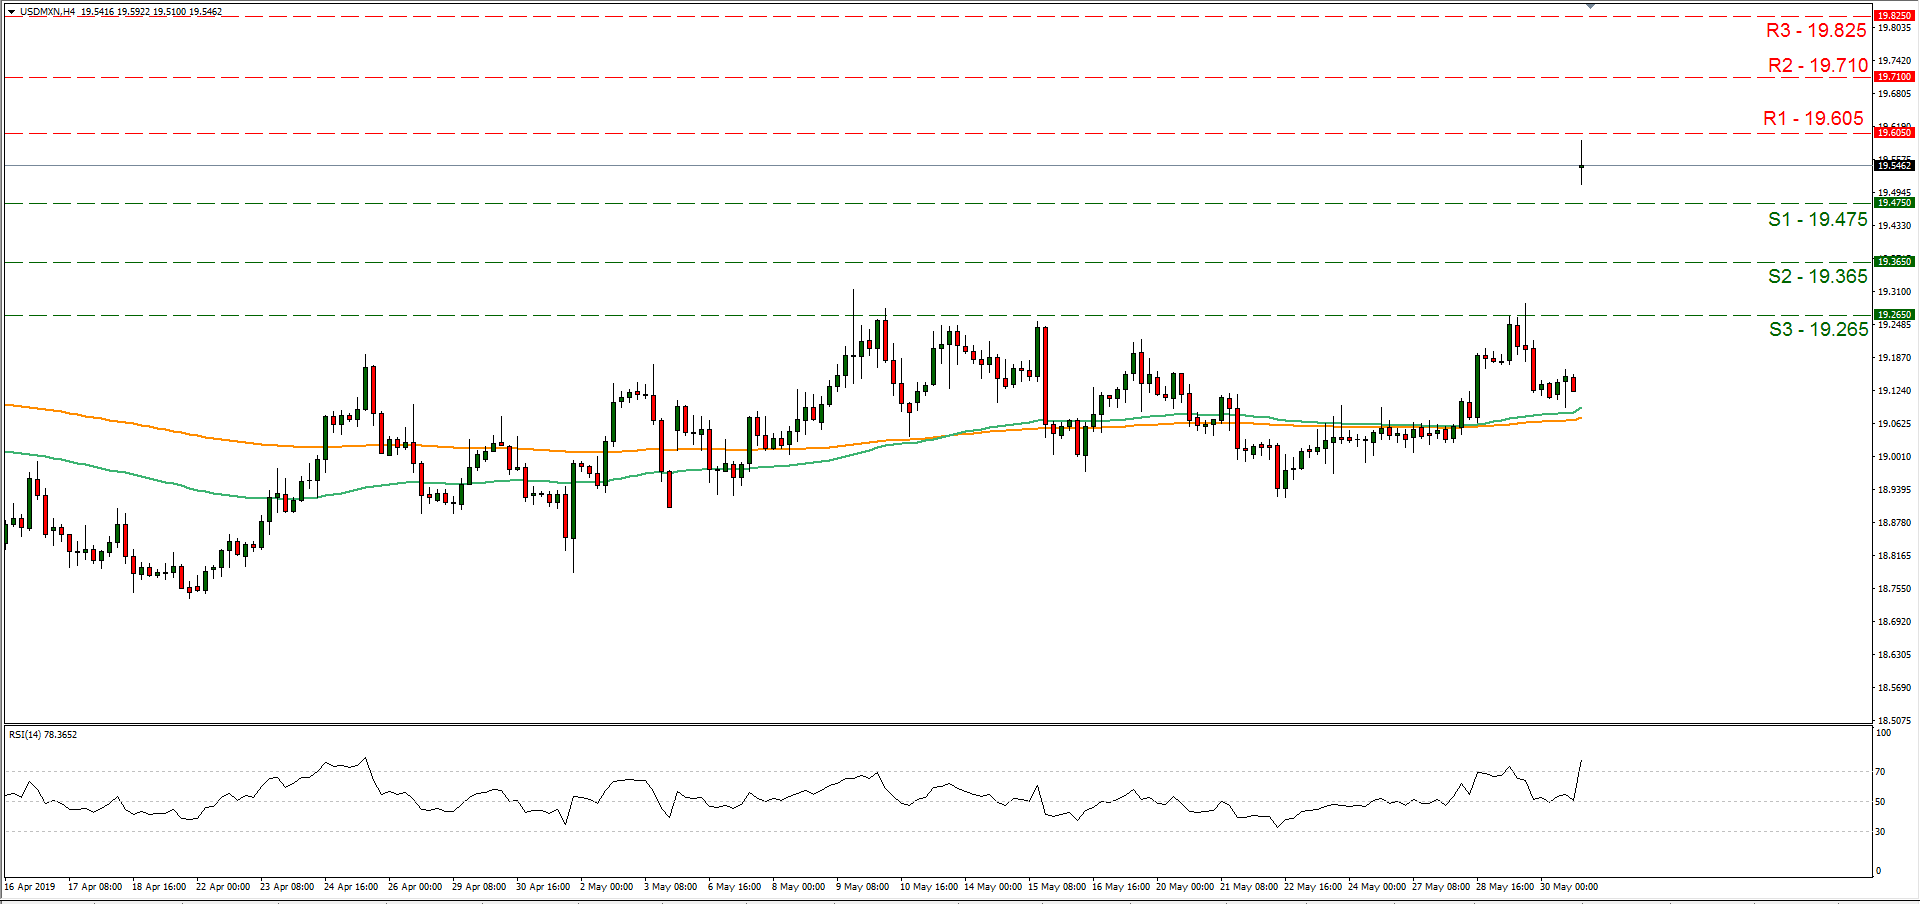
Support: 19.475 (S1), 19.365 (S2), 19.265 (S3)
Resistance: 19.605 (R1), 19.710 (R2), 19.825 (R3)
WTI H4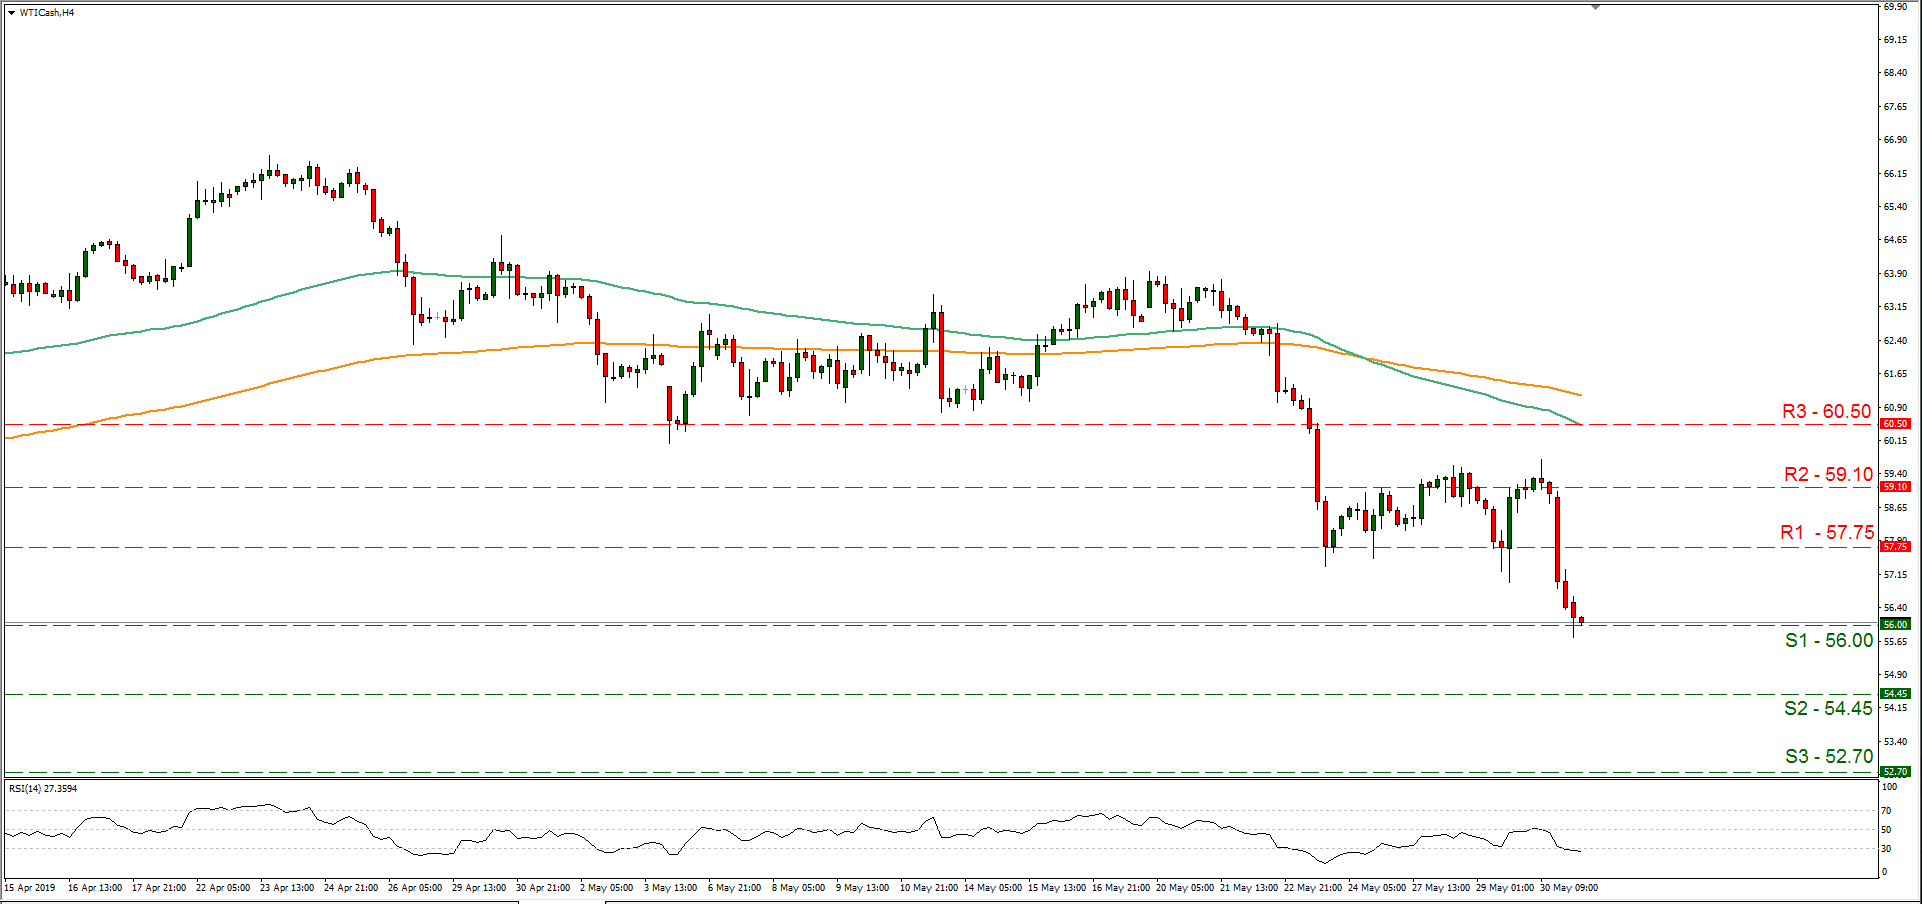
Support: 56.00 (S1), 54.45 (S2), 52.70 (S3)
Resistance: 57.75 (R1), 59.10 (R2), 60.50 (R3)
GBPAUD Forms Double Top Pattern
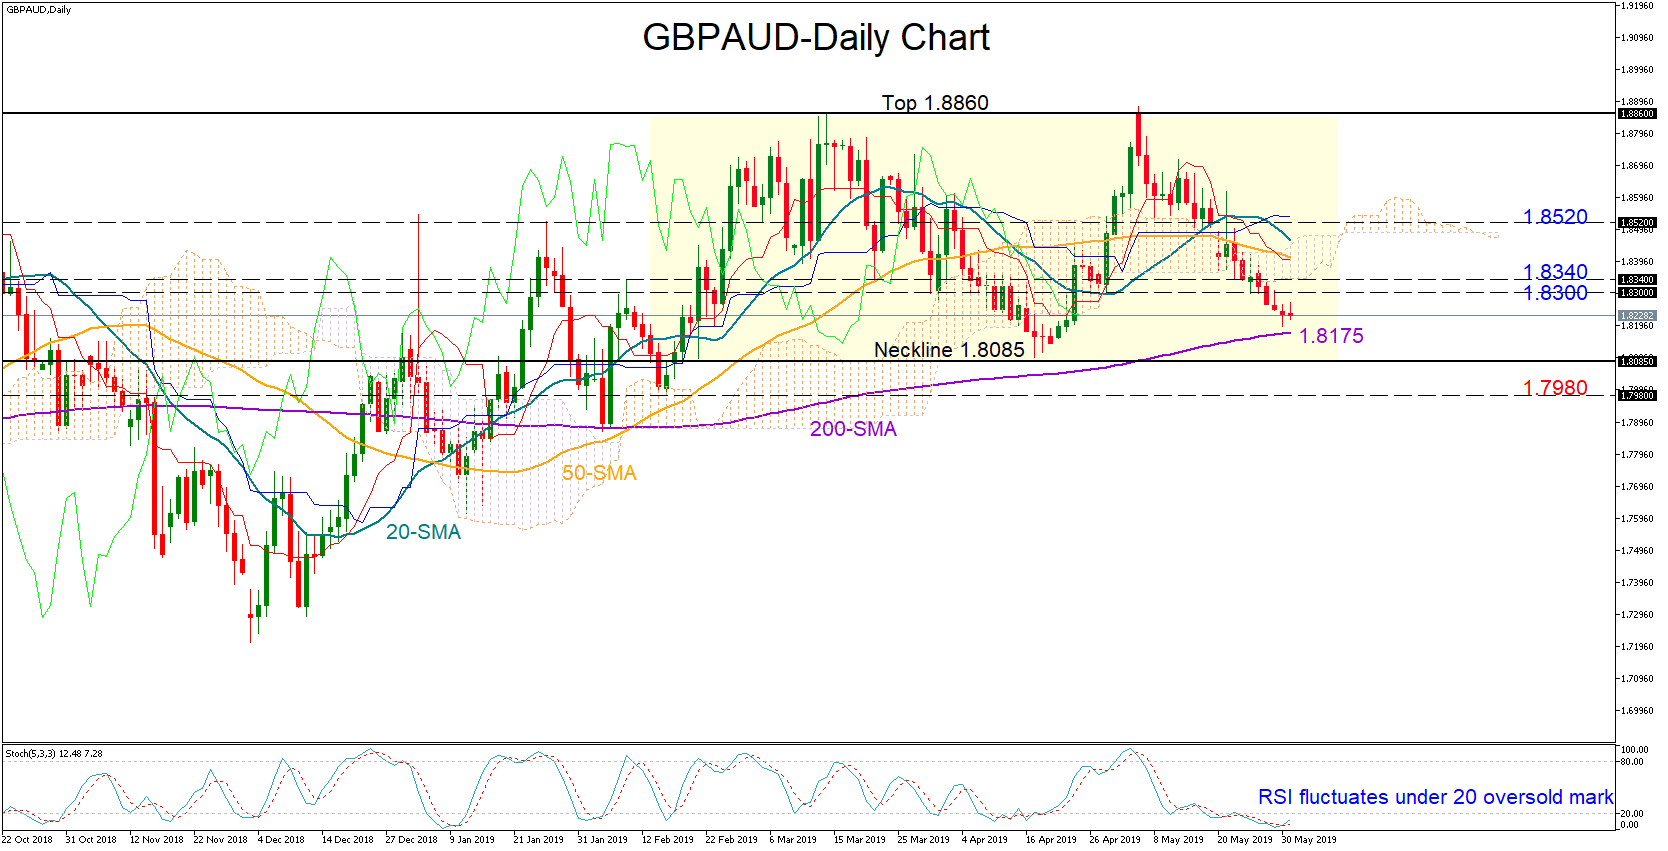
GBPAUD has been in a congestion zone since mid-February, in what has started to look like a double top formation. The price, however, needs to break below the neckline positioned around 1.8095 to confirm the bearish pattern but with Stochastics warning over an oversold market, such a move may come with a delay.
The 200-day simple moving average (SMA) currently at 1.8175 could halt downside movements ahead of the neckline. Crossing under the 1.8085 support area, the sell-off could turn more aggressive, with the bears probably targeting the 1.7980 number next.
Should the market change direction to the upside, resistance could initially emerge between 1.83-1.8340. Even higher, a rally above the Ichimoku cloud and more importantly above the strong barrier of 1.8520 could extend upside momentum.
Meanwhile in the medium-term picture, the pair remains neutral as long as it trades within the 1.8860-1-8085 region. The negative slope in the 50-day SMA reduces chances for a more positive outlook.
In brief, GBPAUD looks bearish and oversold in short-term, while in the medium-term it holds a neutral profile.