Sample Category Title
NZD/USD Sell Signals Today
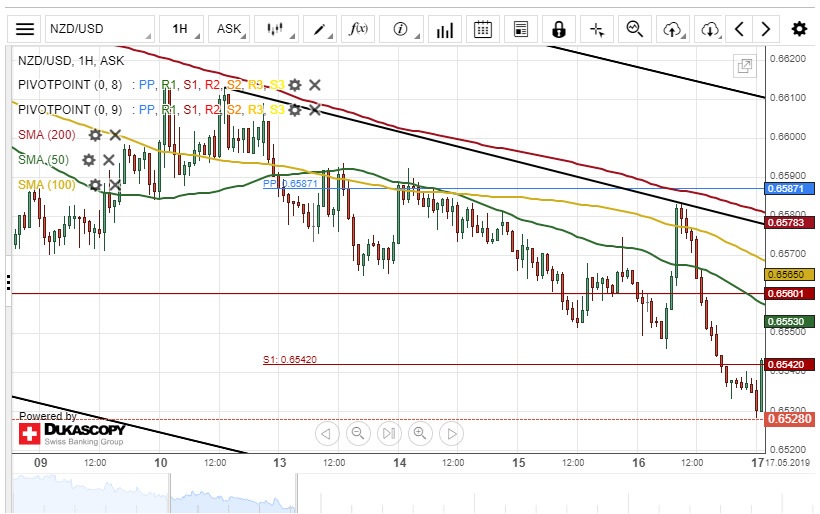
The New Zealand Dollar depreciated about 54 base points against the US Dollar on Thursday. The currency pair breached both the monthly pivot point at 0.6560 and the weekly S1 at 0.6542 during the previous session.
Technical indicators flash sell signals on both the smaller and the larger time frame charts. Therefore, it is likely that the decline of the exchange rate will continue within this session. The potential targets for bearish traders will be near a psychological support level at 0.6520.
However, the currency exchange rate might make a brief retracement towards the 50-hour SMA at 0.6554 today.
The Analytical Overview Of The Main Currency Pairs
The EUR/USD currency pair
Technical indicators of the currency pair:
Prev Open: 1.12017
Open: 1.11724
% chg. over the last day: -0.26
Day's range: 1.11706 – 1.11842
52 wk range: 1.1111 – 1.2009
EUR/USD started to descend and updated the local minimums. The demand for USD grew after the release of positive reports and growth of the 10-year US Treasury bonds yield. The investors are waiting for more data regarding the trading agreement between the US and China. The local support and resistance levels are 1.11650 and 1.11850. EUR has prospects for further descend
The Economic News Feed for 17.05.2019:
Consumer Price Index (EU) – 12:00 (GMT+3:00);
Expectation Index by the University of Michigan (EU) – 17:00 (GMT+3:00);
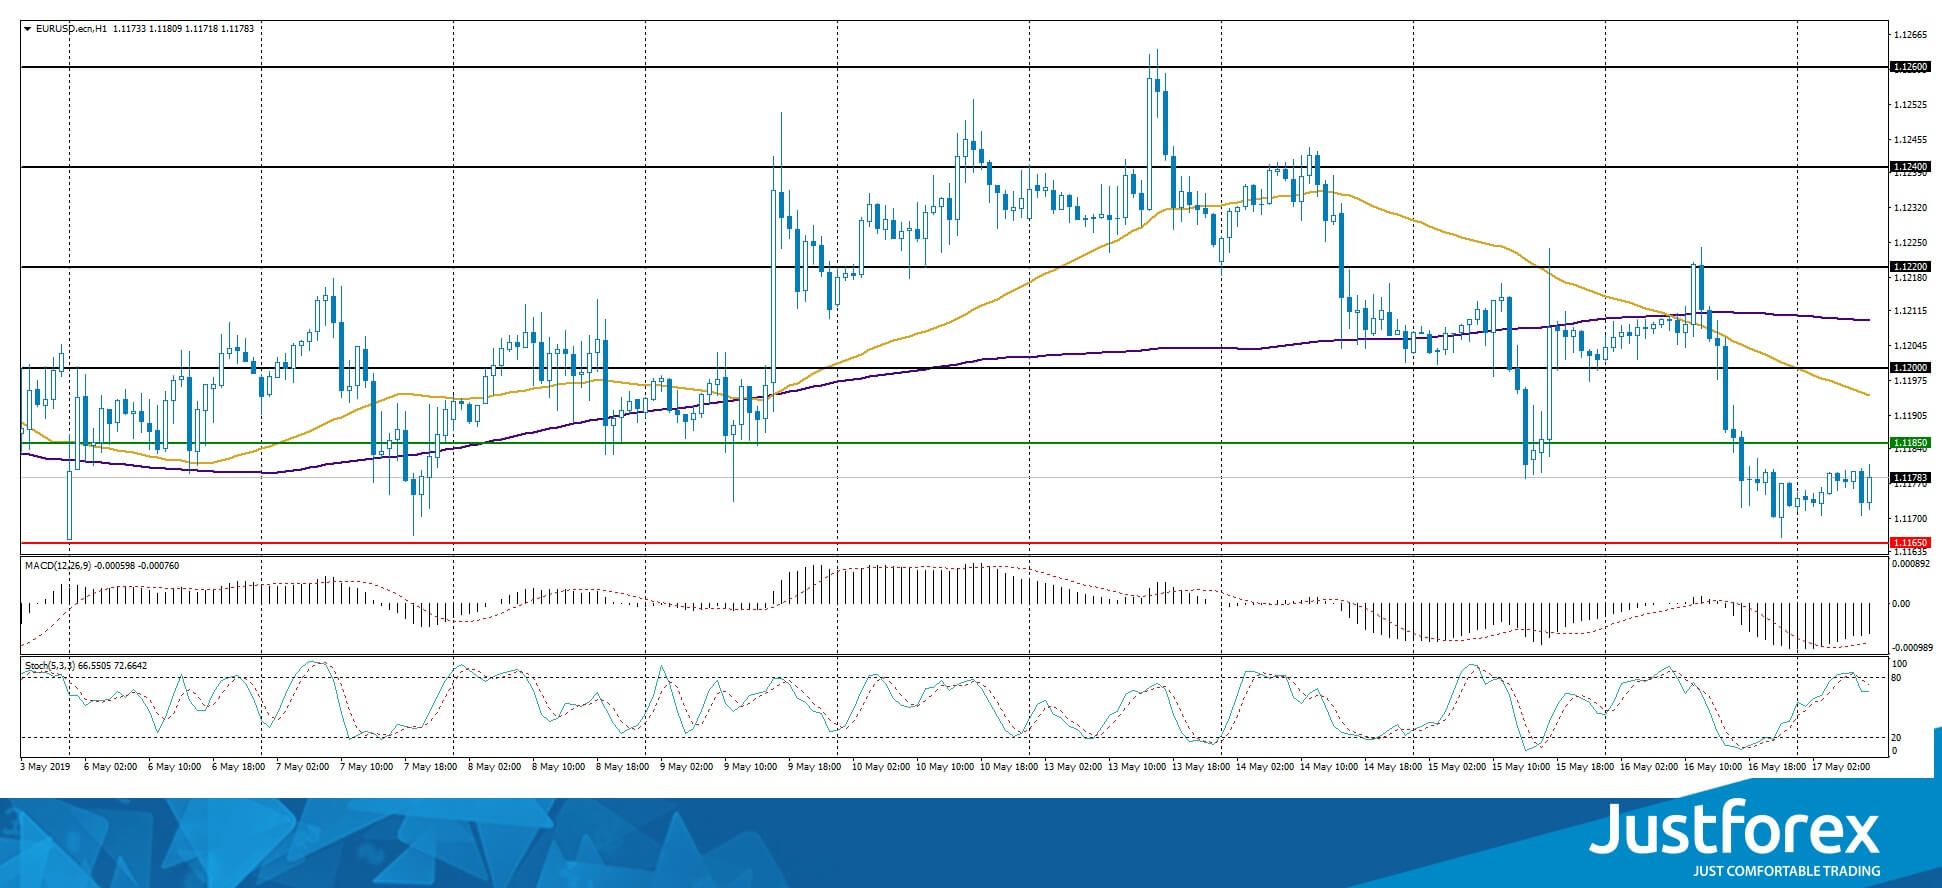
The price fixed below 50 MA and 200 MA which points to the power of the sellers.
The MACD histogram is in the negative zone but above the signal line which points toward selling GBP/USD.
The Stochastic Oscillator is in the neutral zone, the %K line is below the %D line which points towards a bearish mood.
Trading recommendations
Support levels: 1.11650, 1.11500, 1.11200
Resistance levels: 1.11850, 1.12000, 1.12200
If the price fixes below 1.11650, expect further descend toward 1.11500-1.11200.
Alternatively, the quotes can recover toward 1.12000-1.12200.
The GBP/USD currency pair
Technical indicators of the currency pair:
Prev Open: 1.28413
Open: 1.27919
% chg. over the last day: -0.42
Day's range: 1.27760 – 1.27978
52 wk range: 1.2438 – 1.3631
GBP/USD keeps showing a stable trend. Yesterday GBP updated the local minimums once more. Since the beginning of the month, it lost around 2% of its value. The investors are worried about Brexit, especially since Theresa May is rumoured to leave the office in the summer. Keep an eye on this issue and open positions from the key levels of 1.27700-1.28250. The quotes have prospects for further descend.
The Economic News Feed for 17.05.2019 is calm.
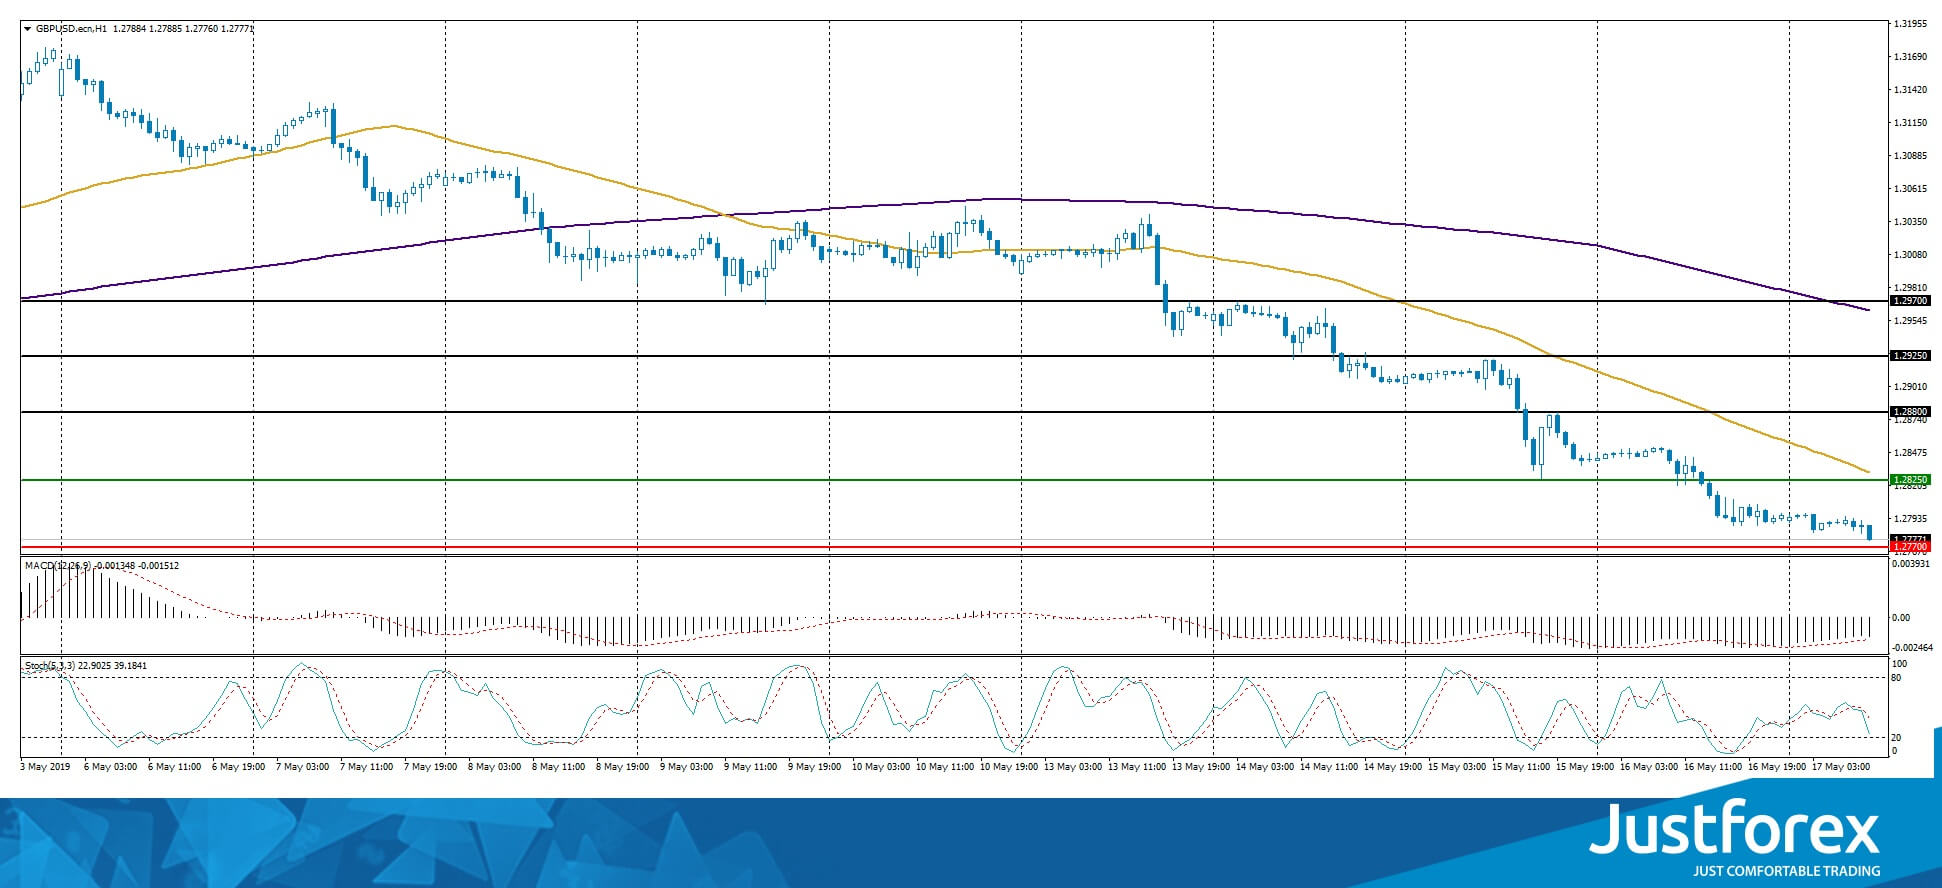
The price fixed below 50 MA and 200 MA which points towards the power of the buyers.
The MACD histogram is in the negative but above the signal line which gives a weak signal to sell GBP/USD.
The Stochastic Oscillator is in the neutral zone, the %K line is below the %D line which points towards the bearish mood.
Trading recommendations
Support levels: 1.27700, 1.27300, 1.27000
Resistance levels: 1.28250, 1.28800, 1.29250
If the price fixes below 1.27700, expect further descend toward 1.27300-1.27000.
Alternatively, the quotes can recover toward 1.28600-1.29000.
The USD/CAD currency pair
Technical indicators of the currency pair:
Prev Open: 1.34369
Open: 1.34598
% chg. over the last day: +0.19
Day's range: 1.34568 – 1.34814
52 wk range: 1.2727 – 1.3664
The last couple of sessions on the currency pair have been very active. At the same time, there is no defined trend. Right now the local support and resistance levels are 1.34550 and 1.34800. The demand for USD is back. Keep an eye on the oil quotes and open positions from the key levels.
The Economic News Feed for 17.05.2019 is calm.
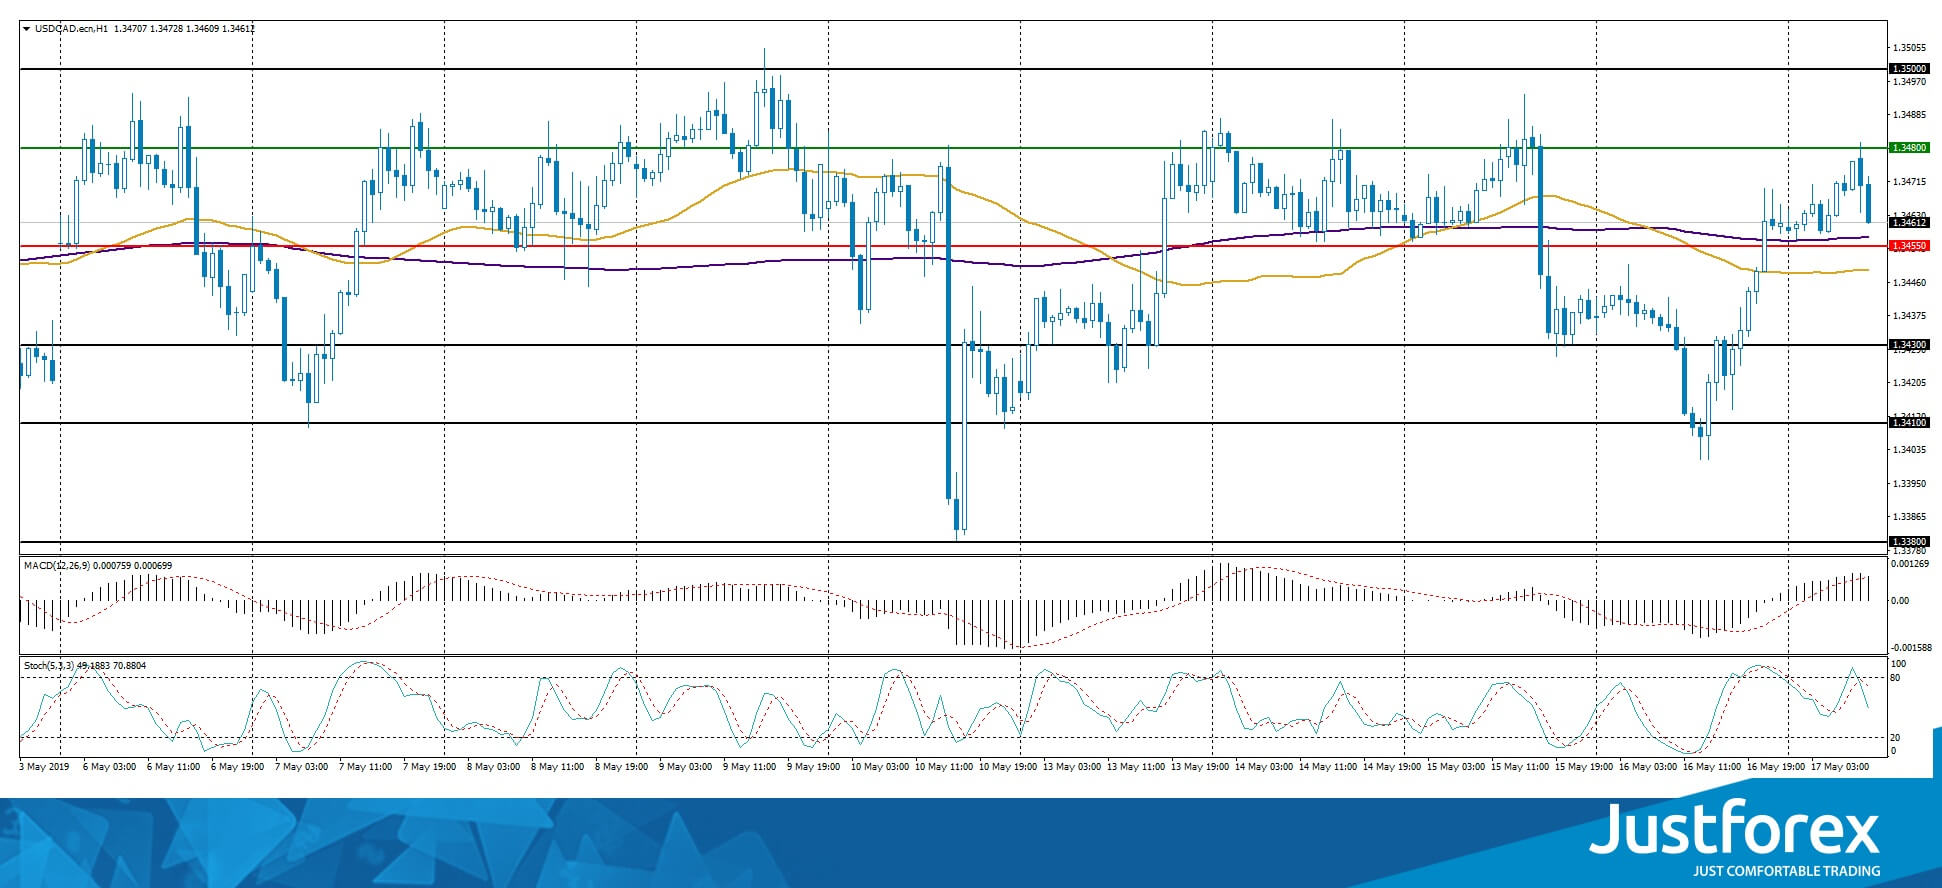
The indicators do not provide precise signals, 50 MA has crossed 200 MA.
The MACD histogram is in the positive zone and above the signal line which gives a strong signal to buy USD/CAD.
The Stochastic Oscillator is in the neutral zone, the %K line is below the %D line which gives a strong signal to buy USD/CAD.
Trading recommendations
Support levels: 1.34550, 1.34300, 1.34100
Resistance levels: 1.34800, 1.35000
If the price fixes above 1.34800, expect further growth toward 1.35000-1.35200.
Alternatively, the quotes can descend toward 1.34300-1.34100.
The USD/JPY currency pair
Technical indicators of the currency pair:
Prev Open: 109.584
Open: 109.834
% chg. over the last day: +0.27
Day's range: 109.542 – 110.033
52 wk range: 104.97 – 114.56
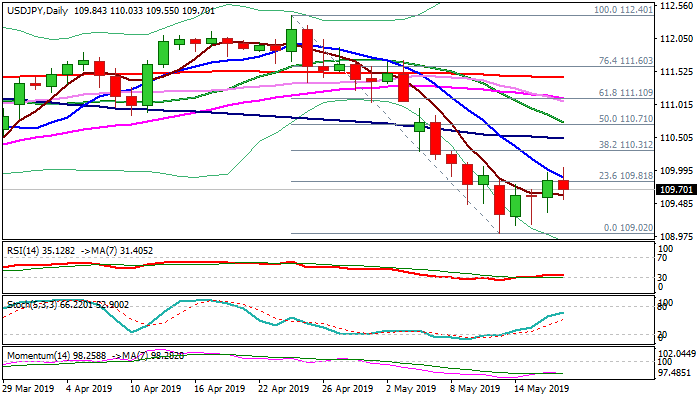
USD/JPY remains ambiguous. The trading instrument is moving sideways. Right now the quotes are consolidating around 109.800-110.000 with 109.500 acting as a local support. The quotes can recover further. Keep an eye on the US Treasury bonds, you should open positions from the key levels.
During the Asian trading sessions, Japan published weak reports on the business activity.
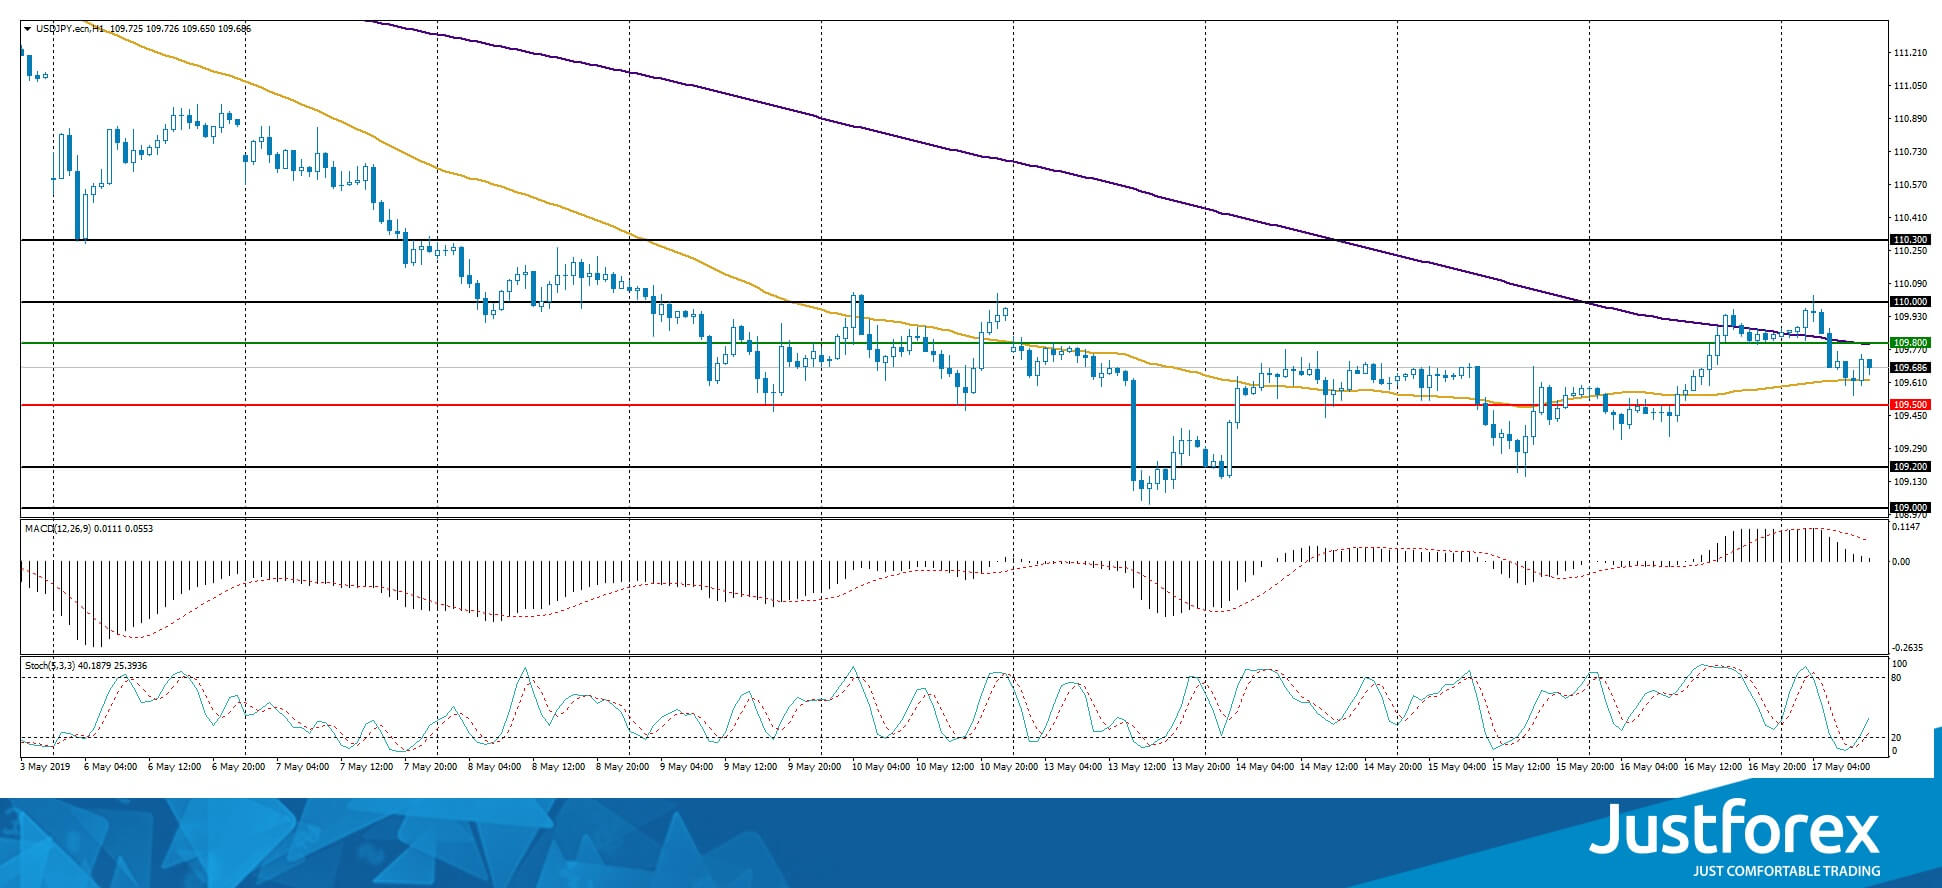
The indicators do not provide signals, the price has crossed 50 MA and 200 MA.
The MACD histogram is close to 0.
The Stochastic Oscillator started to leave the oversold zone, the %K line is above the %D line which points to the bullish mood.
Trading recommendations
Support levels: 109.500, 109.200, 109.000
Resistance levels: 109.800, 110.000, 110.300
If the price fixes above 109.800, expect further correction toward 110.200-110.400.
Alternatively, the quotes can fall toward 109.200-109.000.
WTI Crude Futures Hover Above ‘Golden Cross’, Find Support At 23.6% Fibo
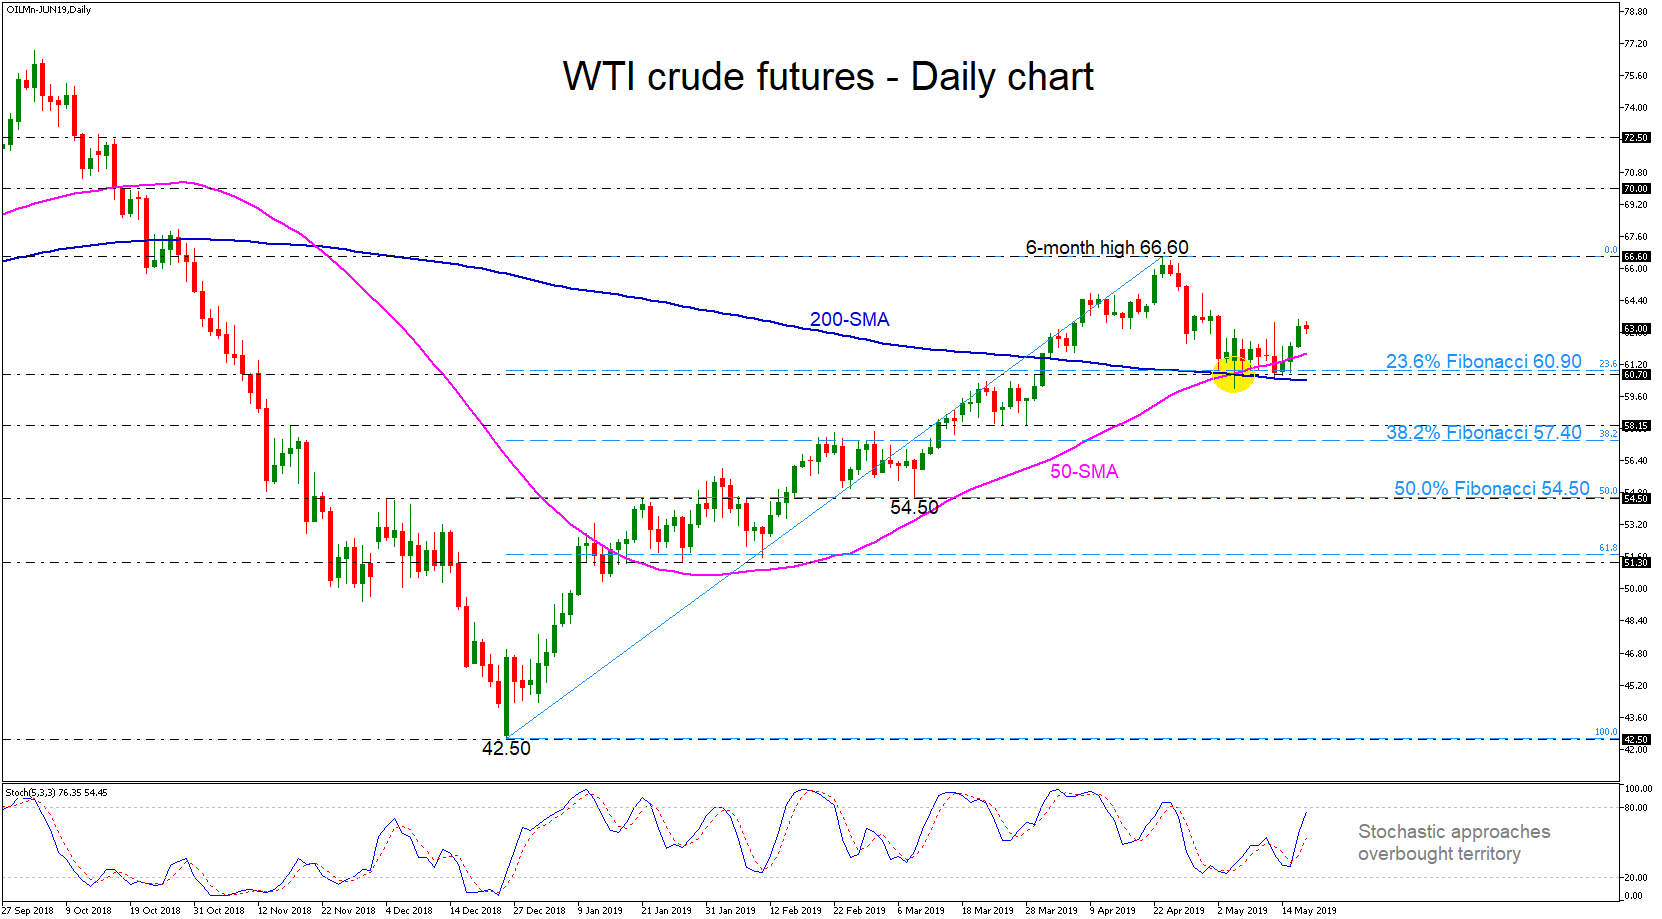
WTI crude oil futures found strong support at the 23.6% Fibonacci retracement level from the one-and-a-half-year low of 42.50 to the recent peak of 66.60 over the last two weeks, remaining also above of the 'golden cross' within the 50- and 200-day simple moving averages (SMAs). The stochastic oscillator is approaching the overbought levels, giving signals for more upside pressure.
Should the price edge higher, positive momentum could probably last until the six-month high of 66.60. Beating this top, the way could open towards the 70.00 handle, identified by the peak on October 2018, while more gains could lead oil until the 72.50 resistance.
On the downside, the 23.6% Fibonacci mark of 60.90 could act as significant support once again. A failure to hold above this level and therefore above the 50- and the 200-day SMAs could strengthen the sell-off towards the 58.15 barrier and the 38.2% Fibonacci of 57.40. A decline under the 50% Fibonacci of 54.50 may have a bigger negative impact on the sentiment.
In brief, WTI oil futures are looking more positive in the medium-term thanks to the 'golden cross' formation and the positive bias of the stochastic.
Trump Triggers Trade War Fears, NZD In Demand
Surprise..Trump triggers trade-war fears
Worries over U.S economic sanctions on Huawei and spillover effect on trade negotiations. China has communicated to retaliate against Thursdays Trump moves forward with an executive order to ban Huawei equipment from U.S networks. Breakdown in US-China communication hurt Chinese indices. Shanghai Composite index dropped 2.7% while Nikkei 225 climbed 0.9%. In theory, markets should be numb to this type of aggressive Trump tactics. However, evidence of a global slowdown has increase raising the stakes on a stable US-China trade relationship. While the supportive bias of central banks is the only thing truly keeping equity markets afloat fears of dramatically slower growth is a real mounting. Add to the mix geopolitical uncertainty of Trump hawkish rhetoric toward Iran and sending warships to the Middle East based on flimsy intel, just stinks of 2003. As Stephen Colbert stated, “worst throwback Thursday ever.” Global nervousness has built clear trends on sending EM and growth-sensitive FX lower and driving up historical safe haven currencies. Yet G10 1-month atm vol remains subdued below the 55d MA. EURUSD remains confined to a yawn-inspiring 1.11-1.1250 range. We don’t see the current news follow as a single of a structural shift, but the risk are mounting and the upside in equity looks further constricted.
NZD in demand despite rising geopolitical tensions
Despite rising frictions with Iran or an escalation of trade dispute with China, it seems that the kiwi is trading the opposite way. Although a risk-off sentiment dominates the marketplace, with safe-haven in demand, the New Zealand dollar remains in gain territory. Yet the trend is about to reverse, as fundamentals should come back to play. The recent release of April manufacturing PMI at 53 (prior: 51.9), albeit ticking higher, missed forecasts of 54.5 while last week decision from the Reserve Bank of New Zealand to cut the Official Cash Rate at an historical low of 1.50%, even if foreseen, did not push the currency much downward. Furthermore, the decline in 1Q producer prices, similarly to headline CPI, confirms a global weakness of inflation, leaving the RBNZ with no other options but to ease monetary policy and potentially cut its key rate a second time this year if necessary.
NZD/USD currently trades at October 2018 range (-0.95% since RBNZ rate cut announcement). The pair is expected to decline further. Major support at 0.6517 (31/10/2018 low) remains.
GBP/USD Outlook: Bears Pressure Key Fibo Support At 1.2773
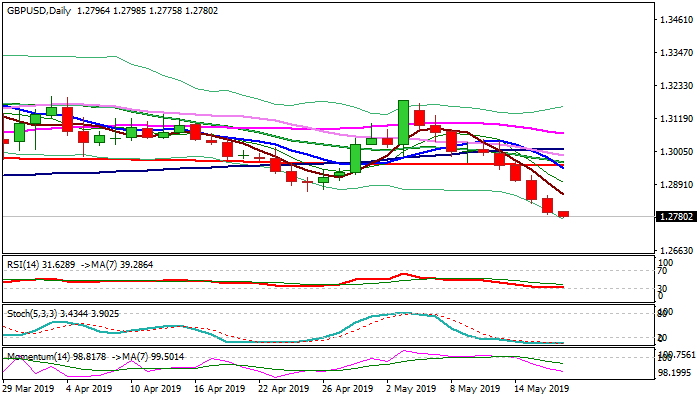
Cable holds firmly in red and extends weakness close to key support at 1.2773 (Fibo 61.8% of 1.2397/1.3381) on Friday.
The pair is on track for the second consecutive weekly close in red and the biggest one-week fall in two months that adds to negative picture.
Pessimism over Brexit as PM May will try again to pass her deal through the parliament after triple rejection and will likely step down after the parliamentary vote, further sours already weak sentiment. Firm bearish setup of daily/weekly studies supports scenario, but deeply oversold daily stochastic warns that bears may take a breather before resuming. Completion of weekly Head and Shoulders pattern was bearish signal and bears look for next negative signal on close below 1.2773 Fibo support (also higher low of 10 Feb) that would open way towards targets at 1.2668 (15 Jan low) and 1.2629 (Fibo 76.4%).
Thick falling weekly cloud and formation of 10/200SMA golden cross, maintain pressure.
Falling 5SMA (1.2854) and former low (1.2865) mark initial resistances which should ideally limit upticks.
Res: 1.2798, 1.2854, 1.2865, 1.2900
Sup: 1.2773, 1.2745, 1.2700, 1.2668
Offshore Yuan Hits New 2019 Low As Speculation Circulates That Trade Discussions Will Pause
Just as markets thought there was a lull in news related to US-China trade tensions, reportscirculating around China's lack of interest to resume trade discussions with the United States has alarmed investors once again. The Japanese Yen initially took a sharp, risk-off turn on this news with the USDJPY pulling below the 110 level once again, but it is very much all eyes on the offshore China Yuan after it hit its lowest level for 2019 with the USDCNH touching levels above 6.94 at time of writing.
Markets remain uncertain at this point in time as to whether the seemingly confrontational rhetoric following the escalation in the US-China trade dispute over the past two weeks actually spells the death of any trade deal. Perhaps the weekend couldn’t have come at a better time, allowing time for investors to digest the latest commentary and ascertain whether both sides are playing hardballas an intended signal, a show of brinkmanship, or just plain noise before the scheduled G20 meeting in Japan next month.
Asian stocks are now trading mixed, while US and European stock futures are expectedto open lower, indicating that fears surrounding US-China trade tensions are still alive and kicking.
GBPUSD hits 3-month low as PM uncertainty weighs on Pound
The selloff in the Pound has intensified, with GBPUSD now breaking below the 1.28 support level for the first time since February, while the Pound endures its longest run of losses against the Euro since 2000. An added layer of uncertainty now hangs over the Brexit outlook, as UK Prime Minister Theresa May has agreed to begin the countdown to the end of her tenure, starting next month. May will first have to focus on a last-ditch attempt to get her Brexit deal approved in Parliament during the week of June 3, before working on a timetable to find her successor.
The Pound is reacting negatively to such political uncertainty, as markets try and ascertain what a new UK Prime Minister might mean for the Brexit path ahead. The downside for the Pound may be exacerbated, should the vacancy for the top job be filled by a hardline Brexiteer, which then risks the return of a no-deal Brexit.
Could Oil return to its 2019 high?
Oil’s rebound is gathering pace, as Brent futures are opening a path back towards the psychological $73/bbl level. Geopolitical tensions in the Middle East are threatening to escalate, pulling traders away from fundamentals to instead focus on fear as they drove up Oil prices this week. Should market jitters increase over potential supply disruptions, that could send Oil to a new year-to-date high, as demand-side uncertainties fade away in the interim.
The Dollar Index Has Updated Monthly Highs. Potential For Growth Is Still High
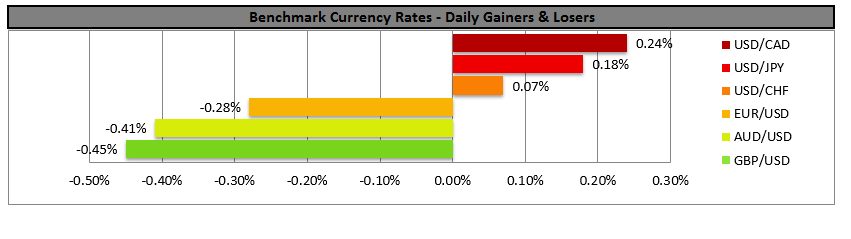
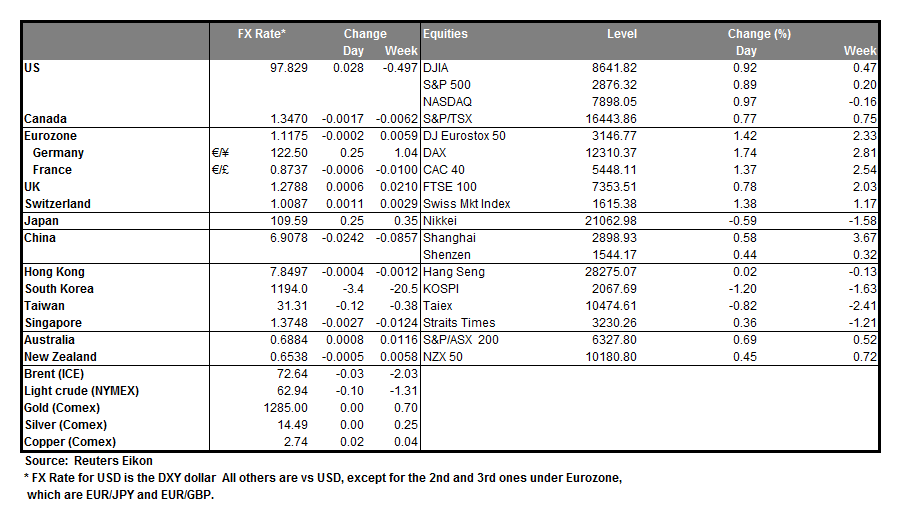
Yesterday, the greenback strengthened against the basket of world currencies. The dollar index (#DX) set new monthly highs and closed the trading session in the green zone (+0.31%). Demand for the US dollar increased after the publication of optimistic economic reports. In April, the number of building permits and the volume of housing starts increased by 0.6% and 5.7%, respectively. Over the past week, the number of initial jobless claims fell to 212K compared to market expectations of 220K. In May, Philadelphia Fed manufacturing index accelerated from 8.5 to 16.6. The growth in the US government bonds yield supports the US currency.
The British pound is still under pressure. Since the beginning of this month, the pound has weakened against the US dollar by more than 1.9%. Financial market participants are concerned that Prime Minister Theresa May will not be able to approve her Brexit deal again and may soon face a leadership problem. Today, investors will assess statistics on inflation in the Eurozone. We also recommend following up-to-date information regarding trade negotiations between Washington and Beijing.
Oil quotes are consolidating after a sharp growth the day before. At the moment, futures for the WTI crude oil are testing the mark of $63.00 per barrel. We recommend paying attention to the US Baker Hughes oil rig count at 20:00 (GMT+3:00).
Market Indicators
- Yesterday, the major US stock indices closed in the positive zone: #SPY (+0.93%), #DIA (+0.87%), #QQQ (+1.00%).
- The 10-year US government bonds yield is recovering. Currently, the indicator is at the level of 2.39-2.40%.
The news feed on 2019.05.17:
- Consumer price index in the Eurozone at 12:00 (GMT+3:00);
- Michigan consumer sentiment and expectations at 17:00 (GMT+3:00).
Pound Slumps As May Expected To Step Down, Dollar Lifted By Strong Data And Earnings
- Pound continues to slide as cross-party Brexit talks set to end and countdown begins to PM May's exit
- Euro also on the backfoot as Italian political worries re-emerge
- US dollar climbs to 2-week high following strong corporate earnings and solid US data
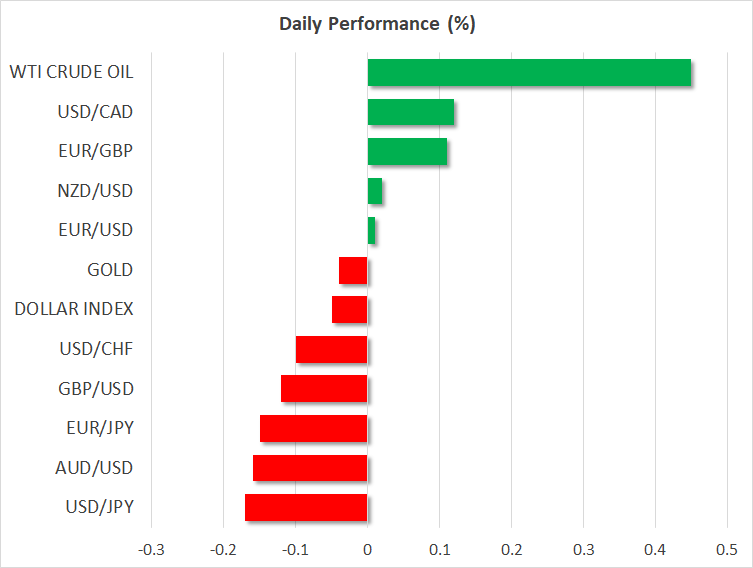
Pound extends losing streak as Brexit risks rise
Sterling is on track to post its sixth straight day of losses and to end the week 1.6% lower as Prime Minister Theresa May's days look numbered. It was confirmed yesterday that May will set her departure date after her Brexit deal is put to a fourth and final vote in the first week of June. May has promised to quit regardless of whether MPs approve or reject her deal, meaning a summer leadership contest is almost certain.
But while this ends speculation about May's premiership, it opens the possibility of a hardliner taking over and delivering a ‘hard' Brexit. Former foreign minister Boris Johnson – a Brexiteer – has already said he will run for the Tory leadership. Making matters worse for investors, May's planned departure renders the cross-party talks redundant as Labour would see no point in reaching an agreement with a leader who is about to be replaced.
The latest reports suggest an announcement that the talks have ended without agreement is imminent. However, it's possible the two sides may agree on a process to hold indicative votes in Parliament, which could yet lead to MPs voting in favour of holding a second referendum.
This prospect was of little comfort to the pound, however, as the British currency tumbled to 3-month lows against both the dollar and the euro, dropping below $1.27. With little prospect of May's deal being passed, sterling is unlikely to find much upside until the Conservatives have elected a new leader.
Italy woes return to haunt the euro
The euro is also set the end the week down against the dollar as heightened trade tensions and fresh concerns about Italy have pulled the single currency to a 10-day low near $1.1175. Italy's deputy prime minister, Matteo Salvini, is raising eyebrows in Brussels once again as he attacks the EU's fiscal rules.
While Salvini's comments are likely motivated by campaigning for the European Parliament elections, due to be held between 23-26 May, it nevertheless raises the prospect of further clashes between Brussels and Rome later this year, especially as lacklustre growth means Italy will struggle to meet its budget deficit target for 2019.
Dollar looking buoyant again
There was little sign of tensions between the US and China easing anytime soon following President Trump's decision to impose punitive sanctions on Chinese telecom giant, Huawei. Trump's latest move in the year-long trade dispute has clearly angered the Chinese with officials accusing the US of not being sincere. But more significantly, the indications are that China does not see any point of holding fresh trade talks given the current US stance.
This throws the trade negotiations into a new phase of uncertainty and stocks in China ended around 2.5% lower on Friday as hopes faded of a quick resolution. However, some investors decided to put aside the trade concerns for now and stocks in Japan and Australia were bolstered by Wall Street's upbeat tone. US stocks closed sharply higher overnight, lifted by strong corporate earnings and surprisingly strong housing and manufacturing data out of the US. The focus later today will fall on the University of Michigan's consumer sentiment index.
The positive sentiment wasn't confined to just equities as government bond prices came under pressure, driving up yields. US Treasury yields jumped higher after Fed speakers signalled the Fed might let inflation run above target for a while if it were to rise. Subsequently, the dollar remained well supported on Friday, holding close to the 110 yen level.
Not as fortunate was the Australian dollar, which slid to fresh 4½-month lows. Rising expectations that the RBA could cut rates as early as its June meeting, as well as caution ahead of this weekend's federal elections in Australia weighed on the aussie.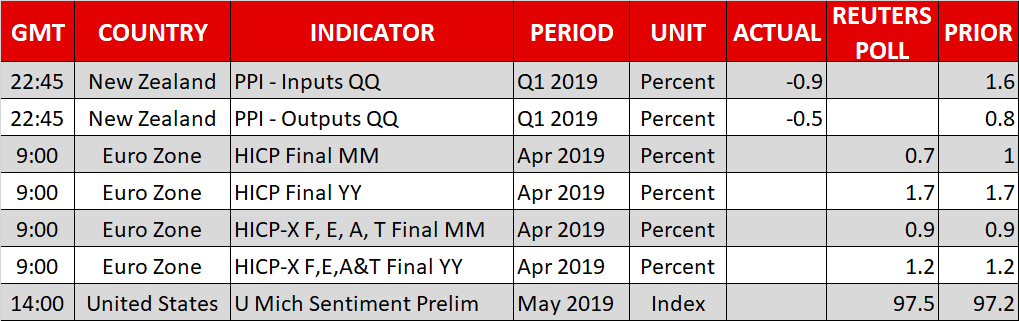
USD Strengthens On Strong Data And Rising Yields
The USD strengthened against its major counterparts yesterday, on the back of strong US financial releases and rising treasury yields. Almost every US release outperformed expectations and analysts seem to highlight rise of housing starts, the drop of unemployment claims and the rise of the Philly Fed business index. Following the robust data, the US treasury yields albeit at low levels, rose slightly, providing an extra push for the greenback. It should be noted that analysts mention the possibility the USD may also be getting stronger due to trade tension in the global market. We maintain the view that the weakness displayed by the Euro and the pound, continues to highlight the greenback's relative stability. The USD is expected to remain data driven for a while and should there be no major fundamental issues surprising the markets, we could see it being affected by today's releases. Please do not forget that in the sidelines of the Eurogroup meeting today, some comments about the Italy's intentions to break the EU budget rules, could slip out and create volatility for the EUR. Also bear in mind that the Trump administration is expected to make an official announcement on whether it will impose tariffs on European cars or not by tomorrow Saturday. EUR/USD maintained a wide sideways movement yesterday, testing the 1.1220 (R1), dropping and testing the 1.1175 (S1) support line and stabilising just above it. We could see the pair, maintaining the sideways movement mentioned, yet should the pair's long positions be favoured by the market, we could see the pair breaking the 1.1220 (R1) resistance line and aim for the 1.1260 (R2) resistance level. Should the pair come under the selling interest of the market, we could see it breaking the 1.1175 (S1) support line and aim if not break the 1.1125 (S2) support barrier.
GBP drops even lower on inner UK political instability
The pound weakened even further against the USD yesterday, as pressure keeps rising for Theresa May to leave office. As Theresa May fights to keep her Brexit deal in place, fears of a disorderly Brexit seem to be rising. MPs in the Tory party seem to be questioning her leadership as recent polls showed very low support for the conservatives among the voters. Hence pressure within the Tory party is rising for her to resign or else there is the possibility that a new confidence vote may take place. The market seems to be reacting negatively to the prospect of Theresa May leaving, as fears grow that such a scenario could enhance the probability of a disorderly Brexit. As long as the negative headlines continue to reel in, the pound could continue to weaken as at the current stage seems to be Brexit driven. Cable dropped even lower yesterday, aiming for the 1.2775 (S1) support line and stabilising just above it. We maintain a bearish outlook for the pair and for us to switch it in favor of a sideways motion, we would require the pair's price action to break the downward trendline incepted since Monday. Please be advised that the RSI indicator in the 4 hour chart is still below the reading of 30, implying a rather overcrowded short position. Should the bears maintain control over the pair's direction, we could see it breaking the 1.2775 (S1) support line and aim for the 1.2665 (S2) support level. If the bulls take over, we could see the pair breaking the 1.2875 (R1) resistance line and aim for higher grounds.
Other economic highlights, today and early tomorrow
During today's European session, we get from the Eurozone the final CPI rates for April. In the American session, we get from the US the preliminary University of Michigan Consumer sentiment indicator for May and the Baker Hughes active oil rig count figure. During Monday's Asian session, we get Japan's preliminary GDP growth rate for Q1. As for speakers NY Fed President John Williams and Fed's Richard Clarida speak.
EURUSD H4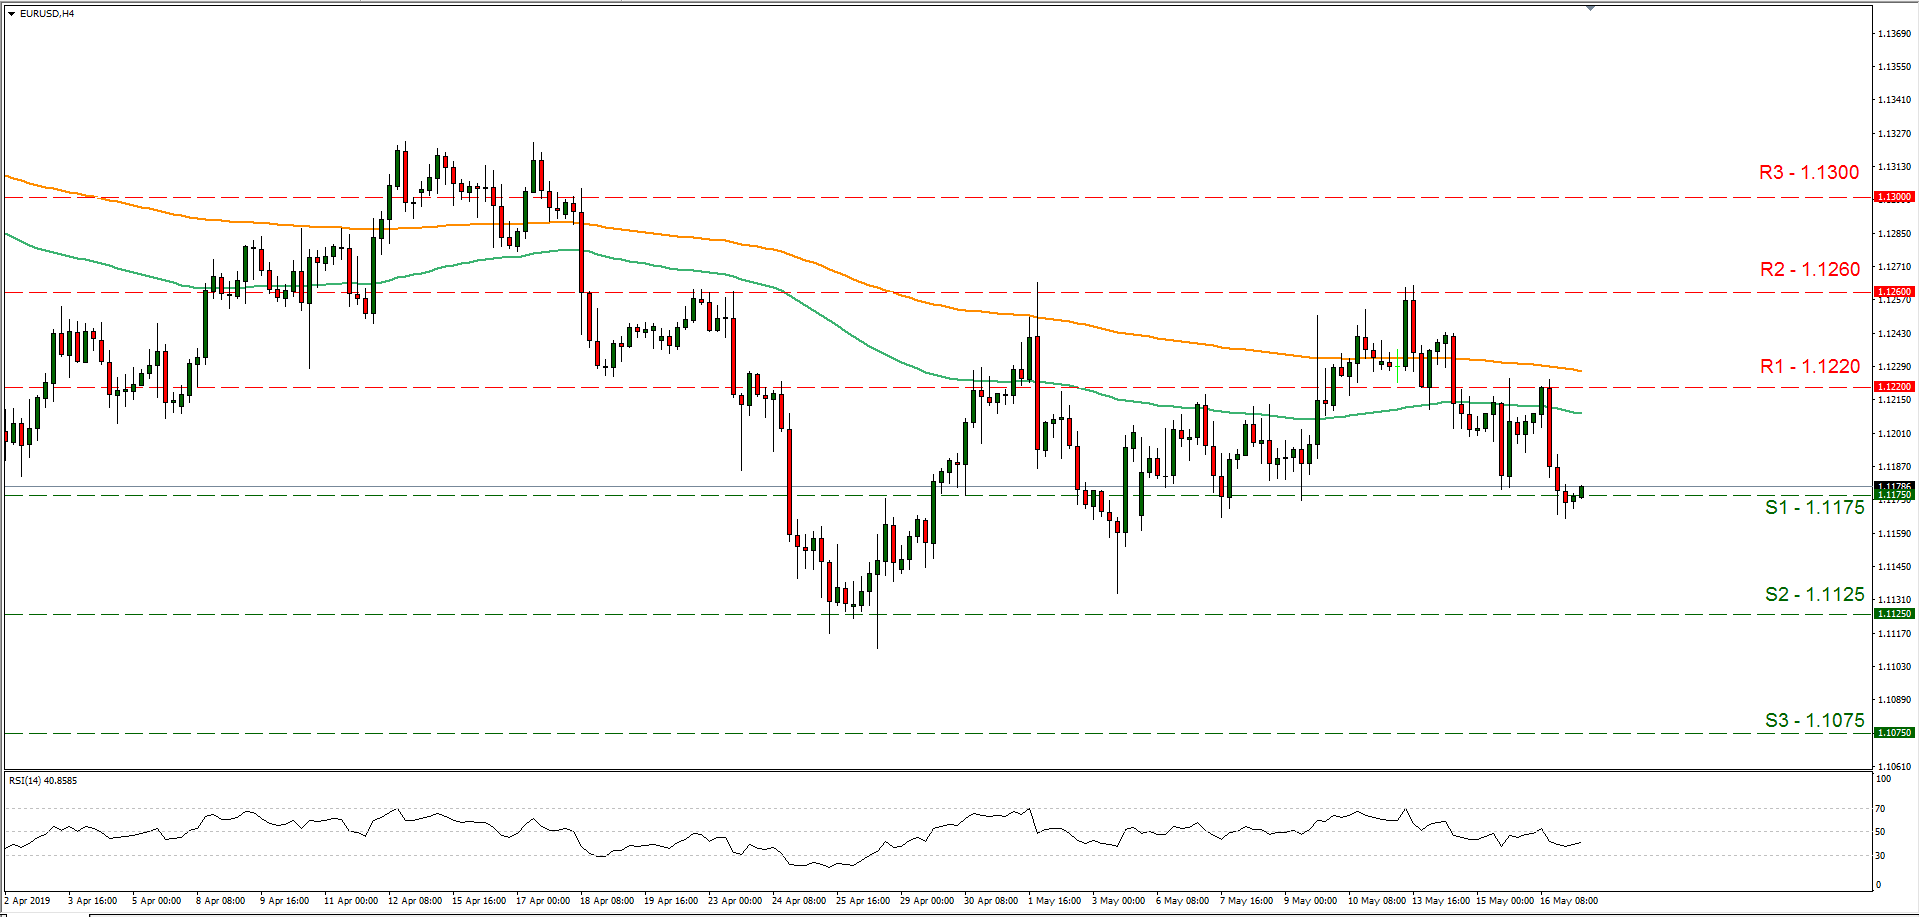
Support: 1.1175 (S1), 1.1125 (S2), 1.1075 (S3)
Resistance: 1.1220 (R1), 1.1260 (R2), 1.1300 (R3)
GBP/USD H4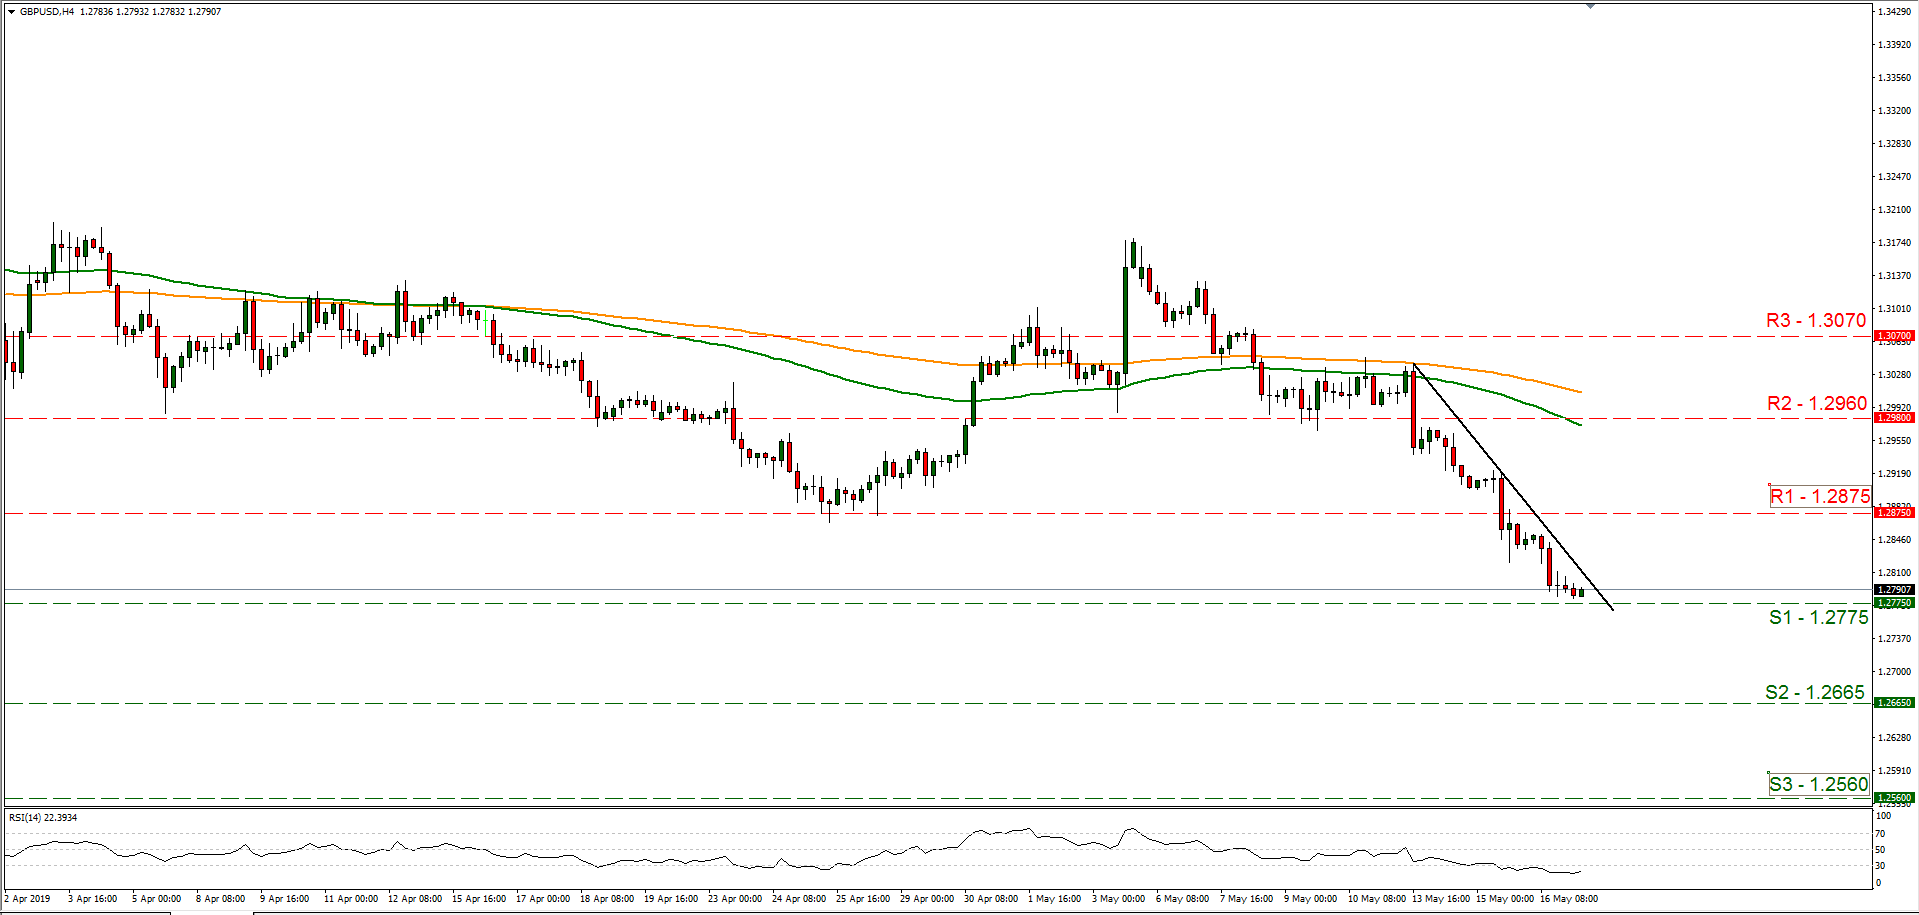
Support: 1.2775 (S1), 1.2665 (S2), 1.2560 (S3)
Resistance: 1.2875 (R1), 1.2960 (R2), 1.3070 (R3)
USD/JPY Outlook: Fresh Easing Warns That Recovery Phase Might Be Over
The pair fell back to 109.50 zone (approx. the mid-point of this week's range) on fresh safe-haven buying as markets fear an escalation of US/China trade tensions after China signaled a lack of interest in resuming trade talks with the US under current circumstances.
Recovery attempts from week's low at 109.02 (supported by formation of bear-trap pattern on daily chart) ran out of steam at 110.00 zone, where repeated upside rejections occurred.
The barrier is reinforced by falling daily Tenkan-sen and guards more significant 110.31 resistance (daily cloud base/Fibo 38.2% of 112.40/109.02).
Near-term risk is expected to shift lower while the price remains below 110, with fresh weakness threatening of renewed attempt below cracked 109.41 pivot (Fibo 38.2% of 104.57/112.40).
Weekly close below here is needed to generate bearish signal for extension of bear-leg from 112.40 (2019 high, posted on 24 Apr).
Bearish momentum is gaining pace, with bearish setup of daily Tenkan-sen/Kijun-sen, supporting scenario.
Only sustained break above 110.31 would neutralize downside risk and shift near-term focus higher.
Res: 109.87, 110.00, 110.31, 110.48
Sup: 109.55, 109.33, 109.02, 108.49