Sample Category Title
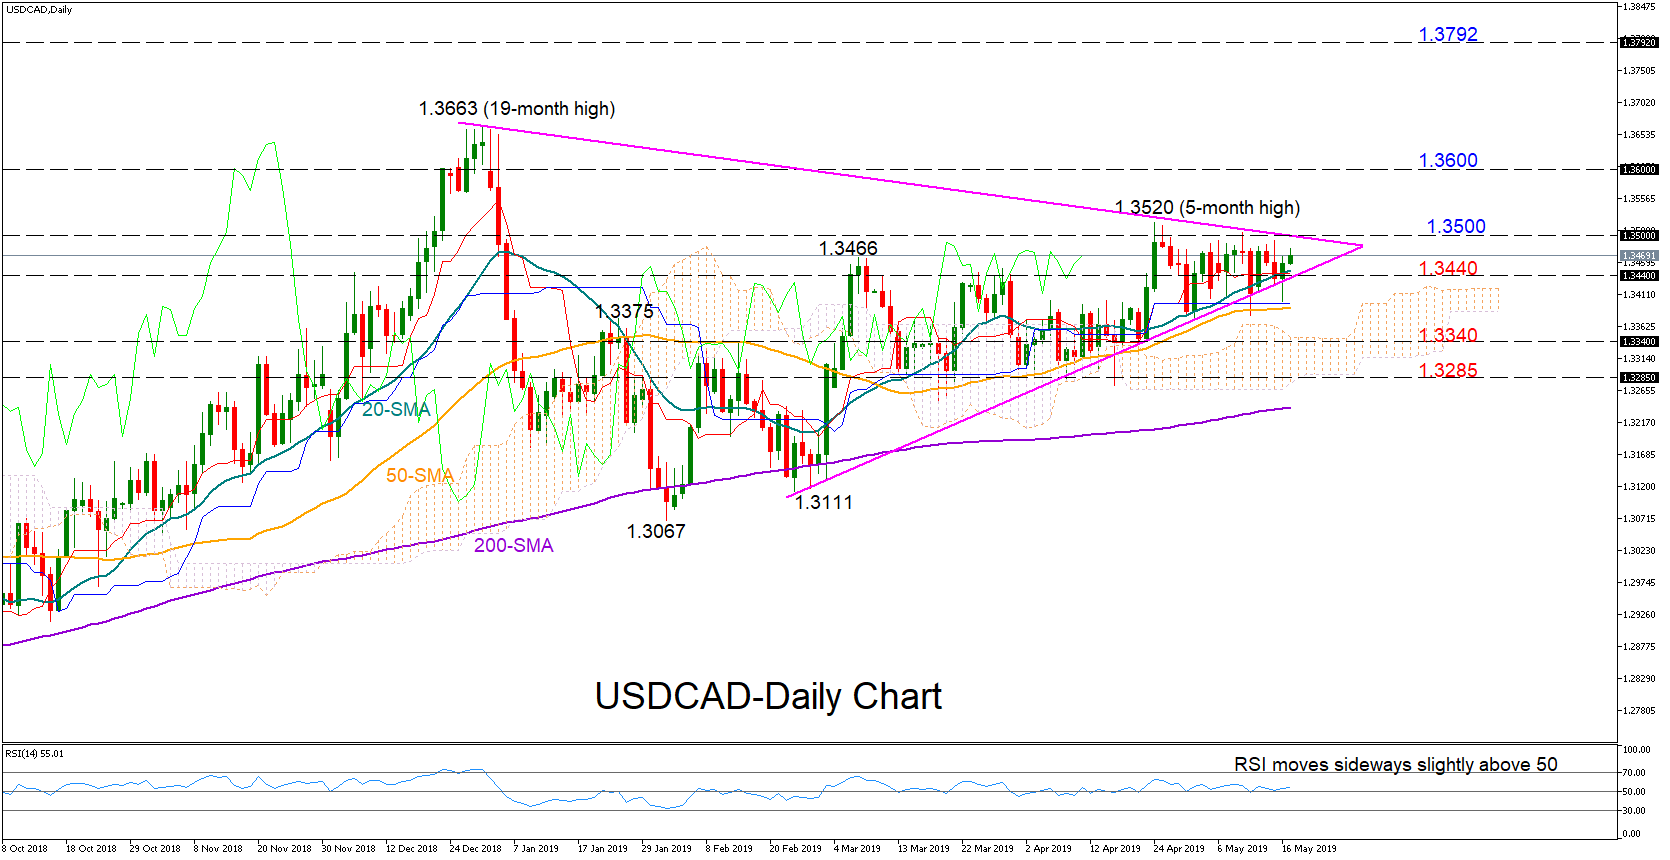
USDCAD Neutral In Short-Term, Within Symmetrical Triangle
USDCAD has been range-bound for another week within the 1.3520-1.3375 area, while candles keep closing above the lower line of the symmetrical triangle. The sideway move in the RSI and the flattening Ichimoku indicators (Tenkan-sen, Kijun-sen) signal that the pair may extend its neutral performance in the short term.
On the upside, the price would have to finish a session comfortably above the upper line of the symmetrical triangle (1.3500) for the bullish pressures to heat up. If that is the case, the next key resistance to watch could be somewhere between 1.36 and 1.3663, while higher, attention will shift straight to the 2017 peak of 1.3792.
Investors could start selling the pair more aggressively if the market closes below the triangle (1.3440) and more importantly under the 50-day simple moving average (SMA) currently at 1.3390. Falling lower, the bears would need to beat the 1.3340 mark to reach a stronger support at the bottom of the cloud (1.3285).
Meanwhile in the medium-term picture, USDCAD is trading bullish given the higher highs and the higher lows over the past three months.
In brief, USDCAD is expected to hold neutral in short term and bullish in medium term.
AUDJPY Continues Sell-Off, Recording 4-Month Lows
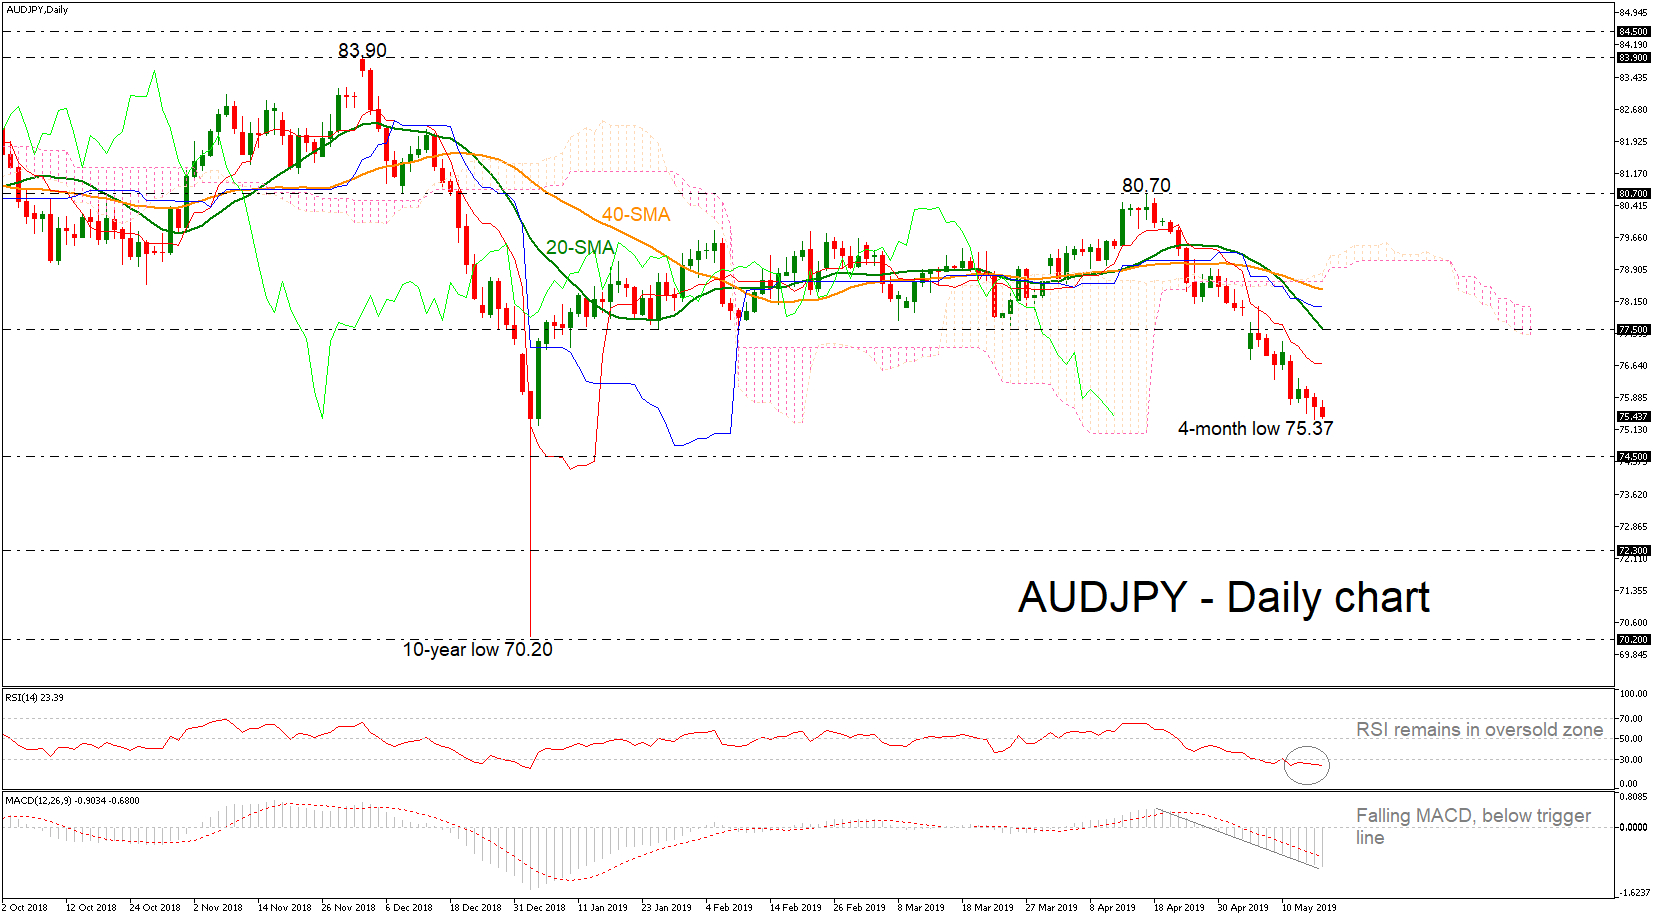
Selling interest is continuing in the AUDJPY market, pushing the price towards a new four-month low of 75.37. The price is also holding beneath the red Tenkan-sen and the blue Kijun-sen lines, while the MACD is strengthening its bearish momentum below zero. The RSI is bearish as well, though under its 30 oversold mark. Another signal for more sell-off is the negative crossover within the 20- and 40-simple moving averages (SMAs) in the daily timeframe.
Should negative pressure strengthen, support could come around the 74.50 barrier, identified by the lows on June 2016. The 72.30 level and the ten-year low of 70.20 registered on July 2017 could be the next key levels to watch, shifting the medium-term outlook even more bearish.
On the other hand, a rebound on the 74.50 hurdle could send the price until the red Tenkan-sen line, which currently stands near 76.70. Above this level, the 20-day SMA, which overlaps with the 77.50 barrier could be another target for investors to have in mind. Even higher, there are several resistance obstacles such as the Ichimoku cloud and the 40-SMA ahead of the 80.70 top.
In the short-term, the downfall from the 80.70 barrier opened the way for a new downside rally. A successful drop below 74.50 could add more fuel to the bears.
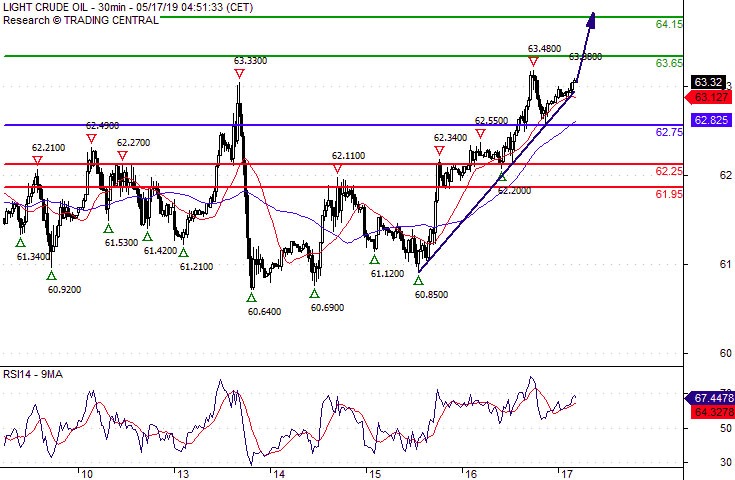
Crude Oil Supported By A Rising Trend Line
Pivot (invalidation): 62.75
Our preference Long positions above 62.75 with targets at 63.65 & 64.15 in extension.
Alternative scenario Below 62.75 look for further downside with 62.25 & 61.95 as targets.
Comment The RSI is bullish and calls for further advance.
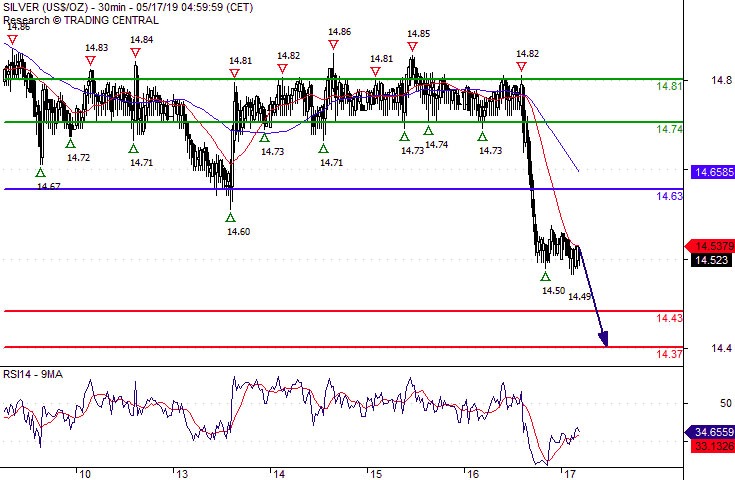
Silver Spot 14.3700 Expected
Pivot (invalidation): 14.6300
Our preference Short positions below 14.6300 with targets at 14.4300 & 14.3700 in extension.
Alternative scenario Above 14.6300 look for further upside with 14.7400 & 14.8100 as targets.
Comment The RSI is bearish and calls for further decline.
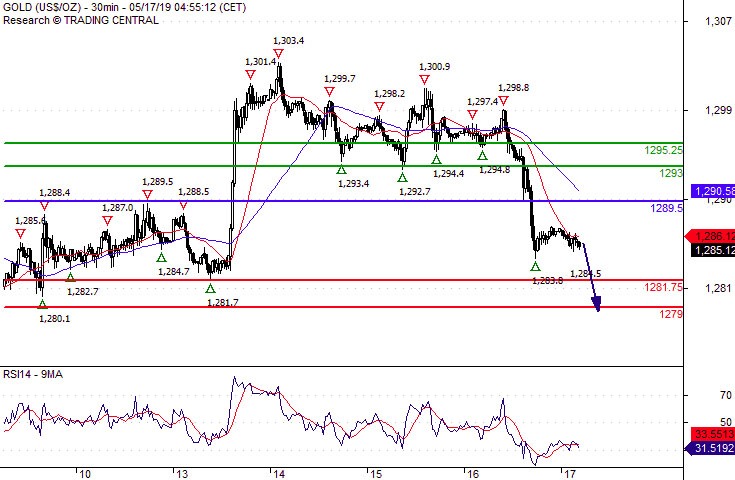
Gold Spot 1279.00 In Sight
Pivot (invalidation): 1289.50
Our preference Short positions below 1289.50 with targets at 1281.75 & 1279.00 in extension.
Alternative scenario Above 1289.50 look for further upside with 1293.00 & 1295.25 as targets.
Comment The RSI shows downside momentum.
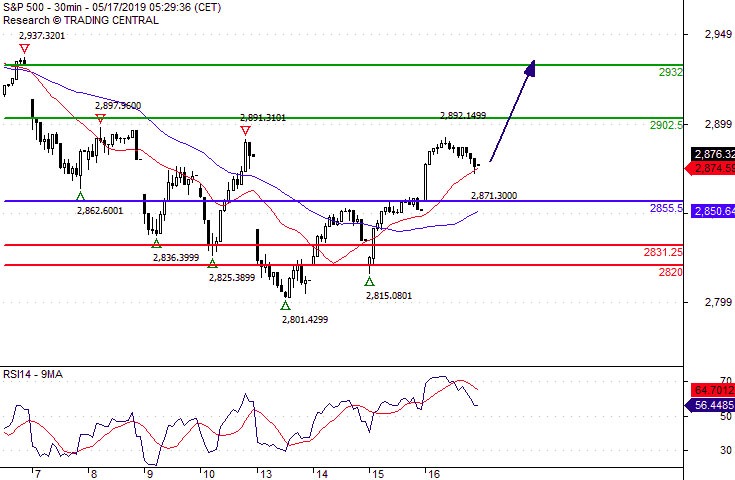
S&P 500 Further Advance
Pivot (invalidation): 2855.50
Our preference Long positions above 2855.50 with targets at 2902.50 & 2932.00 in extension.
Alternative scenario Below 2855.50 look for further downside with 2831.25 & 2820.00 as targets.
Comment The RSI is mixed to bullish.
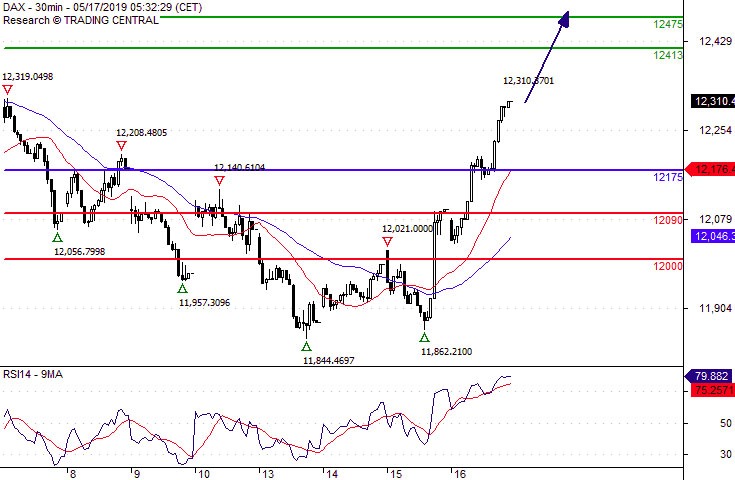
DAX Aim @ 12475.00
Pivot (invalidation): 12175.00
Our preference Long positions above 12175.00 with targets at 12413.00 & 12475.00 in extension.
Alternative scenario Below 12175.00 look for further downside with 12090.00 & 12000.00 as targets.
Comment The RSI is bullish and calls for further advance.
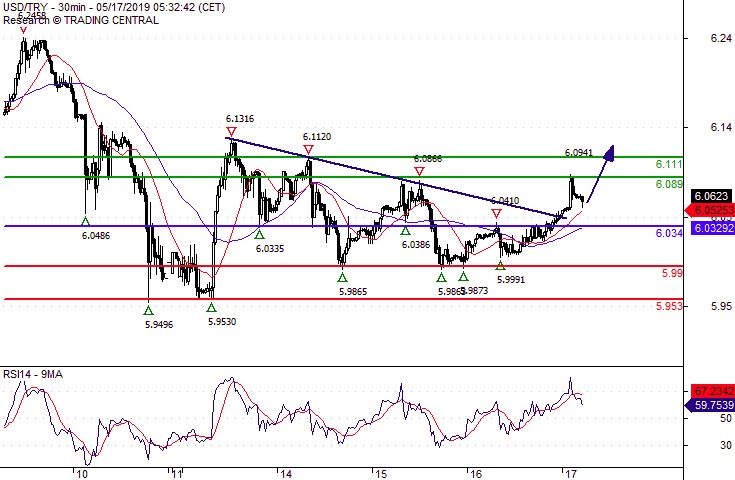
USD/TRY The Bias Remains Bullish
Pivot (invalidation): 6.0340
Our preference Long positions above 6.0340 with targets at 6.0890 & 6.1110 in extension.
Alternative scenario Below 6.0340 look for further downside with 5.9900 & 5.9530 as targets.
Comment Even though a continuation of the consolidation cannot be ruled out, its extent should be limited.
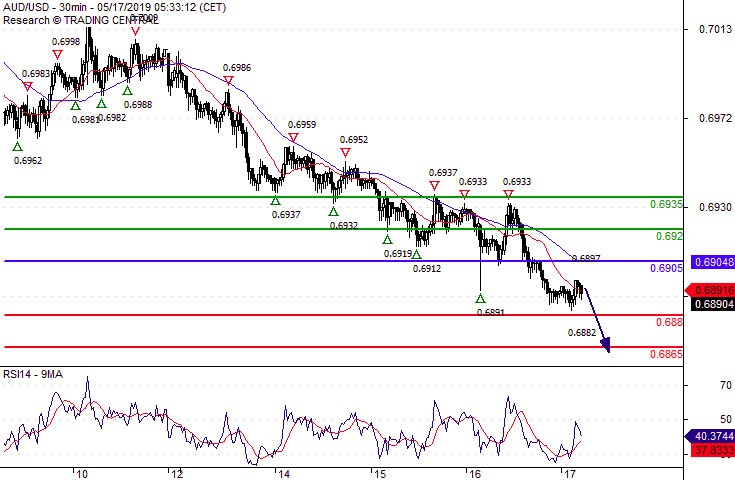
AUD/USD Watch 0.6865
Pivot (invalidation): 0.6905
Our preference Short positions below 0.6905 with targets at 0.6880 & 0.6865 in extension.
Alternative scenario Above 0.6905 look for further upside with 0.6920 & 0.6935 as targets.
Comment A break below 0.6880 would trigger a drop towards 0.6865.
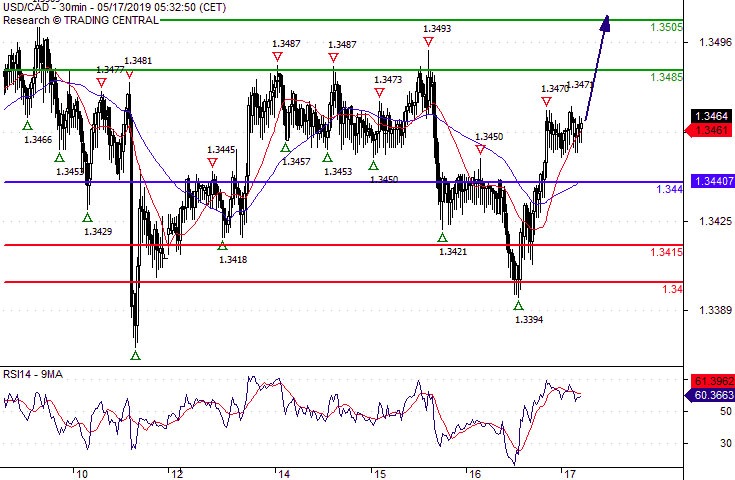
USD/CAD Expect 1.3505
Pivot (invalidation): 1.3440
Our preference Long positions above 1.3440 with targets at 1.3485 & 1.3505 in extension.
Alternative scenario Below 1.3440 look for further downside with 1.3415 & 1.3400 as targets.
Comment The RSI is bullish and calls for further upside.