

Sample Category Title
Elliott Wave View Calling For Pullback In USD/JPY
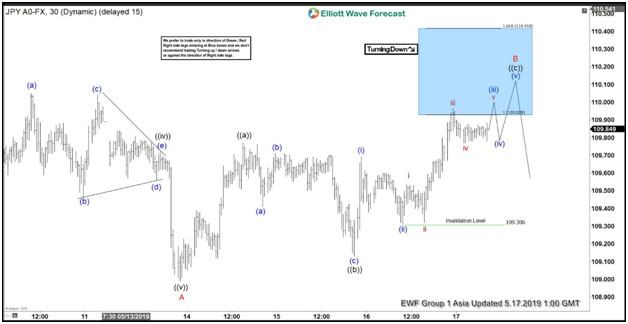
Short term Elliott Wave view in USDJPY calls the decline from April 25 peak (112.4) ended as wave ((A)) at 108.99. This suggests the decline from there is unfolding as a zigzag Elliott Wave structure. Wave B bounce is in progress to correct cycle from April 25 peak in 3, 7, or 11 swing. The internal of the bounce is unfolding as another zigzag. Up from 108.99, wave ((a)) ended at 109.77 and wave ((b)) ended at 109.13. Wave ((c)) of B is in progress as a 5 waves and expected to complete with 1 more push higher within the blue box of 109.93 – 110.4.
The pair has already reached 100% extension relative to wave ((A)), thus it has met the minimum target requirement. From the blue box area, we expect pair to either resume to new low in wave C or at least pullback in 3 waves. If the present rally continues to extend higher to 110.42 (1.618 extension), it increases the risk that the entire rally from May 13 low (108.99) is an impulse rather than zigzag. As far as pivot at April 25 peak (112.4) remains intact, rally should fail in the sequence of 3, 7, or 11 swing for further downside.
USDJPY 1 Hour Elliott Wave Chart
BusinessNZ Manufacturing PMI rose to 53.0, growth pickup still in questions
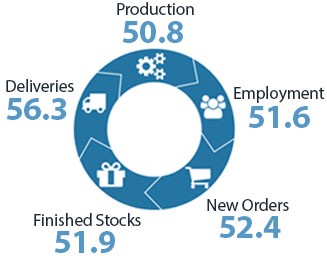
New Zealand BusinessNZ Manufacturing PMI rose to 53.0 in April, up from 52.0. Looking at the details, production dropped -0.1 to 50.8, employment dropped -0.4 to 51.6, new orders dropped -0.3 to 52.4, finished stocks dropped to 0.8 to 51.9. On the other hand, deliveries jumped sharply by 3.6 to 56.3.
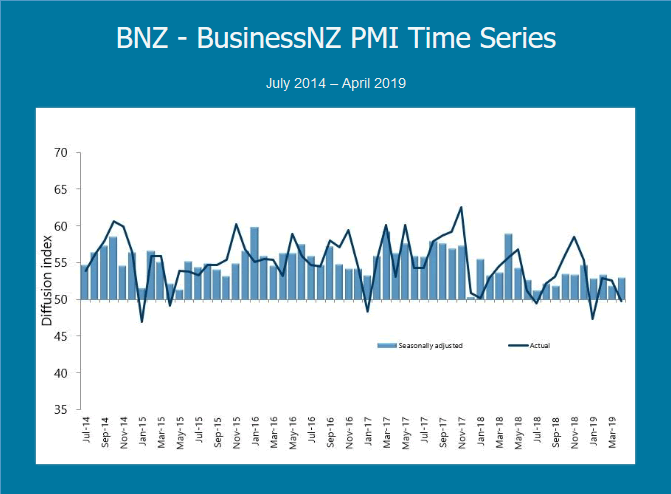
BusinessNZ's executive director for manufacturing Catherine Beard said that while the improvement in activity for April was welcome, the underlying trend still remains a concern. She noted "Although this indicates the sector is still in expansion mode, the unadjusted series has tended to trend down since late 2017. If this trend continues, it will eventually have negative consequences for the main published result".
BNZ Senior Economist, Doug Steel said that "the headline PMI looks reasonable but some of the details have cooled off including new orders. It raises questions for those looking for a strong growth pickup later in 2019".
Also from New Zealand, PPI input dropped -0.9% qoq in Q1. PPI output dropped -0.5% qoq.
Brainard: Fed might adopt opportunistic reflation strategy on monetary policy
Fed Lael Brainard said the central might adopt a so called "opportunistic reflation" strategy to lift underlying inflation to 2% and underscore its commitment to the inflation mandate. Such a strategy would accept a slight overshoot the 2% inflation target for a while, even if it's driven by import prices.
She said "suppose that an unexpected increase in core import price inflation drove overall inflation modestly above 2% for a couple of years... The Federal Reserve could use that opportunity to communicate that a mild overshooting of inflation is consistent with our goals and to align policy with that statement.''
On the current outlook, she noted "the emerging contours of today's new normal are defined by low sensitivity of inflation to changes in labor market slack, a low long-term neutral rate of interest, and low underlying trend inflation."
Fed Kashkari: We misread faulty labor market signals, but cutting rates won’t help inflation expectations
Minneapolis Fed President Neel Kashkari said in a speech in Santa Barbara that Fed could have misread faulty signals from the labor markets. And current situation suggests monetary policy was too tight in this recovery. Fed should be patient and allow inflation to overshoot target. Yet, he doesn't see cutting rates offer any help. Overall, he advocates a wait-and-see with patience approach.
Kashkari said Fed could have "misread" the labor market and feared that "if we hit maximum employment, inflation might suddenly accelerate". Thus, "we would then have to raise rates quickly to contain it". However, the "headline unemployment rate has been giving a faulty signal". Considering inflation "somewhat too low" and job market "still showing capacity", he added, "the only reasonable conclusion I can draw is that monetary policy has been too tight in this recovery".
On monetary, policy, Kashkari said "for our current framework to be effective and credible, we must walk the walk and actually allow inflation to climb modestly above 2 percent in order to demonstrate that we are serious about symmetry". However, he also told reporters that "I am not sure that cutting rates would do much to inflation expectations."
GOLD Price Could Decline Further While Crude Oil Is Rising
Gold price failed to break the $1,302 and $1,304 resistances, and recently declined below $1,292. Crude oil price is gaining momentum and it could trade above the $63.80 resistance.
Important Takeaways for Gold and Oil
- Gold price failed to stay above the $1,300 pivot level and declined heavily against the US Dollar.
- There is a crucial bullish trend line formed with support at $1,284 on the hourly chart of gold.
- Crude oil price climbed higher and broke the $62.40 and $63.00 resistance levels.
- There is a bullish trend line in place with support near $63.02 on the hourly chart of XTI/USD.
Gold Price Technical Analysis
Gold price started a decent recovery earlier this week from the $1,280 and $1,282 support levels against the US Dollar. The price surged above the $1,290 resistance level and climbed above the $1,300 level.
The price traded as high as $1,303 on FXOpen and later declined. It seems like the price struggled to stay above the $1,300 and $1,302 levels. As a result, there was a sharp decline below the $1,295 and $1,290 support levels.
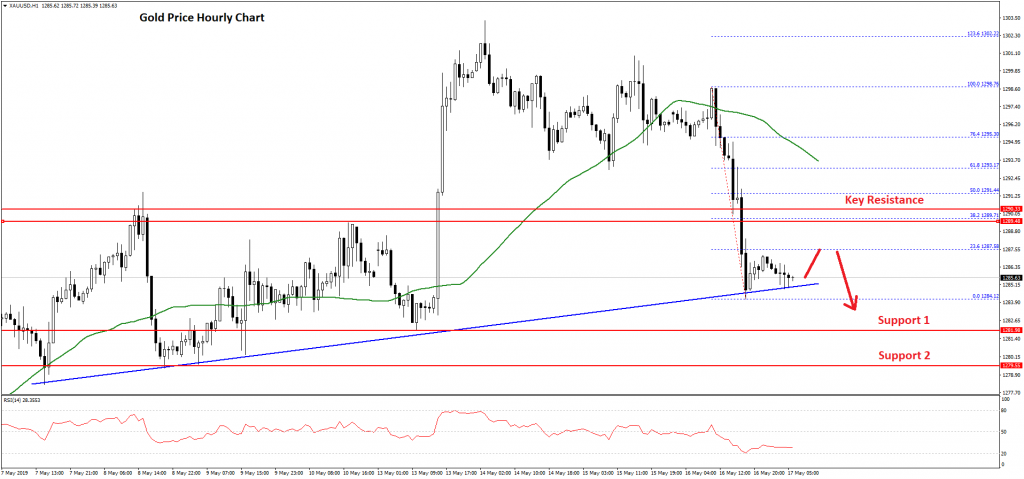
There was even a close below the $1,290 level and the 50 hourly simple moving average. A swing low was formed near the $1,284 level and the price is currently consolidating losses.
An initial resistance is near the $1,287 level and the 23.6% Fib retracement level of the latest decline from the $1,298 high to $1,284 low. On the upside, there is a strong resistance formed near the $1,289 and $1,290 levels.
Besides, the 50% Fib retracement level of the latest decline from the $1,298 high to $1,284 low is near the $1,291 level to act as a strong resistance.
The price may struggle to move higher towards $1,292 or $1,295 in the short term. Therefore, there is a risk of a downside break below the $1,284 and $1,282 support levels in the coming sessions.
Oil Price Technical Analysis
Crude oil price formed a strong support base near the $60.80 level and recently climbed higher against the US Dollar. The price gained bullish momentum and broke the $61.50 and $62.00 resistance levels.
The upward move was strong since there was a close above the $62.20 level and the 50 hourly simple moving average. It even broke the $63.00 resistance level and traded towards the $63.65 level.
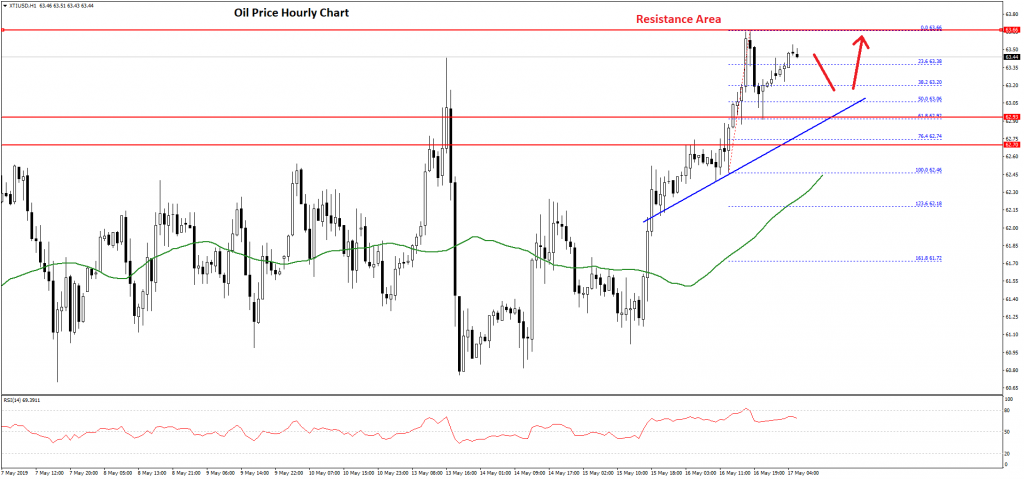
A swing high was formed at $63.66 and the price recently corrected lower below $63.20 and 50% Fib retracement level of the wave from the $62.46 low to $63.66 high.
However, the $63.00 and $62.95 levels acted as a support. Besides, the 61.8% Fib retracement level of the wave from the $62.46 low to $63.66 high provided a strong support.
More importantly, there is a bullish trend line in place with support near $63.02 on the hourly chart of XTI/USD. As long as the price is trading above the $63.00 support level, it is likely to trade higher in the near term. Below $63.00, the price could retest the $62.40 support.
On the upside, an immediate resistance is near the $63.50 level, above which oil price is likely to break the $63.66 swing high. The next important resistance is near the $64.00 level, where sellers may emerge.
FX Weekly: US-China Trade Tensions Remain in Focus, Adding Weight to AUD/USD
US-China trade tensions remain in focus, adding weight to AUD/USD. But after soft data in recent days, whether the pair tests the 0.6800 area in the week ahead probably depends more on what Governor Lowe has to say on Tuesday.
Westpac has long forecast a drop in AUD/USD below 0.70. However, it’s only really been in the last week or so that momentum has started to build towards our 0.68 year-end target. The sharp deterioration in trade relations between the US and China in the second week of May that saw Trump raise tariffs on $200bn of imports from China from 10 to 25% and order his trade representative, Robert Lighthizer, to start work on raising tariffs on all remaining imports was one factor pushing the A$ below 0.70.
However, the other was RBA guidance on the Australian economy. A week ago, the RBA cuts its forecasts for growth and inflation to barely acceptable levels despite making the technical assumption of two rate cuts in its forecasts. In the RBA’s May 7 policy statement the Board noted it would be “paying close attention to developments in the labour market at its upcoming meetings”.
Clearly then, it would not have been pleased to see the unemployment rate in Australia pop up to 5.2%, though there may have been some comfort in another month of robust job creation, with a headline 28k boosting annual jobs growth to 2.6%, and full-time jobs up 2.9%yr.
However, rate cut expectations were reinforced by a worrying slide in the employment index of the Apr NAB business survey and another quarter of sluggish wages growth, while this weekend’s Australian federal election adds to the uncertain outlook. Polls point to an 80% chance of the Coalition government losing power to Labor after 6 years but perhaps relying on cross-bench support in the Senate, adding to uncertainty early next week.
On Tuesday we see the minutes from the May RBA policy meeting but the key for AUD should be 45 minutes later when RBA Governor Lowe speaks on the “Economic Outlook and Monetary Policy.” Traders will be watching this speech for any guidance on how quickly rates will be cut, with money markets fully pricing a move by July and 80% for June.
The Australian dollar has fallen 2.2% so far this month and is the worst performing G10 currency over that period. However, it’s not been all bad news for the A$ outlook. The price of iron ore has continued surging towards $100 per tonne, a level last seen in May 2014. Some analysts have been talking about a move through $100 to $110 as stockpiles of iron ore in China fall as a result of the tailings dam collapse in Brazil in February slashing global supply.
There was also a glimmer of hope on trade wars as the Trump administration reportedly delayed a decision on auto tariffs for 6 months (it had been due by tomorrow). However, the US did move this week to blacklist Huawei, a move that bans the company from acquiring components and technology from US firms without government approval.
The ratcheting up of tariffs on Chinese goods, the retaliatory tariff increases by China and this action on the Huawei have materially hardened the dialogue between the two superpowers. Consequently risk and growth sentiment are likely to be suppressed in the near term. This is a weight on AUD/USD though whether the pair tests the 0.6800 area probably depends more on what Governor Lowe has to say.
Event risk: Australia federal election (Sat), Japan Q1 GDP (Mon), RBA May meeting minutes, RBA Governor Lowe speaks (Tue), NZ Q1 retail sales, UK Apr CPI, FOMC May meeting minutes (Wed), India election results, European Parliament elections commence (Thu), Japan Apr CPI, UK Apr retail sales, US Apr durable goods orders (Fri)
Cliff Notes: A Troubling Tone
Key insights from the week that was.
Owing to the focus that the RBA has placed on the labour market’s health, the April labour force survey and Q1 wage price index were the key releases for Australia this week. The April labour force report was mixed. The increase in employment was materially above both our and the market’s expectation. And, as a result, annual and 6-month annualised employment growth remained elevated at 2.6%. Nonetheless, the unemployment rate edged higher again to 5.2% as the participation rate rose to a record high. More telling on the state of the labour market, underemployment rose to 8.5%, just 0.5ppts below its previous peak. It is unsurprising then that wages growth disappointed in the March quarter, with a gain of just 0.5% (2.3%yr). Wage weakness remains broad-based by industry and across the states, with Victoria the only state to experience a sustained, robust uptrend in wage growth.
The NAB business survey for April highlighted that a further deterioration in the labour market should be expected in coming months. At -1, the survey’s employment index now points to annualised job growth of just 1.3%, half the annual (and annualised) pace of April and also below growth in the working age population (1.7%yr) – the latter indicates that the unemployment and underemployment rates will continue to trend up through 2019. The other detail of this survey was also weak, with both business conditions and confidence below long-run average levels and capital expenditure expectations in a downtrend.
On consumer sentiment, the Westpac-MI Consumer Sentiment Index rose slightly in May to 101.3 from April’s 100.7. Note however that the May reading is below the April post-Budget responses, which equate to an index reading of 104.3. The detail imply that the Budget’s tax measures and a strong expectation of rate cuts in coming months are supporting views on family finances. That said, they are still below long-run average levels, as is ‘time to buy a major household item’. The labour market deterioration and continuing house price declines pose clear risks to already-weak consumption and to investment in consumer-related sectors.
Offshore, market headlines have again been dominated by US/China trade tensions as China retaliated in kind on Monday to last Friday’s US’ tariff increase. Almost all US exports to China will now face tariffs of between 5% and 25% from 1 June. Unsurprisingly the US exports hardest hit are strategically-important goods such as agricultural commodities and natural gas. There is little chance of progress before the end of June, when President Xi and President Trump meet at the Osaka G-20 meeting.
This week’s Chinese data has been supportive of the market view (and President Trump’s) that China will be hardest hit by the tariffs. Year-to-date annual growth in industrial production disappointed, decelerating to 6.2%; while growth in fixed asset investment also came in below expectations at 6.1%ytd. However, to our mind, this expectation will only prove accurate in the short run. As we move into the second half of the year and more so in 2020, China’s ability to stimulate its domestic economy will allow it to sustain robust growth of around 6%. Over the long-term, the development of higher-tech, higher-profit industry will further bolster national and household income prospects, and hence consumption. In stark contrast, not only will US corporate profits be hit in the near-term by the tariffs (and/or a need for US firms to re-organise their offshore production), but there will remain little reason to increase US business investment, with the cost of labour and the currency reducing their competitiveness, and the risk of further tariffs on US exports remaining in place. On the latter, another point of contention looms, with the US continuing to assess whether to impose tariffs on auto imports – potentially affecting trade with Europe and Japan, among others. Reportedly, this decision has been put off for six months, though the priorities of President Trump can shift abruptly.
Markets Steady After A Weak Week
Most markets still in the red, despite rebound
Friday’s action was one of consolidation in the Asian session, with most assets classes still in the red for the week, despite the rebound seen in the last few days. The US30 index is down 0.33% on the week after bouncing off the 55-week moving average at 25,267. The NAS100 has fallen 0.14% and the SPX500 0.35%.
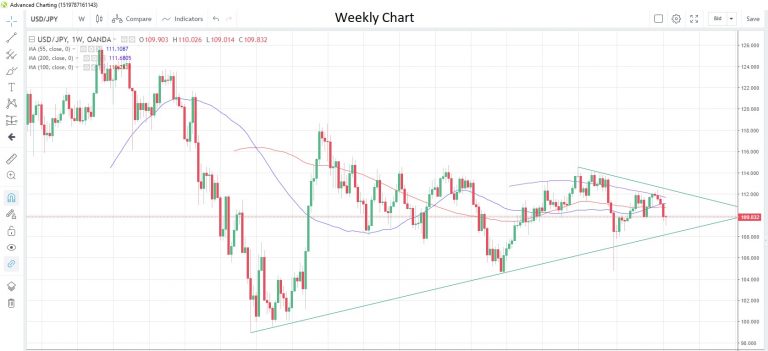
In the currency sphere, AUD/USD is languishing near 4-1/2 month lows after a disappointing week as the market interpreted recent data releases as an input that would push the RBA to an easing bias, possibly as early as next month’s meeting. AUD/USD is up 0.07% today at 0.6893. USD/JPY has seen some profit-taking and a scaling back of safe haven yen buying this week and is almost flat on the week. It’s now at 109.88 after touching 109.01 earlier in the week. The FX pair could snap a four-week losing streak this week.
USD/JPY Weekly Chart
Singapore exports contract further
Singapore’s non-oil domestic exports contracted again in April, the second month in a row and this time by 10.0% y/y following an 11.8% decline in March. The major culprits for the decline were a 31.1% decline in shipments to Japan and -25.4% to the Euro-zone. Shipments to the US increased by 2.2% from a year ago.
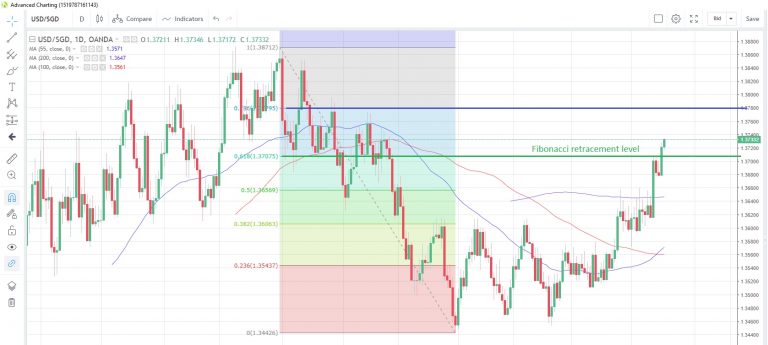
The Singapore dollar weakened further after the release of the data, falling as much as 0.1% versus the US dollar to 1.3735, the weakest level since December 27. USD/SGD is now trading above the 61.8% Fibonacci retracement of the decline from October to January. The 78.6% retracement will be found at 1.3780.
USD/SGD Daily Chart
Are we due a Hong Kong growth revision?
Hong Kong releases final economic growth numbers for the first quarter of this year later today. The first estimate showed the economy expanded 0.5% from a year earlier with government spending the major contributor. Despite the fact that China reported steady growth of +6.4% y/y in the same quarter, there is still a risk that the Hong Kong numbers could be revised lower.
Such an outcome could indicate that Q2 performance might not be as buoyant and could result in a negative reaction across asset classes. The data is released at 0830GMT.
Euro-zone consumer prices feature
Consumer prices in the Euro-zone are expected to show a slower pace of increase in April, according to the latest survey of economists. Prices probably rose 0.7% m/m after spiking to +1.0% in March, the highest reading in 13 months.
It’s a slow calendar in North America, with US Michigan sentiment seen improving to 97.5 in May from 97.2. Speeches from Fed’s Clarida and Williams complete the week.
Market Morning Briefing: Euro Is Trading Lower And Could Test 1.1150 On The Downside
STOCKS
Equities have recovered sharply as the impact of the of the trade war seems to be fading away as there is no fresh developments on the same. While there is room for further rise in the near term, indices like the Dow, Sensex and Nifty have crucial resistances ahead which can halt the current corrective rally and trigger a fresh fall. As such we would like to remain cautious and see how the indices behave after testing their resistances.
Dow (25862.68, +214.66, +0.84%) has crucial resistances at 26000 and 26250 which can be tested in the coming sessions. We have to see if it surpass these hurdles or not. A strong turn-around from either of these levels could indicate a fresh leg of sell-off.
DAX (12310.37, +210.80, +1.74%) has risen sharply above 12250 and looks bullish to test 12450-12500 while it sustains above 12250.
Nikkei (21391.53, +1.56%) has risen from support near 21000 and has been moving towards our expected 21400-21500 levels. Near term looks bullish for the next 1-2 sessions.
Shanghai (2917.75, -1.28%) has dipped from 2950 seen yesterday. While the index remains below 3000, it could be ranged within 3000-2850/00; 2850/00 being immediate supports below current levels.
Sensex (37393.48, +278.60, +0.75%) and Nifty (11257.10, 100.10, 0.90%) retains their 36950-37600 and 11100-11300 sideways range respectively and has risen within it yesterday. We continue to remain bearish for a fall to 36500-36000 on Sensex and 11000-10800 on the Nifty. However, given the rise seen in global equities we may have to allow for a rise to 38000-38300 on Sensex and 11350-11400 on the Nifty before we see a fresh fall again.
COMMODITIES
A strong bounce in the equities coupled with the strength in the US dollar has pushed gold lower negating the chances of 1310-1320. Silver is bearish and can fall further. Copper's corrective rally has a key resistance ahead. Oil sustains higher and has room to rise further in the coming sessions.
Gold (1285.60) has declined below 1290 thereby reducing the chances of testing 1310-1320 which we have been mentioning over the last few days. 1290-1292 will now be a good resistance and while below it, a fall to 1280 can be seen in the coming sessions.
As expected Silver (14.5150) has declined, indeed much beyond our expected level of 14.60. The outlook is bearish. While below 14.60, a fall to 14.15-14 is possible in the coming days.
Copper (2.7405) spiked to 2.78 and has come-off slightly from there. A strong break above 2.78 is needed for the corrective rally to extend up to 2.80-2.81. While below 2.78, a dip to 2.72 is possible again.
WTI (63.51) has risen above 63. As mentioned yesterday, while above 63, a rise to 64-65 is possible in the coming sessions.
Brent (73) is holding well above 72 and is keeping the chances alive for a test of 74 the next crucial resistance. A close watch is needed around 74 as a break above it will open doors for a further rise to 76 and even 78.
FOREX
Overall currencies are trading weak against the US Dollar today. We could possibly see the week's closing at weaker levels today.
Dollar Index (97.84) rose sharply yesterday after initially coming down to 97.44. Immediate trade between 97.25-97.75 is possible with preference of support at 97.25 to hold and eventually push prices up towards 68-69 in the mdium term.
Euro (1.1176) is trading lower and could test 1.1150 on the downside. A break below 1.1150 could pull it down towards 1.11 or even lower in the longer run.
Euro-Yen (122.80) is trading between 122-123.50 region and while support at 122 holds, the pair could gradually move higher towards 124-125 in the longer run. Only on a break below 122, we may have to revisit our current projection of a bounce from here.
Dollar Yen (109.87) is also fairly dipping towards the 109 support and could eventually push prices to higher levels from here back to 110-111.
Aussie (0.6893) has plunged sharply from levels above 0.69 seen yesterday. If the pair remains below 0.69, it could target 0.68-0.67 in the longer run. Near term looks weak.
USDCNY (6.9049) has risen as expected. It would be important to see if the pair breaks above 6.91 to rise further towards 6.95 or comes off from current levels itself to move lower in the medium term. Our preference would be a test of 6.95 before falling from there.
Dollar Rupee (70.03) closed lower yesterday and has scope of testing 69.75/65 on the downside in the medium term. Before that we could see a rise back towards 70.20/30 today possibly due to sharp rise in Brent to 73 and in USDCNY to 6.9050.
INTEREST RATES
The US yields are down in line with our expectation and look further bearish for the coming sessions. The 30Yr (2.84%), 10Yr (2.41%) and 5Yr (2.18%) are trading higher today and have seen slight corrective upmoves. There is scope for s rise towards 2.90% (30Yr), 2.50% (10Yr) and 2.22% (5Yr) respectively before the yields again resume the longer term downtrend.
The German-JGB 10Yr (-0.03%) is likely to bounce from current support levels, moving back towards 0% and 0.05% in the medium term. This could indicate that the support near 122 on Euro-Yen may hold for the near term.
The Indian 10Yr GOI (7.4726%) could be broadly ranged within 7.40-7.55% region in the near term.
USD/JPY Starts Fresh Rebound, Could Test 110.40
Key Highlights
- The US Dollar found support near 109.02 after a strong decline against the Japanese Yen.
- USD/JPY recovered after it traded above a contracting triangle with resistance at 109.58 on the 4-hours chart.
- The US Initial Jobless Claims for the week ending May 11, 2019 declined from 228K to 212K.
- The Michigan Consumer Sentiment Index in May 2019 (Prelim) could rise from 97.2 to 97.5.
USDJPY Technical Analysis
After a strong rejection near 112.00, the US Dollar fell significantly against the Japanese Yen. The USD/JPY pair traded as low as 109.02, and recently started a decent recovery above 109.20 and 109.50.
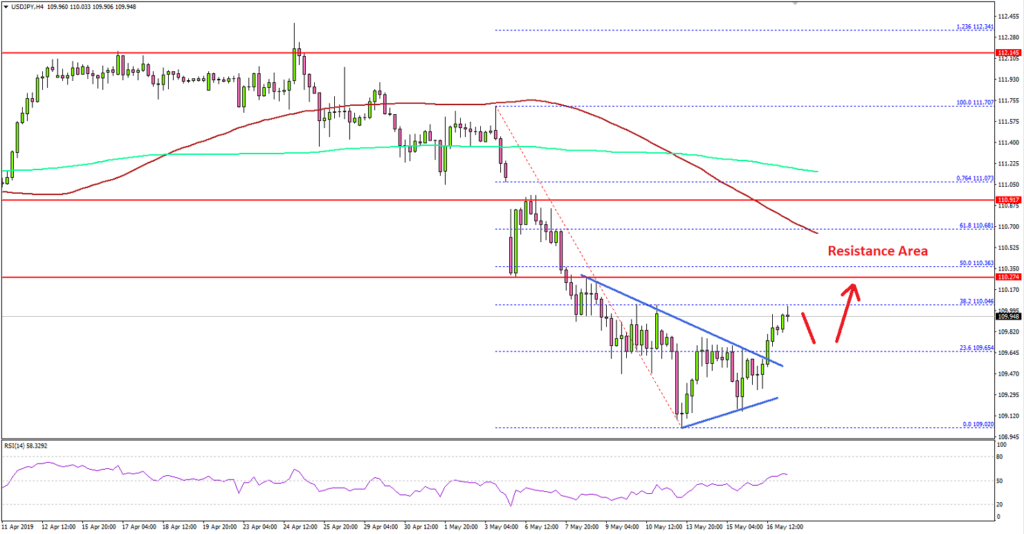
Looking at the 4-hours chart, the pair is currently rebounding, but it is still in a bearish zone below 110.70 and the 100 simple moving average (4-hours, red).
It recently broke the 23.6% Fib retracement level of the drop from the 111.70 swing high to 109.02 swing low. Besides, there was a break above a contracting triangle with resistance at 109.58 on the same chart.
On the upside, the next resistance is near the 110.30-110.40 zone (the previous support). Moreover, the 50% Fib retracement level of the drop from the 111.70 swing high to 109.02 swing low is near 110.36 to act as a strong resistance.
If there are further gains, USD/JPY could test the 110.70 resistance and the 100 simple moving average (4-hours, red).
Conversely, if the pair fails to move above 110.10 or 110.40, it could start a fresh decline. On the downside, the key support is at 109.40, below which the pair is likely to revisit 109.02.
Fundamentally, the US Initial Jobless Claims figure for the week ending May 11, 2019 was released by the US Department of Labor. The market was looking for a decline from 228K to 220K.
The actual result was better than the forecast, as there was a decline in the US Initial Jobless Claims to 212K. Besides, the 4-week moving average was 225K, up 4,750 from the previous week’s unrevised average of 220,250.
The report added:
The advance number for seasonally adjusted insured unemployment during the week ending May 4 was 1,660,000, a decrease of 28,000 from the previous week’s revised level. The previous week’s level was revised up 4,000 from 1,684,000 to 1,688,000.
Overall, there are chances of more upsides in USD/JPY towards 110.40, but other major pairs like EUR/USD, GBP/USD and AUD/USD are likely to struggle.
Economic Releases to Watch Today
- Euro Zone CPI for April 2019 (YoY) – Forecast +1.7%, versus +1.7% previous.
- Euro Zone CPI for April 2019 (MoM) – Forecast +0.7%, versus +1.0% previous.
- Michigan Consumer Sentiment Index May 2019 (Prelim) – Forecast 97.5, versus 97.2 previous.