Sample Category Title
EU Moscovici: 130% debt to GDP is already a lot
European Commissioner for Economic and Financial Affairs Pierre Moscovici warned today that "it's in Italy's interest to have a credible fiscal policy." And, Eurozone finance ministers think that "130% is already a lot", regarding Italy's debt to GDP ratio.
European Commission expects Italy's debt to growth to 133.7% of GDP this year, and peak at 135.2% in 2020. That's already far above EU's ceiling of 60%. However, Italy's Deputy Prime Minister Matteo Salvini indicated this week that debt could even reach 140% of GDP if it's necessary to boost employment.
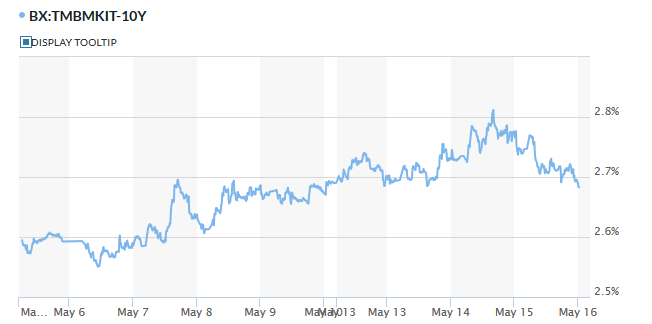
Italian 10-year yield breaks above 2.8% earlier this week on concern over Italy's budget. But it's currently back below 2.7 handle.
Sunset Market Commentary
Markets:
Global core bonds lost ground today with US Treasuries underperforming German Bunds. International trade sentiment improved since yesterday on messages that US President Trump would delay his decision to impose auto tariffs by 6 months. The delay avoids, at least for now, trade escalations with other major trade partners (the EU, Japan). Meanwhile, the US is increasing pressure on China by restricting Chinese telecommunication companies (Huawei) from doing business in the US. After a lower opening, EU equities edged higher throughout the day. German Bunds remained initially rather resilient but eventually gave in to the improvement in risk sentiment after all. The German yield curve is moving higher with changes up to 0.9 bps (10-yr). US Treasuries lost some steam as well today as risk sentiment improved in the run-up to the US session. Solid housing data, jobless claims further declining and the Philly Fed Business Outlook indicator printing well above expectations lifted sentiment even further. US Treasuries lost additional ground. The US yield curve is bear flattening with changes in the range of +1.3 bps (30-yr) to +3.8 bps (2-yr). Peripheral spreads over the German 10-yr yield are tightening with Greece (-8 bps), Spain (-4 bps), and Italy (-4 bps) outperforming.
This morning in Europe, there was little news to guide EUR/USD trading. European equities opened cautiously in line with the price action in Asia. US action against (Chinese) tech companies illustrated that the trade war was far from over. EUR/USD hovered in tight rang in the lower part of the 1.12 big figure. Risk sentiment improved in the run-up to the US session. US yields started a gradual rebound, supporting the dollar. The move was reinforced after the publication of the US data. US housing data, the jobless claims and the Philly Fed outlook all printed better than expected. The dollar received additional interest rate support as US yields rose further. EUR/USD slipped below 1.12 (currently 1.1190 area). USD/JPY also gained on the better risk sentiment and on growing interest rate support. The pair trades in the 109.75 area.
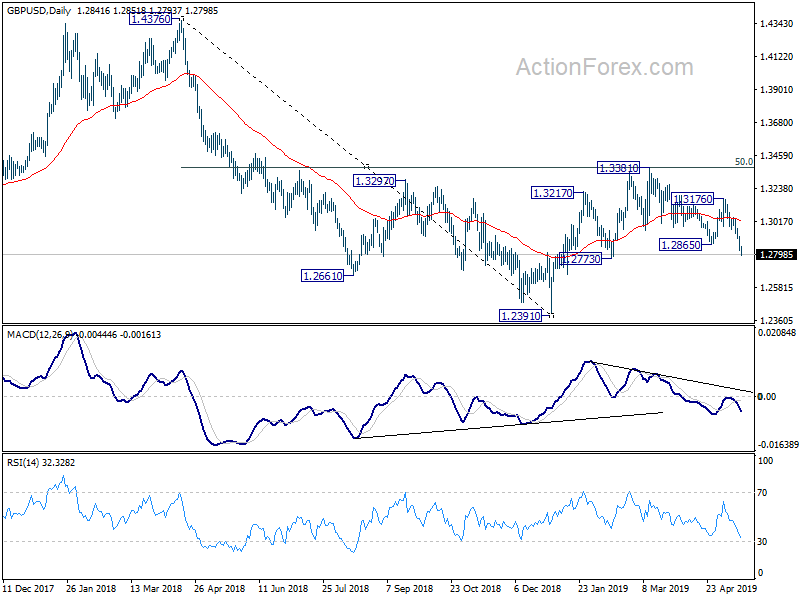
Sterling continued to fight an uphill battle today. There was no UK eco news. The focus is on the battle for leadership in the UK conservative party as UK PM May faces growing pressure to resign. The internal battle within the conservative party also makes it ever more unlikely that the government will reach a deal on Brexit with labour and if so, that it has a chance of being approved in Parliament in the near future. So visibility on the next steps in the Brexit process is becoming ever more foggy. This is putting sterling further under pressure. EUR/GBP overnight cleared the 0.8723 resistance and is currently trading in the 0.89735/40 area. Cable yesterday lost the 1.29/1.2860 support area and trades in the low 1.28 area.
News Headlines:
According to local media, Italian deputy PM Di Maio said his 5 Star Movement party wouldn’t support a budget proposal that raises the Italian public debt over 140% of GDP, contradicting his colleague deputy PM Salvini. Finance Minister Giovanni Tria said the government is committed to ensure that the public finance targets will be met.
US eco data surprised positively. The Philly Fed Business Outlook rose from 8.5 to 16.6 in May. Details were more mixed. Weekly jobless claims fell from 228k to 212k, close to multi-decade lows. Building permits (+0.6% M/M) and housing starts (+5.7% M/M) both rose in April. They were the strongest in 3 months amid lower mortgage rates and the Fed’s patience.
German Bundesbank President Weidmann warned that the potential relief from interest-rate tiering, as it’s currently being discussed, would be noticeable yet insignificant. He warned for negative side-effects for the financial sector.
US Housing Starts Step Up in April
- U.S. housing starts in April rose 5.7% to 1.24 million units (annualized) from a notable upwardly revised 1.17 million units in March.
- The increase was broad based, with both single and multi-family starts coming in higher. Single-family starts rose by 6.2% to 854k, while the more volatile multi-family segment posted a gain of 4.7% to 381k.
- Permits advanced by 0.6% in April to 1.3 million after three consecutive months of declines. The gain was concentrated in the multi-family segment which was up 8.9%. Single family permits posted its fifth consecutive decline at -4.2%.
- On a regional basis, the outturn was evenly split with significant gains posted in the Northeast (+84.6%), and Midwest (+42.0%), while declines were recorded for the West (-5.5%) and the South (-5.7%).
Key Implications
- Housing starts in April continue to build on modest gains observed in March – reversing the decline that was previously reported for that month. Looking beneath the headline print, the increase was spread across both market segments and featured sizeable gains in two out of four regions.
- Both starts and permits were the strongest they have been in three months, suggesting that despite headwinds faced by the industry, the prospects for greater output in the sector, which has been going through a soft patch of late, is looking better. In fact, homebuilder sentiment reached a seven month high in May.
- On the demand side, moderating homes prices, falling mortgage rates and higher wages should continue to buoy demand as the busy Spring season picks up.
Canadian Manufacturing Sales Rebound in March
- Canadian manufacturing sales advanced 2.1% (m/m) in March, following a 0.2% drop in February. The release came in higher than market expectations for a 1.5% increase. After accounting for price changes, the print was still encouraging, with volumes up 1.6%.
- The composition of the gains was mixed, with 12 out of the 21 industries recording a gain. Durable goods led the way, up 2.9% on the month. This was driven largely by strong transportation equipment sales (+4.5%) on the back of a 7.1% increase in the volatile aerospace products and parts shipments category (which fell 12.2% in January), and more importantly, a rebound in motor vehicle sales (+6.5%). Statistics Canada attributes the latter to a drawing down of inventories in several plants. Shipments of primary metals were also up an impressive 5.3%.
- Non-durable goods also advanced in March, up 1.3%. This was driven largely by petroleum and coal products (+8.2%).
- Regionally, manufacturing sales increased in 8 out of the 10 provinces. Ontario (+1.7%), Alberta (+3.9%), Quebec (+1.7%), and British Columbia (+3.8%) led the gains. The Atlantic provinces saw impressive gains, with sales in Newfoundland & Labrador up 14.5%, and sales in New Brunswick up 4.9%. Declines in Saskatchewan (-2.1%) and Manitoba (-1.9%) provided some offset.
- Inventories climbed 1% (the fourth consecutive monthly increase), but improved shipments reduced the inventory-to-sales ratio to 1.50 (from 1.52). Forward looking indicators were generally positive, with new orders up 1.5%, although unfilled orders were flat (up 0.1%).
Key Implications
- Like last week's international trade data, March's manufacturing sales print is encouraging, and provides some decent momentum heading into the second quarter. For the first quarter as a whole, however, manufacturing sales volumes were up only a modest 0.3%, further confirmation of the soft patch that started the year. The release leaves our GDP tracking effectively unchanged at around 0.5% for Q1.
- The outlook for manufacturing sales remains uncertain. A low Canadian dollar and strong performance south of the border should be supportive of the sector, but recent tariff developments between the U.S. and China, generally heightened global trade uncertainty, and still high inventory levels all serve as moderating factors.
USD/JPY Mid-Day Outlook
Daily Pivots: (S1) 109.26; (P) 109.48; (R1) 109.81; More...
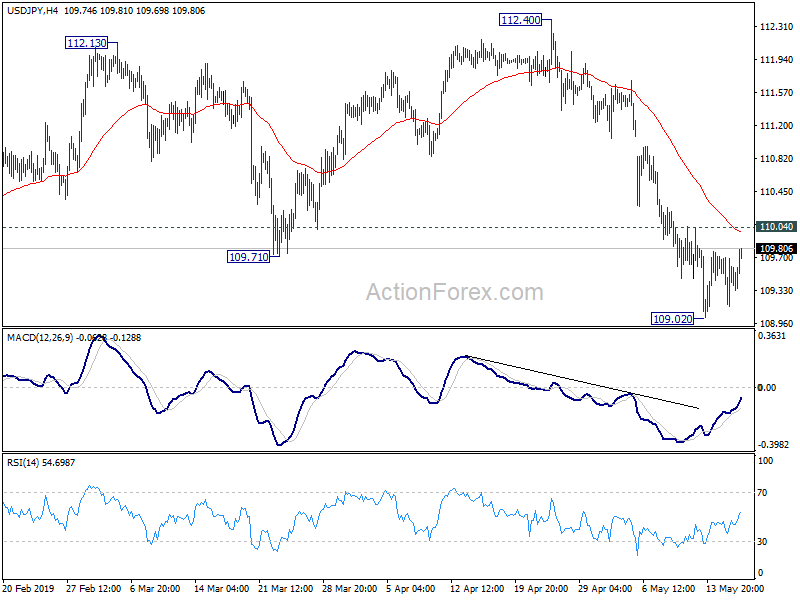
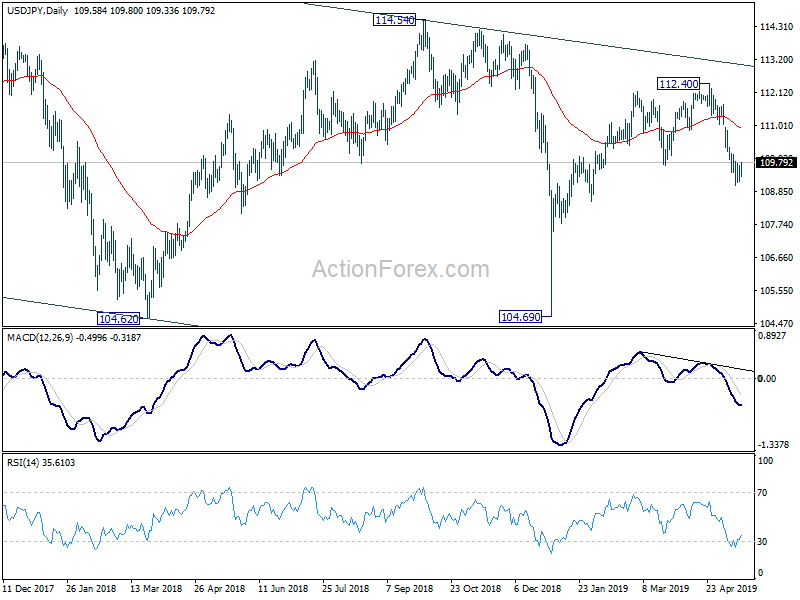
Intraday bias in USD/JPY remains neutral as consolidation from 109.02 temporary low is extending. Further decline is expected as long as 110.04 resistance holds. On the downside, break of 109.02 will resume the fall from 112.40 to retest 104.69 low. Nevertheless, break of 110.04 minor resistance will indicate short term bottom. Lengthier consolidation could then be seen before another decline.
In the bigger picture, USD/JPY is staying inside falling channel from 118.65. Currently development suggests that rebound from 104.69 is only a corrective move. And fall from 118.65 is not completed yet. Decisive break of 104.69 will extend the down trend towards 98.97 support (2016 low). For now, we'd expect strong support above there to bring rebound.
USD/CHF Mid-Day Outlook
Daily Pivots: (S1) 1.0062; (P) 1.0080; (R1) 1.0105; More...
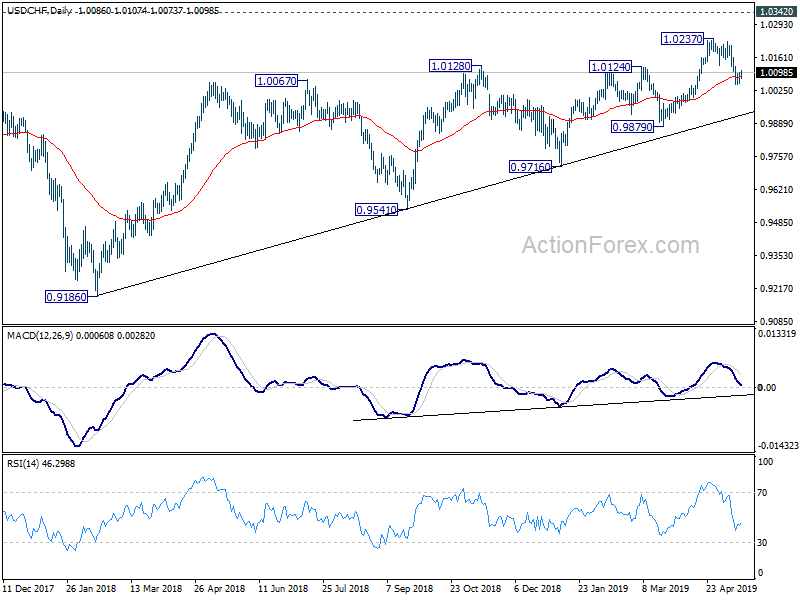
USD/CHF is staying in consolidation from 1.0050 temporary low and intraday bias remains neutral first. Upside of recovery should be limited by 1.0126 minor resistance to bring another decline. On the downside, break of 1.0050 will resume the fall from 1.0237 to retest 0.9879 key support. However, firm break of 1.0126 will turn bias back to the upside for 1.0237 resistance.
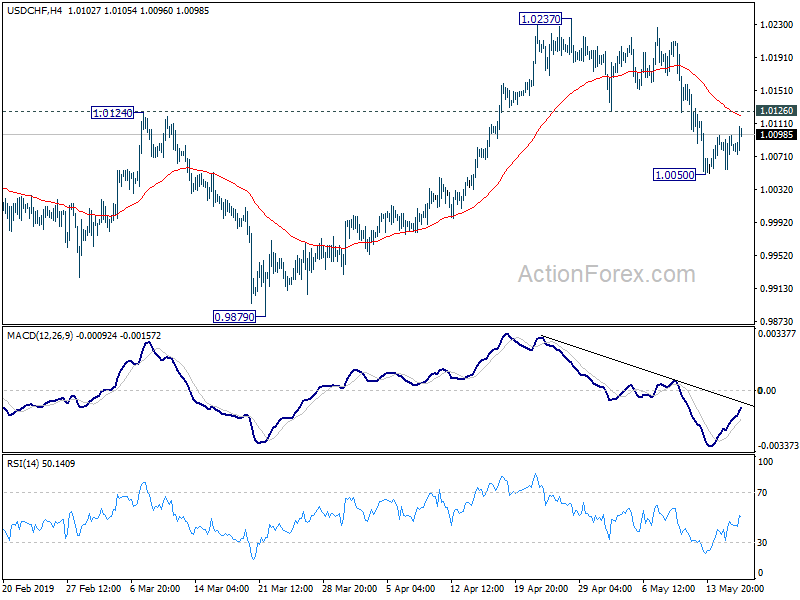
In the bigger picture, as long as 0.9879 support holds, medium term up trend form 0.9186 is still in progress. Break of 1.0237 will target 1.0342 resistance next. For now, we'd be cautious on strong resistance from there to limit upside, until we see medium term upside acceleration. However, decisive break of 0.9879 will be a strong sign of medium term reversal. Focus will be turned back to 0.9716 support for confirmation.
EUR/USD Mid-Day Outlook
Daily Pivots: (S1) 1.1178; (P) 1.1202; (R1) 1.1225; More.....
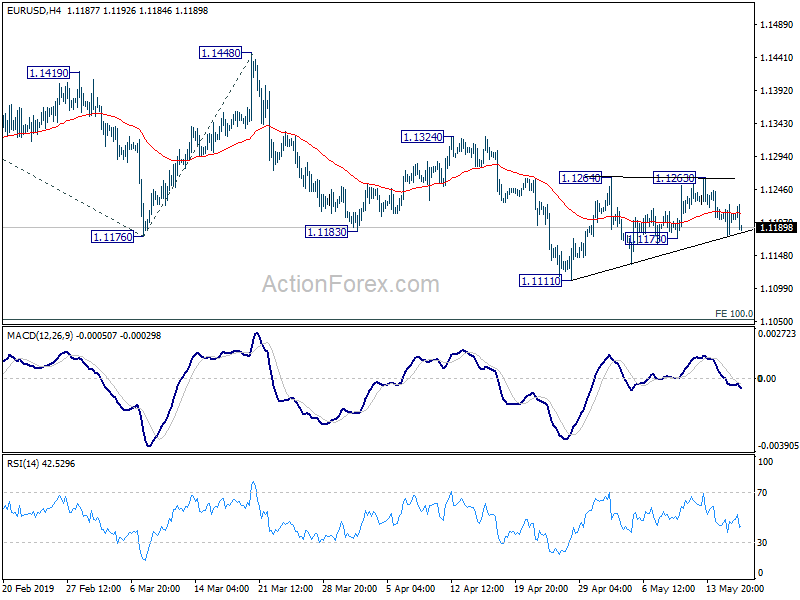
No change in EUR/USD's outlook and intraday bias remains neutral. Consolidation from 1.1111 might extend. In case of another rise, upside should be limited well below 1.1324 resistance. On the downside, break of 1.1173 will turn bias to the downside for 1.1111 low. Break will extend down trend to 100% projection of 1.1448 to 1.1183 from 1.1324 at 1.1059.
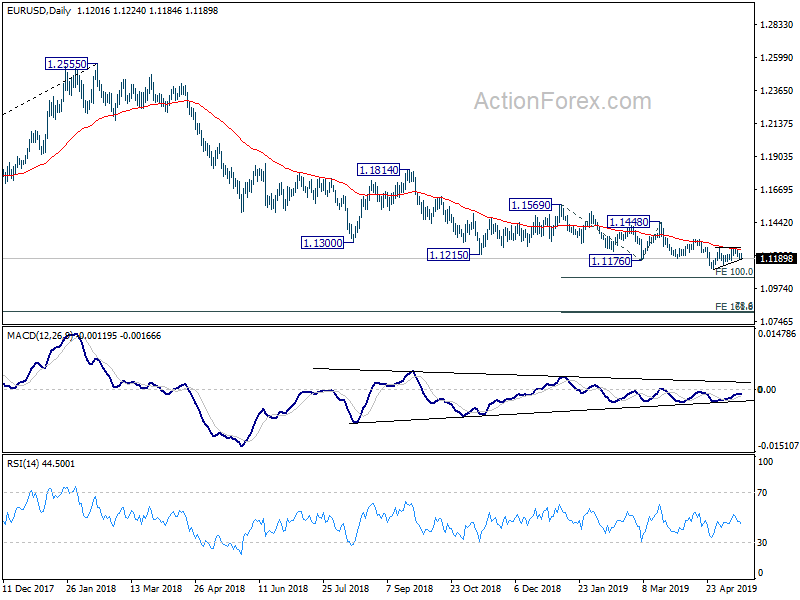
In the bigger picture, down trend from 1.2555 (2018 high) has just resumed. 61.8% retracement of 1.0339 (2016 low) to 1.2555 (2018 high) at 1.1186 was also taken out. Current fall should now target 78.6% retracement at 1.0813. Sustained break there will pave the way to retest 1.0339. On the downside, break of 1.1448 resistance is needed to be the first sign of medium term bottoming. Otherwise, outlook will stay bearish in case of rebound.
EURJPY Gains Expected to Reach Downtrend Line
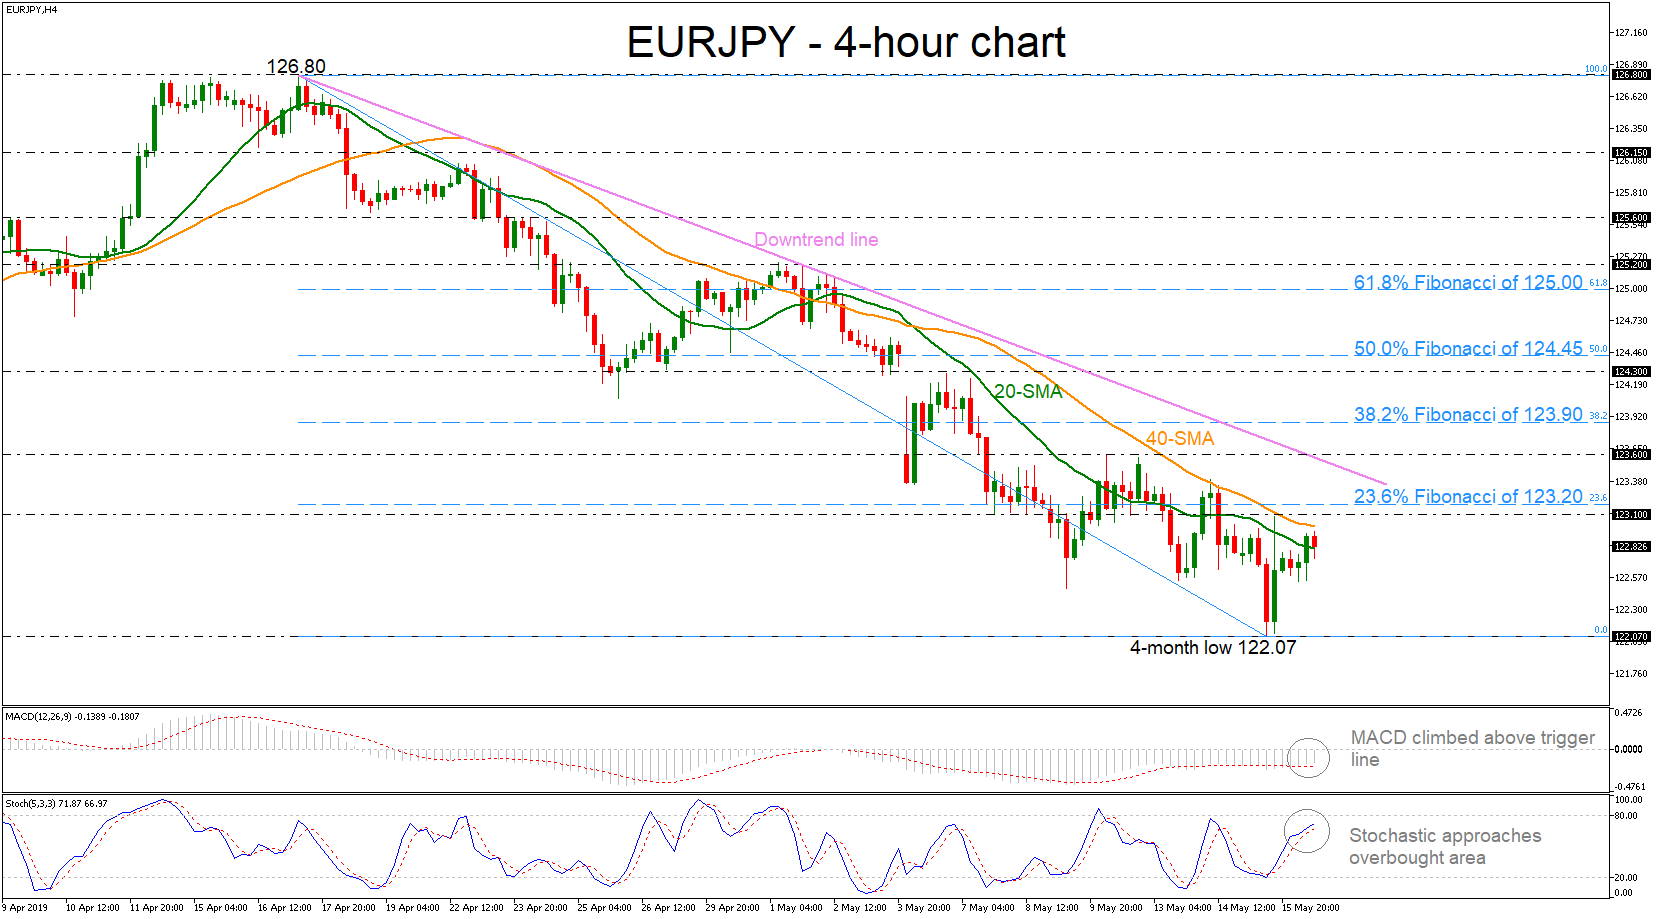
EURJPY reversed higher after it tumbled towards a fresh four-month low of 122.07 this week. The technical picture supports that the slightly bullish correction is likely to continue in the short-term. The MACD is stretching to the upside above its trigger line and the stochastic oscillator is approaching the overbought zone in the 4-hour chart.
Another move to the upside could find resistance at the 40-simple moving average (SMA) currently at 123.00 and the 123.10 resistance. Marginally higher, the 23.6% Fibonacci retracement level of the downleg from 126.80 to 122.07 of 123.20 is coming into focus ahead of the short-term downtrend line near the 123.60 barrier.
In case of negative pressures, the market could meet support at the 122.07 level while a successful close below this level could see a retest of the 118.57 trough, reached on December 2018.
In brief, EURJPY has been in a downward movement over the last three month and bears should be waiting for a decline below the 4-month bottom for further selling interest.
Canada Manufacturing Sales Up in March but Grey Clouds in the Outlook
- Canada manufacturing sales rose 2.1% in March after falling 0.2% in February
- Part of the increase came from higher energy costs that boosted sales at petroleum refineries. Controlling for price effects, sales increased 1.6% in March
The bounce-back in manufacturing sales is consistent with other indicators suggesting that much of a pullback in overall economic output in February was tied to transitory bad-weather effects that temporarily limited transportation capacity. Earlier February GDP data suggested that rail capacity in particular was limited by cold weather in February and export volumes also bounced back in March after a soft prior month. The increase in March manufacturing sales was led by a 4% jump in motor vehicle sales and a price-led jump in petroleum & coal sales.
The manufacturing numbers mean that overall economic growth probably returned at least modestly to the positive column in March after GDP declined 0.1% in February. Growth for Q1 as a whole still looks likely to be on the soft side – at a touch less than 1%. We continue to expect a ‘rebound’ to a 2% rate in Q2 as some of the transitory disruptions that plagued activity in Q1 (bad weather, Alberta oil & gas production curtailments) ease. Escalating U.S.-China trade tensions have added grey clouds to the outlook, though. The US manufacturing sector has already shown signs of slowing in recent months – and part of that is likely due to increased U.S. import tariffs that have disproportionately impacted the industrial sector. That was, of course, before the implementation of the latest round of US tariff escalation last Friday. Close integration of North American supply chains means that any negative impact to US industry will also likely have spillovers to Canada. We continue to expect, at this point, that those spillovers will be manageable but uncertainty about global trade disruptions will continue to weigh on business investment decisions – and, alongside still benign inflation trends, will leave the Bank of Canada with plenty of reason for caution about considering any future interest rate hikes.
GBP/USD Mid-Day Outlook
Daily Pivots: (S1) 1.2805; (P) 1.2864; (R1) 1.2902; More....
GBP/USD drops further to as low as 1.2793 so far today and intraday bias stays on the downside. Rebound from 1.2391 should have completed 1.3381 already. Deeper fall should be seen to retest 1.3381 low. On the upside, above 1.2851 minor resistance will turn intraday bias neutral for consolidation first. But recovery should be limited well below 1.3176 resistance to bring fall resumption.
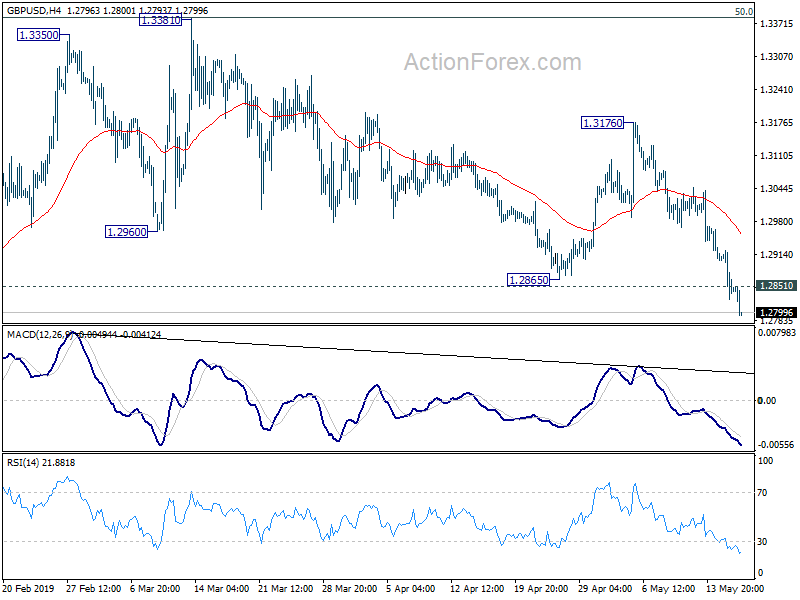
In the bigger picture, medium term decline from 1.4376 (2018 high) halted and made a medium term bottom after hitting 1.2391. Rebound from 1.2391 is seen as a corrective move for now. In case of another rise, strong resistance could be seen around 61.8% retracement of 1.4376 to 1.2391 at 1.3618 to limit upside. On the downside, break of 1.2773 support will suggests that such corrective rise is completed and bring retest of 1.2391 low first.