
Sample Category Title
Fed to hold at 4.25–4.50%, eyes on (any) dot plot shift
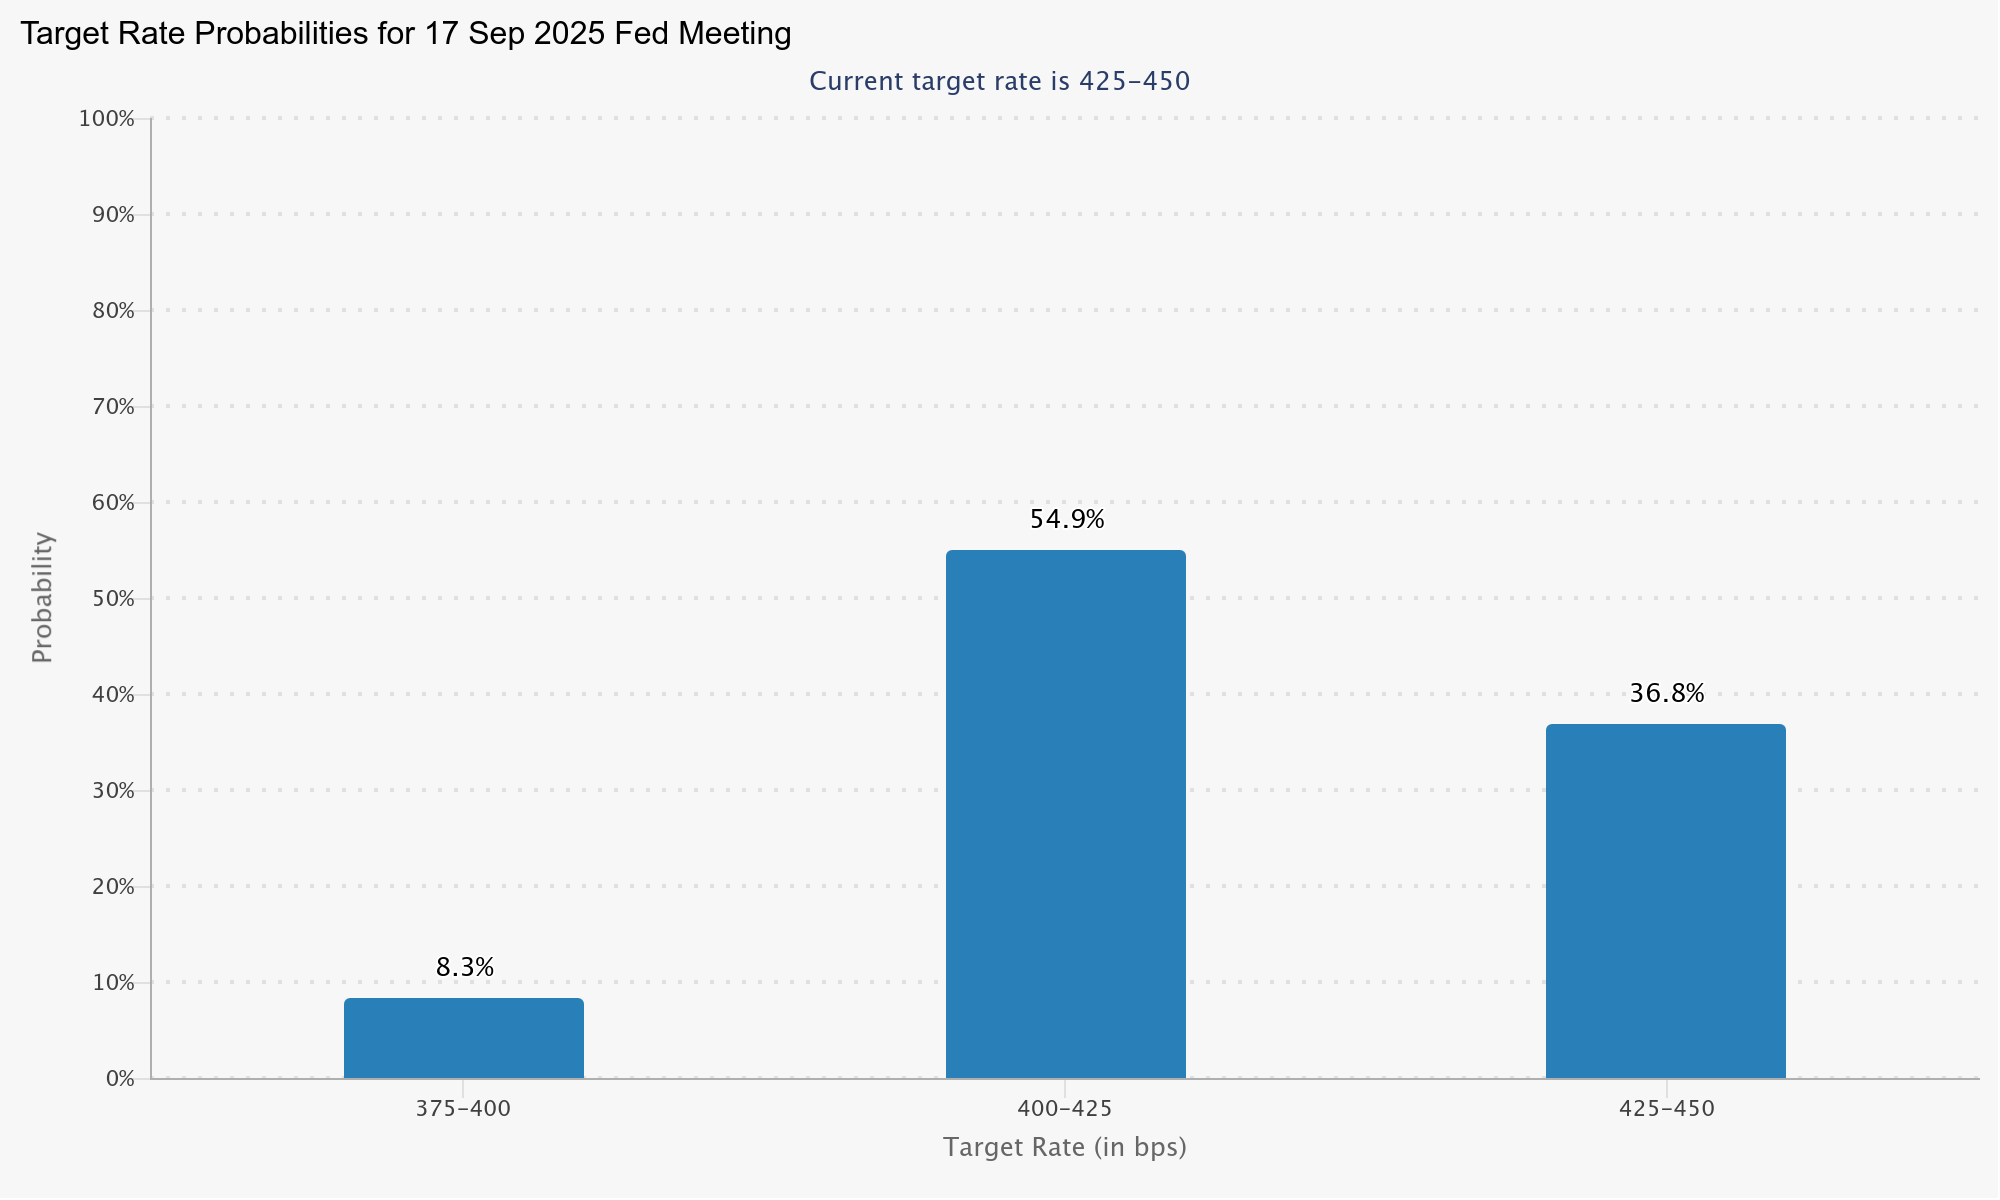
Fed is all but certain to keep its target rate unchanged at 4.25–4.50% today, with fed fund futures assigning a near-unanimous 99.9% probability to that outcome. Similarly, the likelihood of any move in July is negligible, with markets pricing in an 85% chance that rates will remain on hold. Instead, the focus is on the September meeting, where futures suggest a roughly 63% chance of Fed resume its easing cycle.
The biggest variable in today’s announcement will be the updated Summary of Economic Projections, especially the dot plot. In March, the median forecast signaled two rate cuts in 2025. However, that view was narrowly held, and it would take just two FOMC members adjusting their dots to shift the median forecast to one cut.
However, the inflation and growth projections themselves may offer limited clarity due to the lingering uncertainty over trade policy. The 90-day reciprocal tariff truce expires in early July, and with no clear signal from Washington, Fed is unlikely to factor tariff impacts heavily into its base case just yet.
Chair Jerome Powell is expected to reiterate his recent message that “policy is in a good place” and that there is no rush to cut. Investors will watch closely for any tone shift in his comments on labor market softening and disinflation trends, but the overall message will likely reinforce Fed’s preference for patience. With no new direction expected, market reactions are likely to be limited in the immediate aftermath of the meeting.
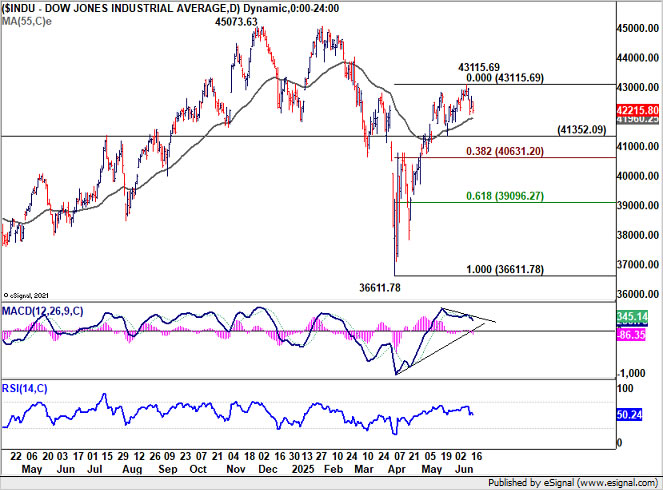
Technically, DOW's rally attempt this week lacks conviction. Bearish divergence condition in D MACD suggests that a short term top could have already formed at 43115.69. Deeper pull back is likely in the near term. Firm break of 41352.09 support will bring deeper fall to 38.2% retracement of 36611.78 to 43115.69 at 40631.20 at least, even still as a corrective move to the rally from 36611.78, not to mention that there is risk of near term bearish reversal.
Japan’s exports slide – 1.7% yoy in May as auto tariffs from US take toll
Japan’s trade data for May revealed growing pressure on its export sector, with headline exports falling -1.7% yoy to JPY 8.135T. Imports dropped -7.7% yoy to JPY 8.773T. The resulting trade deficit stood at JPY -637.6B.
Of particular concern was the sharp -11.1% fall in exports to the US, where car shipments plunged -24.7% yoy on the immediate impact of US tariffs.
Despite posting a trade surplus of JPY 451.7B with the US, the bilateral trend was negative. Imports from the US dropped -13.5% yoy. Japanese exporters are now grappling with a 25% tariff on autos and auto parts, plus a 10% baseline levy on all other goods. Steel and aluminum products have also been hit with a 50% tariff in early June.
On a seasonally adjusted basis, exports edged up just 0.1% mom, while imports declined -0.3% mom, leaving a narrower but still negative trade balance of JPY -305B.
USD/CAD Attempts Recovery — Fed Policy Meeting In Focus
Key Highlights
- USD/CAD remained in a bearish zone and dropped below 1.3700.
- A key bearish trend line is forming with resistance at 1.3635 on the 4-hour chart.
- EUR/USD is now consolidating gains above the 1.1450 zone.
- Gold prices remain supported above the $3,350 level ahead of the Fed interest rate decision.
USD/CAD Technical Analysis
The US Dollar started a major decline from well above 1.3850 against the Canadian Dollar. USD/CAD declined below 1.3750 and 1.3700 levels.
Looking at the 4-hour chart, the pair settled below the 1.3700 level, the 100 simple moving average (red, 4-hour), and the 200 simple moving average (green, 4-hour). The pair even declined below 1.3550. The recent low was formed at 1.3539 and the pair is now consolidating losses.
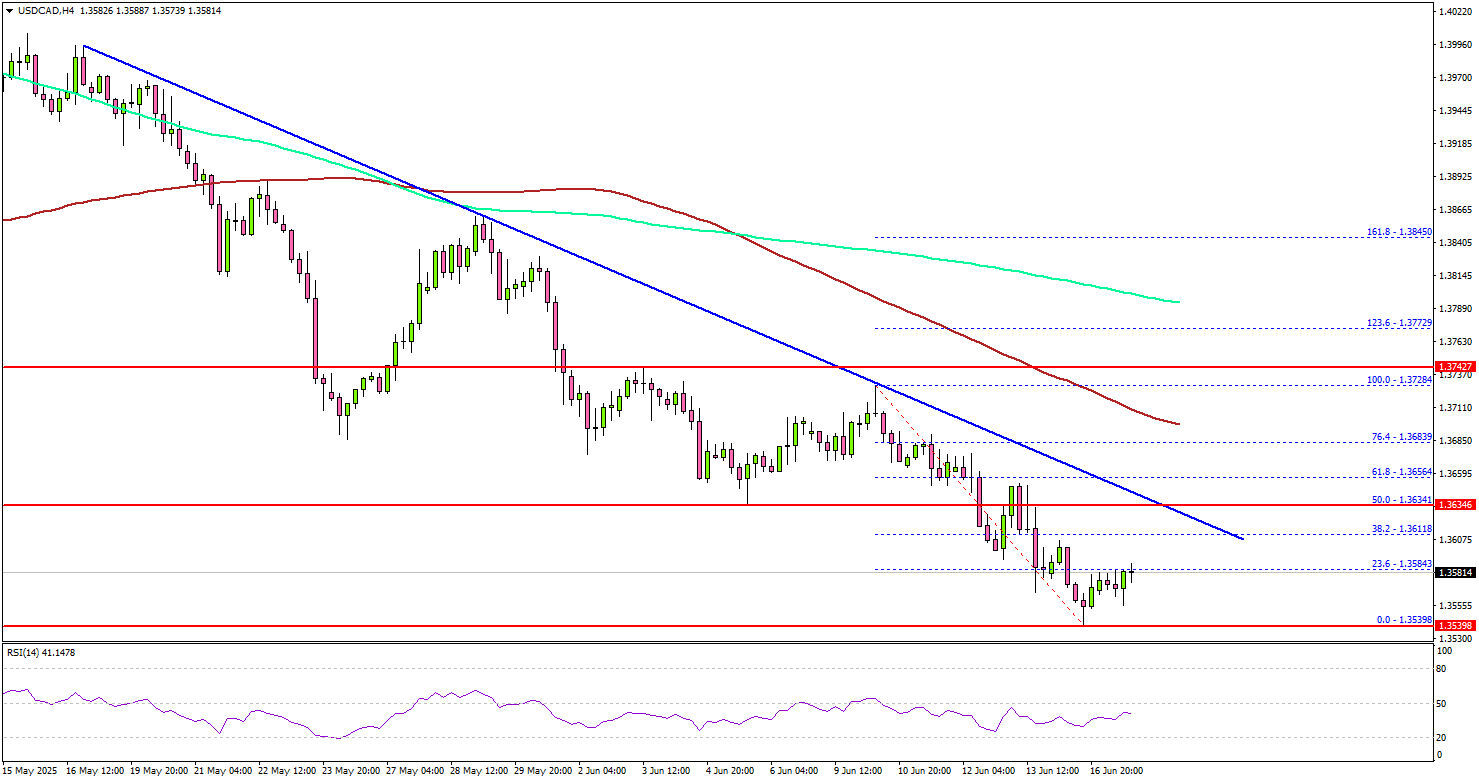
On the upside, the pair could face resistance near the 1.3600 level. The next key resistance sits near the 1.3620 level. There is also a key bearish trend line forming with resistance at 1.3635 on the same chart.
The first major resistance sits at 1.3665. A close above the 1.3665 level could set the pace for another increase. In the stated case, the pair could even clear the 1.3700 resistance. The next major stop for the bulls could be near the 1.3800 resistance.
On the downside, immediate support is near the 1.3540 level. The next key support sits near 1.3500. Any more losses could send the pair toward the 1.3420 level. The main support could be near 1.3250.
Looking at Gold, the price remained above the $3,350 support, and the bulls seem to be now waiting for the key Fed interest rate decision.
Upcoming Economic Events:
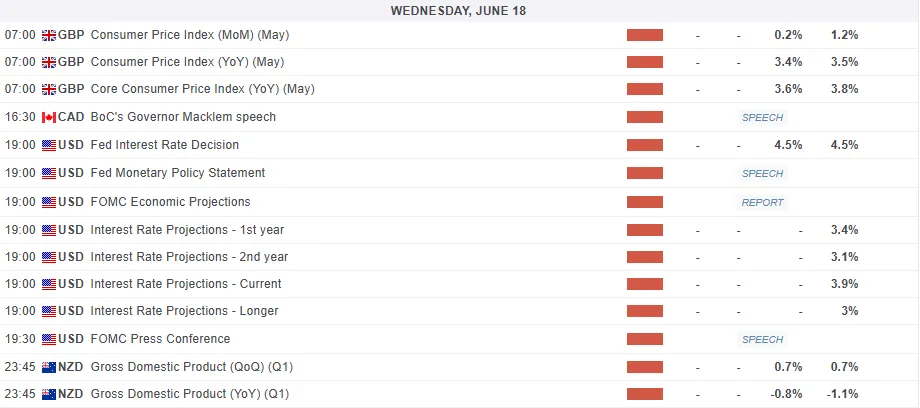
- UK Consumer Price Index for May 2025 (YoY) – Forecast +3.4%, versus +3.5% previous.
- UK Core Consumer Price Index for May 2025 (YoY) – Forecast +3.6%, versus +3.8% previous.
- Fed Interest Rate Decision - Forecast 4.5%, versus 4.5% previous.
- US Initial Jobless Claims - Forecast 245K, versus 248K previous.
Gold (XAU/USD) Market Outlook: Central Bank Demand and Price Correction, $3350/oz Incoming?
Gold prices continue to struggle this week with the precious metal unable to hold convincingly above the $3400/oz handle.
This is no doubt a surprise given the tensions in the Middle East as well as data from the World Gold Council monthly report which showed Central Bank buying remains elevated.
Sentiment has been swaying back and forth with Gold taking its cues from comments around the Israel-Iran situation. The fact that Gold has failed to make fresh highs as a result of rising Geopolitical risk does not bode particularly well for the precious metal.
Another sign that the bullish rally may have been waning even before the Israel-Iran conflict came in May, where buyers couldn’t drive gold prices higher than the previous month’s top. This was the first time this happened since November.
Central Bank Gold Reserves Survey 2025
The World Gold Council released the 2025 Central Bank Gold Reserves (CBGR) survey, held from February 25 to May 20, which highlighted the ongoing importance of managing gold reserves during tough times. This year, the survey hit a new record with 73 responses, the most since the survey began eight years ago.
The report painted a pretty picture for Gold demand, most respondents (95%) think central banks around the world will add more gold to their reserves in the next year.
This year, a record 43% of respondents believe that their own gold reserves will also increase over the same period. Interestingly, none of our respondents anticipate a decline in their gold reserves.
This should not come as a surprise as global uncertainty and nationalism continue to rise around the globe, Gold was certain to return to its rightful place as the ultimate safe haven.
Other key takeaways from the survey:
- The majority of respondents (73%) see moderate or significantly lower US dollar holdings within global reserves over the next five years. Respondents also believe that the share of other currencies, such as the euro and renminbi, as well as gold, will increase over the same period.
- The survey highlighted an uptick in respondents who actively manage their gold reserves, from 37% in 2024 to 44% in 2025. While enhancing returns remained the primary reason for this, risk management leapfrogged tactical trading as the second most selected reason.
- The Bank of England remains the most popular vaulting location for gold reserves amongst respondents (64%).
Central banks have accumulated over 1,000t of gold in each of the last three years, up significantly from the 400-500t average over the preceding decade.
A prime example would be the Peoples Bank of China (PBoC) which reported buying gold for seven straight months, adding 1.9 tons to its reserves in May. China's official gold holdings are now at 2,296 tons, making up 6.7% of its total foreign exchange reserves.
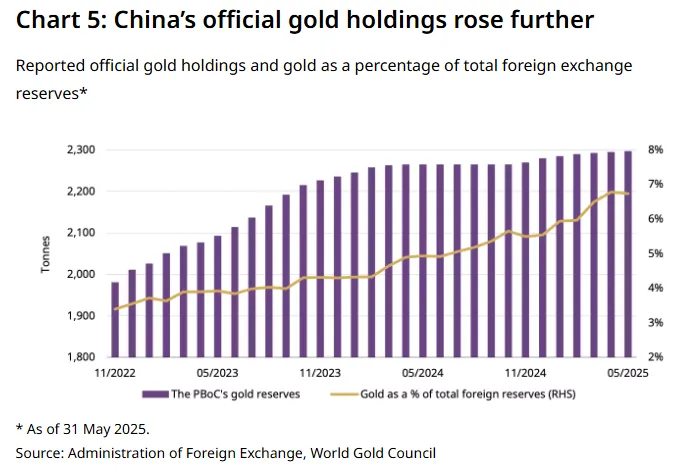
Source: World Gold Council
All of this bodes well for the longer term picture where Gold is concerned.
However, in the short-term the possibility of a deeper correction continues to grow. The longer the $3500/oz handle holds firm the more likely Gold is to revisit the $3000/oz handle and possibly previous all-time highs around $2800/oz.
The parabolic move higher this year and the back end of last year has not faced a meaningful pullback. Is the time nearing for a significant pullback in Gold prices?
The Week Ahead
The rest of the week will remain busy as the Middle East continues to be a source of focus. The situation is fluid and rapidly evolving, thus volatility could arrive at any moment.
From a data standpoint, tomorrow brings the FOMC meeting as well as updated Fed projections which could provide us valuable insights into monetary policy moving forward.
Following the retail sales data today, US short-term interest rate futures trimmed earlier gains with traders sticking to a September rate cut view. Any change in this regard from tomorrow's FOMC meeting could have a big impact on Gold prices.
For all market-moving economic releases and events, see the MarketPulse Economic Calendar. (click to enlarge)
Technical Analysis - Gold
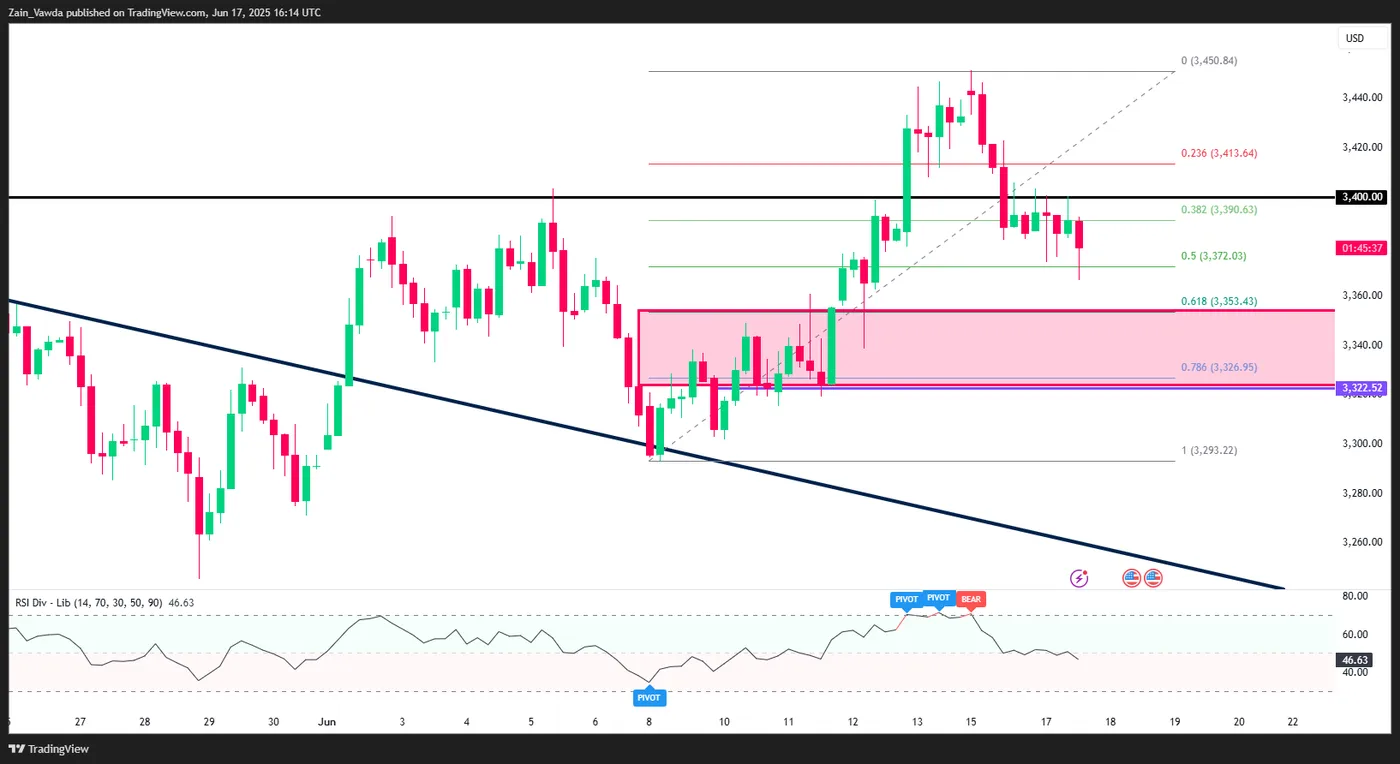
From a technical standpoint, Gold is struggling to hold above the 3400 handle.
The precious metal has been on a steady decline since the Sunday evening high around 3450.
The period 14 RSI has also crossed below the 50 neutral level hinting at a potential shift in momentum.
Just looking at price action and i drew in the Fib retracement tool with the golden pocket (61.8-78.6) region beginning around the 3353 mark. This would be the preferred area for a potential long position for would be bulls and could provide an excellent risk to reward opportunity.
Now a H4 candle close below the 3322 handle would invalidate the current bullish setup and could see gold fall below the 3300 handle.
However, bear in mind the FOMC meeting and Israel-Iran conflict which seems to be entering a crucial phase right about now.
Gold (XAU/USD) Daily Chart, June 17, 2025
Source: TradingView (click to enlarge)
Support
- 3372
- 3353
- 3322
Resistance
- 3400
- 3413
- 3450
GBPUSD Wave Analysis
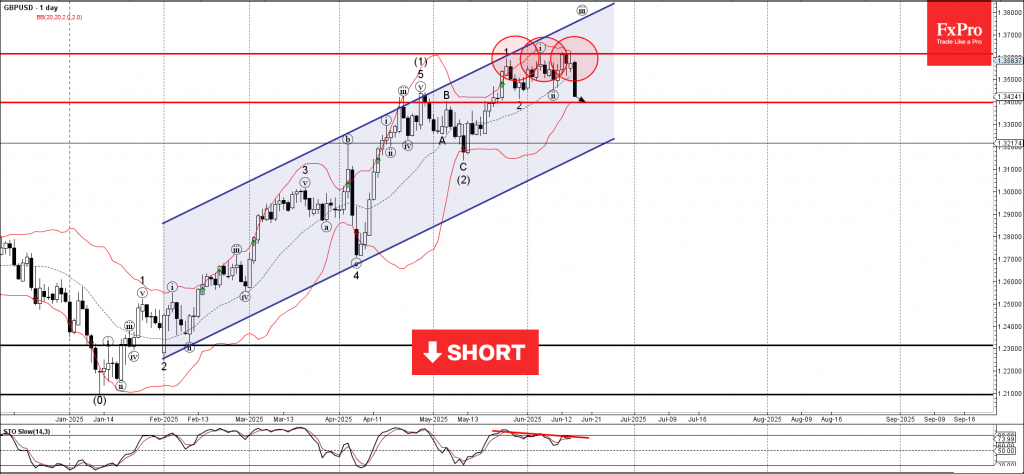
GBPUSD: ⬇️ Sell
- GBPUSD reversed from the resistance level 1.3615
- Likely to fall to support level at 1.3400
GBPUSD currency pair recently reversed down from the key resistance level 1.3615 (which has been reversing the price from the end of May) and the upper daily Bollinger Band.
The downward reversal from the resistance level 1.3615 formed the daily Japanese candlesticks reversal pattern Dark Cloud Cover – which was followed by the Shooting Star.
Given the bearish divergence on the daily Stochastic indicator, GBPUSD currency pair can be expected to fall to the next support level at 1.3400 (former resistance from April).
GBPJPY Wave Analysis
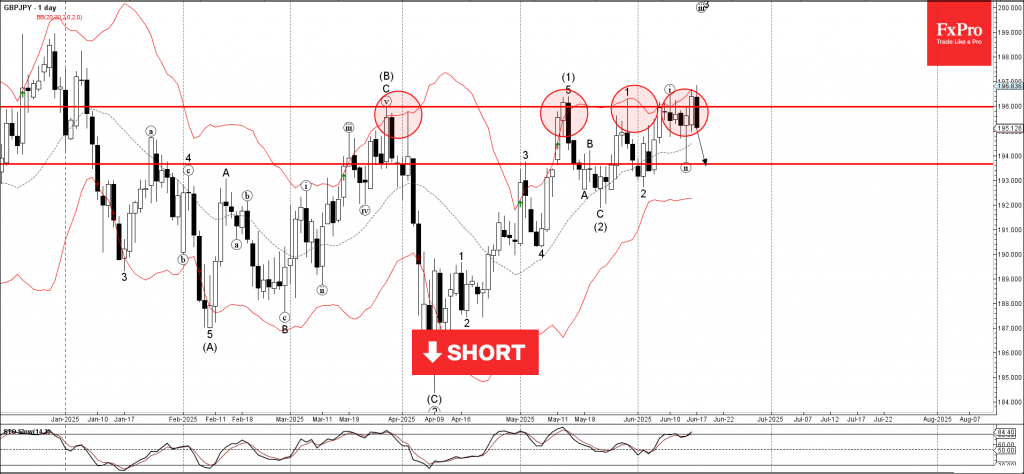
GBPJPY: ⬇️ Sell
- GBPJPY reversed from the resistance area
- Likely to fall to support level 193.65
GBPJPY currency pair recently reversed down from the resistance area between the pivotal resistance level 196.00 (which has been reversing the price from March) and the upper daily Bollinger Band.
The downward reversal from this resistance zone will most likely form the daily Japanese candlesticks reversal pattern Bearish Engulfing – if the price closes today near the current levels.
Given the overbought daily Stochastic, the GBPJPY currency pair can be expected to fall to the next support level at 193.65 (the low of the previous minor correction ii).
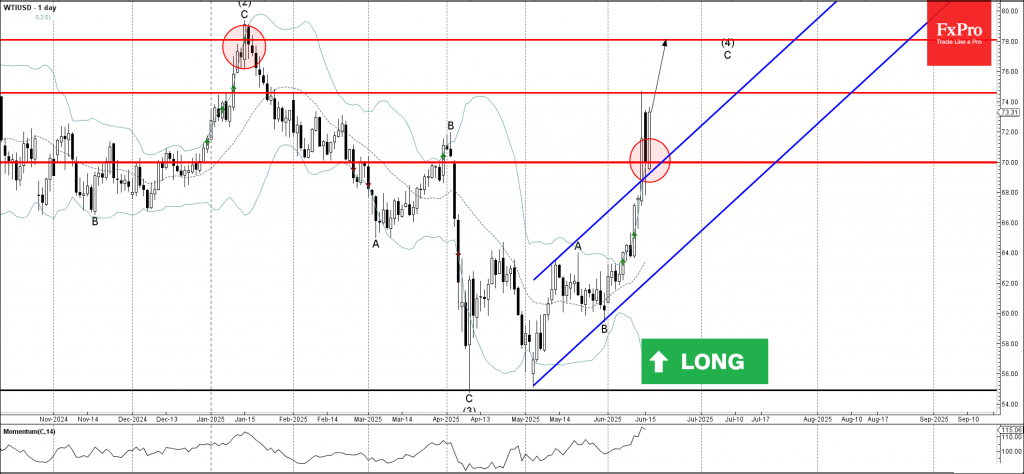
WTI Crude Oil Wave Analysis
WTI crude oil: ⬆️ Buy
- WTI crude oil reversed from round support level 70.00
- Likely to rise to resistance level 78.00
WTI crude oil recently reversed from the round support level 70.00 coinciding with the upper trendline of the recently broken up channel from May.
The downward reversal from the support level 70.00 formed the weekly Japanese candlesticks reversal pattern Bullish Engulfing – which increases the probability WTI will continue to rise in the active impulse wave C.
Given the strength of the active impulse wave C, WTI crude oil can be expected to rise to the next resistance level 78.00 (target for the completion of wave (4), which reversed the price in January).
Sunset Market Commentary
Markets
US headline retail sales dropped for a second consecutive month. May sales fell by 0.9% M/M while consensus expected a more modest contraction of 0.6%. Seven out of thirteen sales categories posted declines. For the likes of building materials (-2.7% M/M), gasoline (-2% M/M) and motor vehicles (-3.5% M/M), it’s a reversal of anticipation buying we’ve seen in March in the run-up to “Liberation Day”. But spending in the only service-sector category (restaurants & bars) also fell and even at the most rapid pace in slightly over two years’ time (-0.9% M/M). The upside of today’s report was that the above-mentioned categories don’t feed into the government’s calculation of goods spending for GDP. The so-called retail sales control group (sporting goods, furniture, apparel,…) showed a stronger-than-expected 0.4% M/M increase in spending in May and with an upward revision to April’s figure (-0.1% M/M from -0.2% M/M). US Treasuries were slightly better bid in the run-up to today’s numbers and spiked higher immediately after the release. The move lacked follow-up buying and even made them change course because of the more constructive underlying numbers. Today’s retail sales were final input for tomorrow’s FOMC meeting and strengthen the US central bank’s firm position of prioritizing (upside) inflation (risks) over (downside) employment/growth (risks), much to the dislike of US President Trump who’ll be firing new shots at “Mr. Late”. As firing Fed Chair Powell ahead of the end of his term (May 2026) is excluded, some rumours suggest a (very early) nomination of his successor who could via the principle of forward guidance potentially influence markets as a “shadow Fed chair”. Daily changes on the US yield curve currently range between -1 bp and -3 bps in a gentle bull flattening move. Intraday volatility in the dollar was smaller than in the Treasury market with EUR/USD a tad softer at 1.1550 compared with 1.1570 ahead of retail sales. The European eco agenda was light with only stronger than hoped German ZEW investor sentiment (June: expectations component 47.5 from 25.2; third best since early 2022). The build-up to fiscal support (first specific initiatives expected June 24) outweighs the lingering trade war. Changes on the German curve are negligible today with a minor outperformance at the very long end. Oil prices (Brent $75/b from $73) and risk sentiment (stock markets down 0.5% to 1%) are effected by lingering uncertainty over the next step in the Israeli-Iranian conflict (diplomacy and nuclear talks? Expanded Israeli air campaigns? Iranian escalation via street of Hormuz? US involvement?)
News & Views
The Swedish National Institute of Economic Research (NIER), a government agency, today published its quarterly economic forecast. NIER downwardly revised its 2025 Swedish growth forecast by 0.8% to 0.9%. The downward revision is partly due to a lower estimate of 2024 growth, but also reflects a significantly worse than expected performance in Q1. Especially gross fixed capital formation fell substantially in Q1, leading to an overall negative forecast for 2025. Household consumption growth (1% from 1.2%) and government consumption was also downwardly revised. Still, the economy is expected to recover in H2. After a period of spending reluctance, households are starting from a position of high savings, and with real disposable incomes rising rapidly, household consumption is expected to be a strong driver of the recovery. Growth for 2026 was slightly reduced to 2.7% from 2.9%. NIER also downwardly revised its CPI and CPIF inflation forecasts for this and next year (CPIF 2025 from 2.4% to 2.5%; 2026 from 1.7% to 1.5%). Part of this revision was due to a stronger krone. NIER expects this to allow the Riksbank (RB) to cut its policy rate to 1.75% still this year. The RB as has a regular policy meeting on Thursday. The majority of the market expects a 25 bps cut to 2%.
The Hungarian Statistical Office reported that full time employees average gross earnings in April were 9.8% higher than in the same month last year (HUF 708 000). Taking into account a 4.2% rise in CPI consumer price inflation in April, real earning were up 5.2%. Net wages at HUF 486 500 were 9.6% higher Y/Y. The rise in gross wages was substantially higher than expected (8.9% Y/Y). Ongoing high (real) wages and its potential impact on services inflation are factors of importance for monetary policy as the MNB still struggles to return inflation within the 3% +/- 1% inflation target band. The MNB recently held the line of communication that a patient and carful approach to monetary policy remains warranted, maintaining tight monetary conditions (policy rate 6.5%).
Bitcoin is Neither a Safe Haven Nor a FOMO Asset
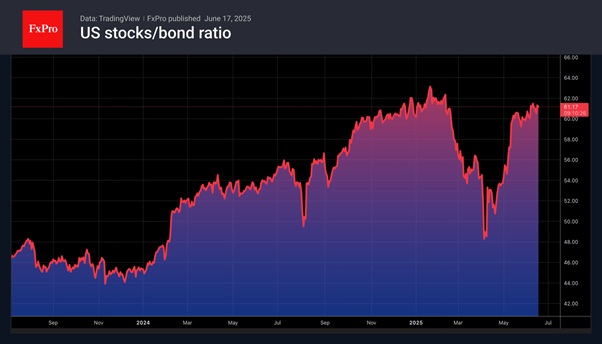
Bitcoin has failed to capitalise on the latest rise in risk appetite in financial markets. The ratio of US stocks to US Treasury bonds has reached its highest level since Donald Trump’s inauguration. The S&P 500 rose on reports that Iran is seeking ways to resume nuclear talks with the United States. Investors believe that the worst of the conflict in the Middle East is behind us and will end soon.
The crypto market leader seems to be stuck between two worlds. It is not responding to the increase in global risk appetite, but it is not growing like safe-haven assets against the backdrop of escalating geopolitical tensions. Bitcoin and gold have a lot in common: their supply is limited in nature, and they cannot be destroyed. Tokens are easier to transfer or hide than precious metals. As a result, digital assets are sometimes used as a safe haven, especially in cases where confidence in fiat currencies is undermined.
It is the weakness of the US dollar in 2025 that is one of the key drivers of the 13% rally in Bitcoin since the beginning of the year. If the USD index continues to fall due to the White House’s tariff policy, Bitcoin will grow.
Meanwhile, Michael Saylor’s Strategy continues to buy up Bitcoin. Another $1 billion has been invested in the cryptocurrency, increasing its reserves to $63.4 billion. Specialised exchange-traded funds are not far behind. The largest ETF, iShares Bitcoin Trust, attracted $12.5 billion in 2025, increasing its reserves to $70 billion. Growing demand from institutional investors is supporting Bitcoin.
Perhaps the markets are overly optimistic about the armed conflict in the Middle East. Israel intends to fight to the bitter end, and the United States is not asking it to stop. As the conflict drags on, global risk appetite will decline, which will be bad news for both US stock indices and Bitcoin. On the contrary, the sooner the mutual attacks between Tehran and Jerusalem come to an end, the higher the chances of a recovery in the coin’s upward trend.