Sample Category Title
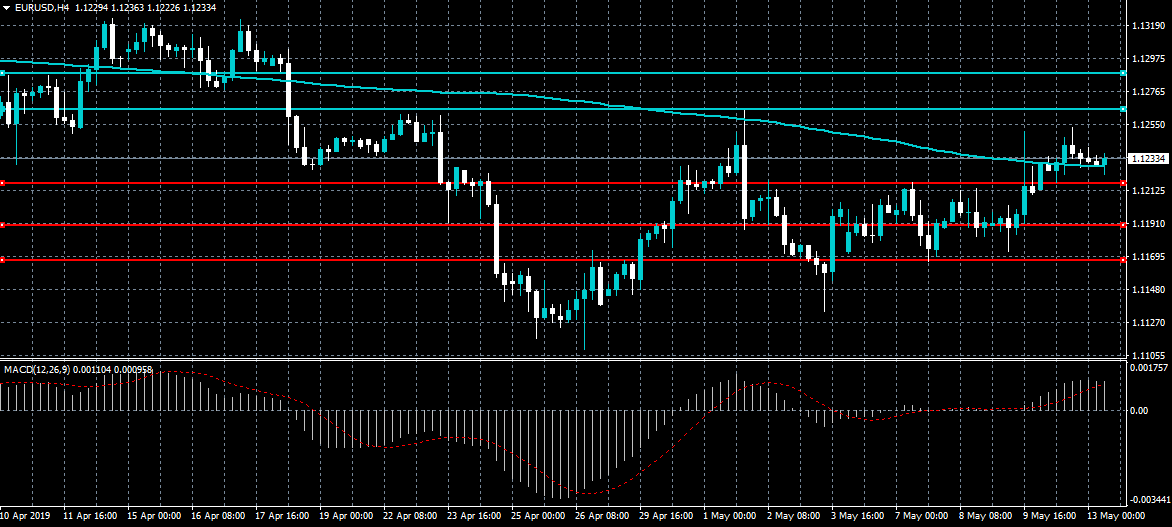
EURUSD 1.1264 Breakout Resistance
The euro continues to build upside pressure against the US dollar on Monday, with buyers still in full control of the pair over the short-term. EURUSD bulls now need to break through the 1.1264 level in order to encourage technical buying towards the 1.1290 level. Overall, the 1.1360 level offers the strongest form of weekly resistance, while the 1.1164 level is breakout weekly support.
The EURUSD pair is strongly bullish while trading above the 1.1230 level, key technical resistance is found at the 1.1264 and 1.1290 levels.
If the EURUSD pair moves below the 1.1230 level, key technical support is found at the 1.1216 and 1.1190 levels.
The US And China Have Not Reached Agreement
On Friday, the US dollar fell slightly against a basket of major currencies. The dollar index (#DX) closed in the negative zone (-0.04%). Last week, May 9-10, the 11th round of talks between the US and China on trade disputes took place, which ended without signing an agreement. Donald Trump increased duties on Chinese imports from 10% to 25% $200 billion worth. Vice Premier of the People's Republic of China, Liu He, announced that China did not intend to cede to the United States. He also said that in response to the raising tariffs from the US, China would take corresponding measures. US President, Donald Trump, believes that the introduction of duties on Chinese goods is fair, and he does not intend to make changes to the current state of affairs. "We are right where we want to be with China," D. Trump said on Twitter. The President explained: "Remember, they broke the deal with us & tried to renegotiate. We will be taking in Tens of Billions of Dollars in Tariffs from China."
On Friday, economic data were also published in the UK, US and Canada. Thus, the UK GDP (q/q) rose by 0.5%, as experts expected. The US core consumer price index slowed down to 0.1% (m/m) in April, which was below market expectations of 0.2%. The number of jobs in Canada increased by as much as 106.5K in April, although investors expected growth by only 10.0K. At the same time, the unemployment rate fell to 5.7% from 5.8%.
The "black gold" prices are consolidating. At the moment, futures for the WTI crude oil are testing the mark of $61.90 per barrel.
Market Indicators
- On Friday, the bullish sentiment was observed in the US stock market: #SPY (+0.50%), #DIA (+0.57%), #QQQ (+0.12%).
- The 10-year US government bonds yield is at 2.42-2.43%.
The news feed on 2019.05.13:
- Today, the publication of important news is not expected. We recommend paying attention to speeches by the FOMC representatives.
EUR/NZD Is Looking For X Cross Breakout
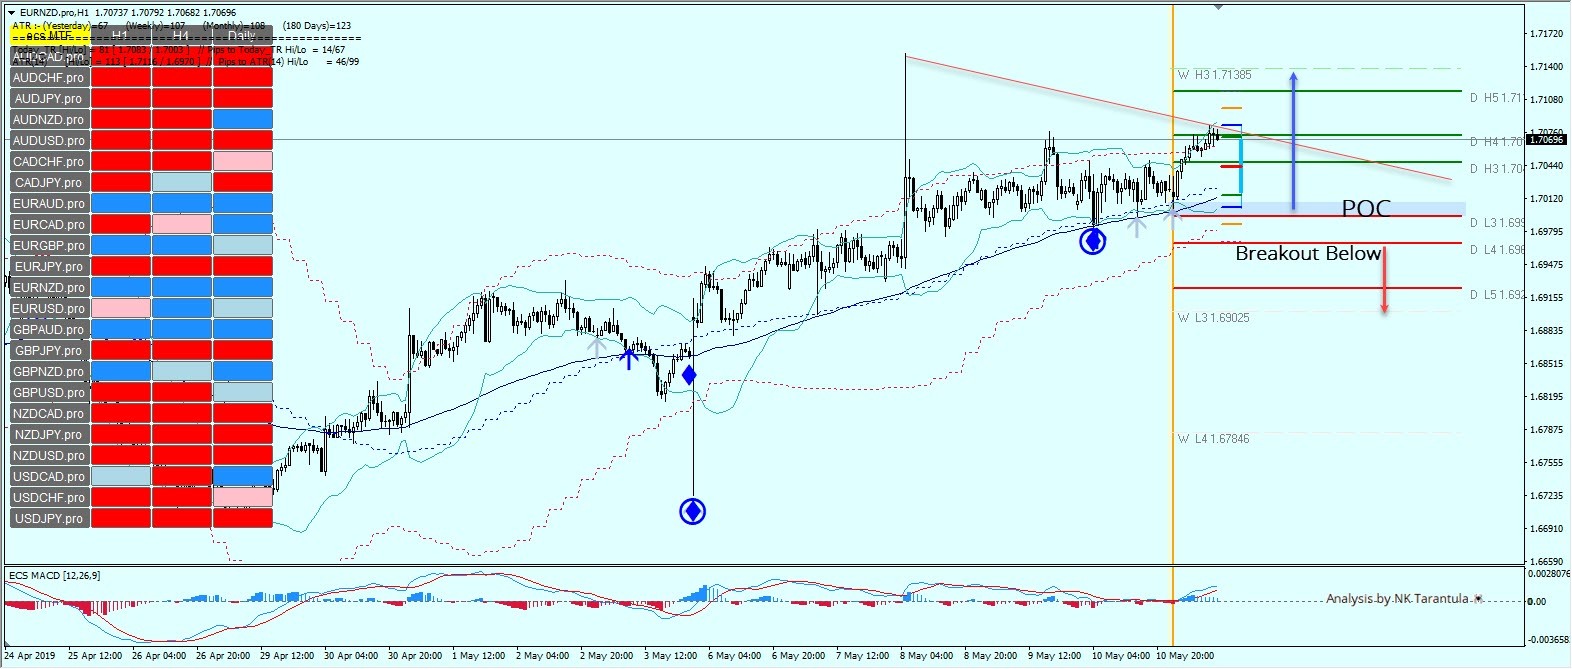
The EUR/NZD has formed a bullish X cross exactly at 1.7070. We will see a breakout if the price breaks and closes above it.
X-Cross is a cross of the trend line and important pivot point. In this case we see a red trend line and D H4 camarilla pivot. A break of the X Cross suggests more bullish price action towards 1.7110 and 1.7138. However, traders should also watch for the POC zone 1.6994 – 1.7010 as the price might also bounce from that zone. If we see the break of 1.6970, then a deeper retracement should happen towards 1.6902, which is a weekly L3 camarilla pivot.
EUR/AUD 4H Chart: Remains Near 1.6127
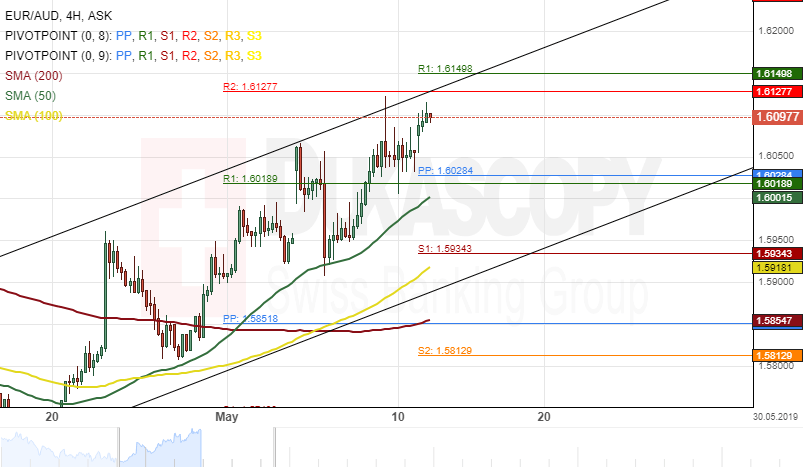
During last week's trading sessions, the single European currency appreciated about 1.34% in value against the Australian Dollar. The 50-hour simple moving average guided the currency pair upward.
Currently, the exchange rate is trading near the upper boundary of an ascending channel pattern at 1.6103 and could be set for a breakout.
If this breakout occurs, a surge towards a swing high of 1.6372 could be expected within this week's trading session.
Although, a resistance cluster formed by the combination of the weekly and the monthly pivot points at 1.6149 could hinder such movement.
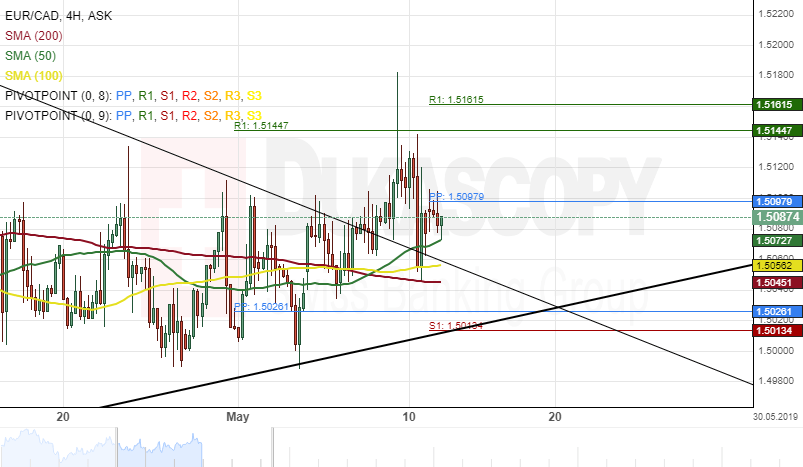
EUR/CAD 4H Chart: Supported By SMAs
The common European currency appreciated about 107 base points against the Canadian Dollar during last week's trading session. The exchange rate tested a resistance cluster formed by the combination of the weekly and the monthly pivot points at 1.5161 on Friday.
The 50-, 100– and 200-hour SMAs are currently providing support for the currency pair at 1.5052.
If the support cluster holds, bullish traders could push the currency exchange rate towards a psychological resistance level at 1.5200.
However, if the pair passes the cluster as mentioned earlier, a decline towards the 1.4949 regions could be expected.
Markets, Gold, Oil
Markets back in the red as tariffs increased
European markets are mostly lower at the start of the week and the US is expected to open even deeper in the red after talks between the US and China broke down and tariffs were increased.
The talks appeared to be going quite smoothly until a week ago when the cracks started to appear, since when markets have given up a chunk of their first quarter gains. There is still some hope that a deal can be reached, with a possible meeting at next month’s G20 being touted between Trump and Xi in an attempt to break the impasse.
It will now be interesting to see just how much conviction there is in the first quarter rebound, with the prospect of a Sino-US deal a big contributor to the improved sentiment in the markets. Of course, there were other important factors as well and central banks have made a significant effort to alleviate those concerns but trade tariffs are a major concern at a time when global growth is already expected to slow.
Gold failing to capitalize on risk averse markets
It’s interesting to see that gold is struggling to break back above $1,290 at the start of the week, despite the risk aversion we’re seeing in the markets and the softer dollar. Gold is a traditional safe haven and often performs well when the greenback is weaker. The fact that it’s struggling to make any real strides to the upside may be a real concern for gold bulls and suggest the downtrend since the middle of February may not have passed.
The important level to the downside remains $1,265, where gold has run into support on a couple of occasions over the last month. It’s not yet clear that we’ll see a test of this in the near term, with gold continuing to hold around the recent highs but the inability to capitalize on otherwise risk averse markets and a softer dollar is not an encouraging signal.
Oil rises as tensions flare in the Gulf
Oil prices are more than 1% higher on Monday, getting the week off to a positive start even as risk aversion drags equity markets lower. The risks to global growth of a trade war between the US and China would typically have been a bearish development for oil prices but reports of vessel sabotage in the Gulf appears to be supporting prices.
The increase in tensions in the region as the US proceeds with efforts to reduce Iranian exports to zero and crush the economy is a risk for oil markets and could see prices rise further if these flare ups continue. As it is, we remain a little off the recent highs and today’s gains are likely being limited by the overall risk environment but that could all change very quickly.
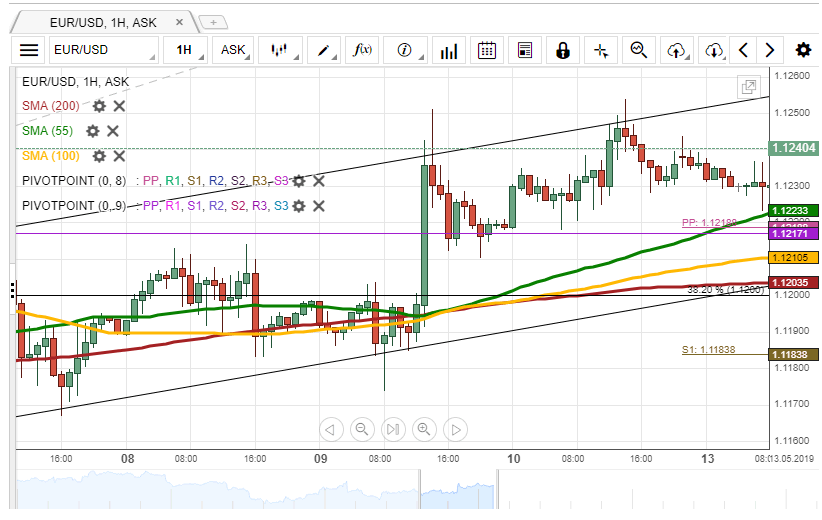
EUR/USD Unlikely To Decline
At the end of last week, the EUR/USD currency pair tested the upper boundary of the short-term ascending channel at 1.1250 and reversed south.
From a theoretical point of view, the pair should target the lower channel line located in the 1.1200/1.1220 range. However, note, that the exchange rate has to surpass the support cluster formed by a combination of the 55-, 100– and 200-hour SMAs, as well the weekly and monthly PPs in the 1.1203/1.1223 range.
If the given support holds, it is expected, that the rate could trade sideways around the psychological level at 1.1240. If bulls prevail in the market, it is likely, that the pair could reach the 1.1250 level.
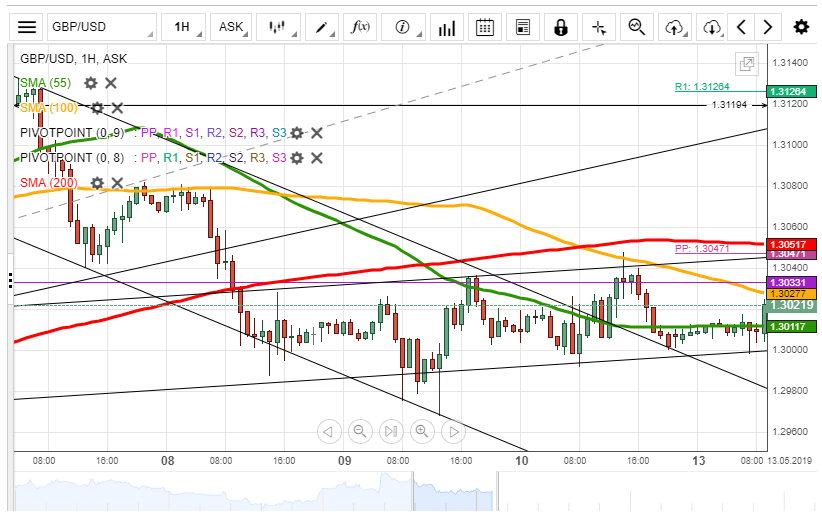
GBP/USD Might Trade Down
On Friday, the GBP/USD exchange rate traded sideways around the 1.3040 mark within the short-term ascending channel.
Given that the rate is pressured by the 100-hour SMA and monthly PP at 1.3033, it is likely, that some downside potential could prevail in the market. The currency pair could decline to the 1.2980 level.
However, if the given channel holds, it is expected, that the pair could rise to its upper line located circa 1.3050. It is unlikely, that a breakout north could occur due to the resistance level formed by the 200-hour SMA and the weekly PP at 1.3047.
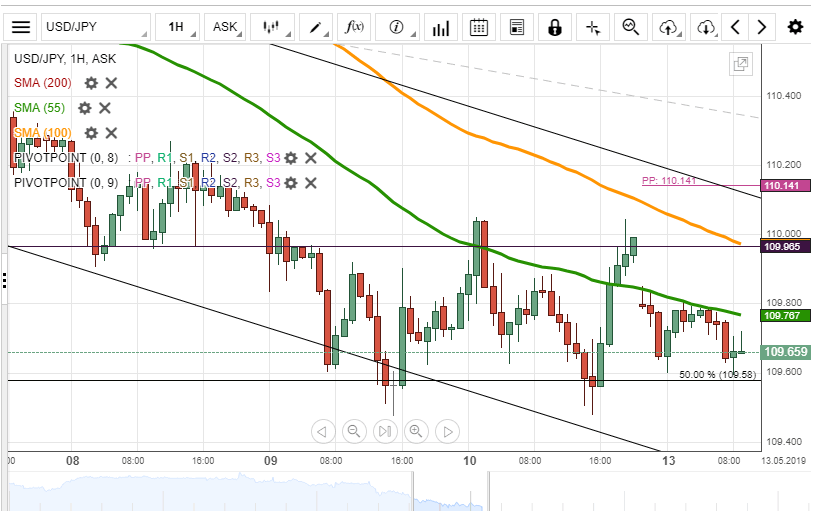
USD/JPY Could Decline To Weekly S1
During the previous trading session, the USD/JPY currency pair traded sideways between the Fibonacci 50.00% retracement at 109.58 and the monthly S2 at 109.97.
Given that the pair is pressured by the 55-hour SMA, currently located at 109.77, it is expected, that bears could prevail in the market. A possible downside target is the weekly S1 at 109.32.
If the given Fibonacci retracement holds, it is likely, that the exchange rate could continue to trade sideways. Also, it is unlikely, that some upside potential prevails due to the resistance of 100-hour SMA at 110.00.
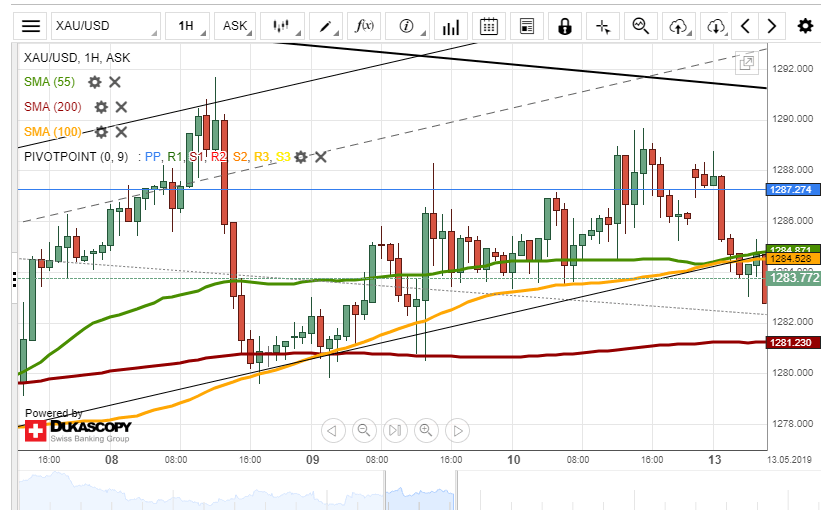
XAU/USD Squeezed By Moving Average
On Friday, the XAU/USD exchange rate tried to reach the upper boundary of the falling wedge pattern located circa 1,290.00.
During Monday's morning, the rate was squeezed by the 55-, 100– and 200-hour SMAs, located at 1,284.50 and 1,281.23 respectively, thus, it is likely, that gold could trade sideways between the given moving averages.
Otherwise, it is expected, that bulls would prevail in the market, and the price for gold could rise to the resistance level formed by monthly PP at the 1,287.27 mark.