

Sample Category Title
Canada’s Gross Domestic Product Unexpectedly Fell In February
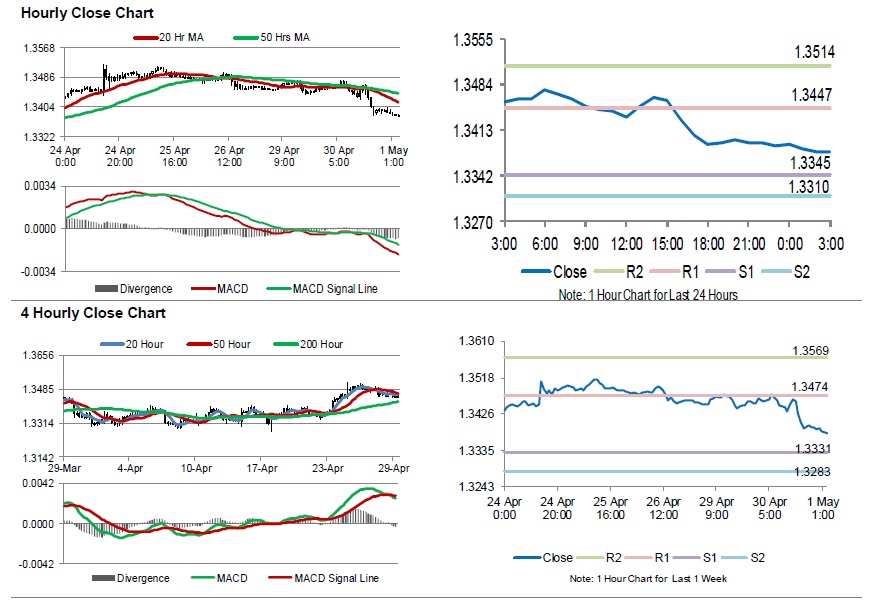
For the 24 hours to 23:00 GMT, the USD declined 0.48% against the CAD and closed at 1.3389.
On the macro front, Canada’s gross domestic product (GDP) unexpectedly declined 0.1% on a monthly basis in February, defying market anticipations for an unchanged reading. In the preceding month, the GDP had recorded a gain of 0.3%.
In the Asian session, at GMT0300, the pair is trading at 1.3379, with the USD trading 0.07% lower against the CAD from yesterday’s close.
The pair is expected to find support at 1.3345, and a fall through could take it to the next support level of 1.3310. The pair is expected to find its first resistance at 1.3447, and a rise through could take it to the next resistance level of 1.3514.
Trading trend in the Loonie today, is expected to be determined by Canada’s MLI leading indicator for March and the RBC manufacturing PMI for April, slated to release later in the day.
The currency pair is trading below its 20 Hr and 50 Hr moving averages.
Australia’s AIG Performance Of Manufacturing Index Rose In April, While The CBA Manufacturing PMI Eased In The Same Month
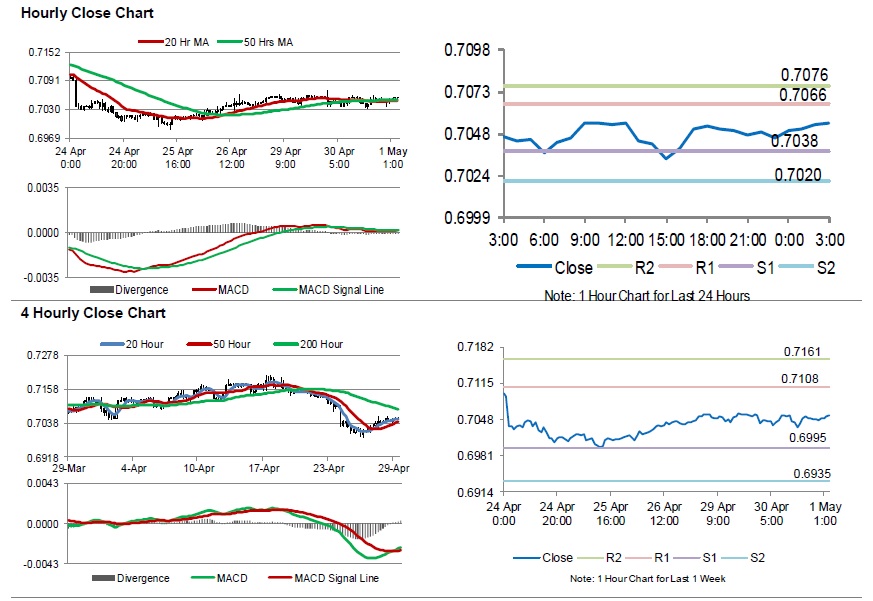
For the 24 hours to 23:00 GMT, the AUD declined 0.16% against the USD and closed at 0.7046.
LME Copper prices rose 1.0% or $66.0/MT to $6442.0/MT. Aluminium prices declined 0.4% or $7.0/MT to $1809.0/MT.
In the Asian session, at GMT0300, the pair is trading at 0.7055, with the AUD trading 0.13% higher against the USD from yesterday's close.
Overnight data revealed that Australia's AIG performance of manufacturing index jumped to a level of 54.8 in April, compared to a level of 51.0 in the previous month. Meanwhile, the nation's CBA manufacturing PMI unexpectedly dropped to a level of 50.9 in April, defying market anticipations for an unchanged reading. In the prior month, the PMI had recorded a reading of 51.0.
The pair is expected to find support at 0.7038, and a fall through could take it to the next support level of 0.7020. The pair is expected to find its first resistance at 0.7066, and a rise through could take it to the next resistance level of 0.7076.
The currency pair is showing convergence with its 20 Hr and 50 Hr moving averages.
Gold: Yellow Metal Reverses Its Gains In The Morning Session
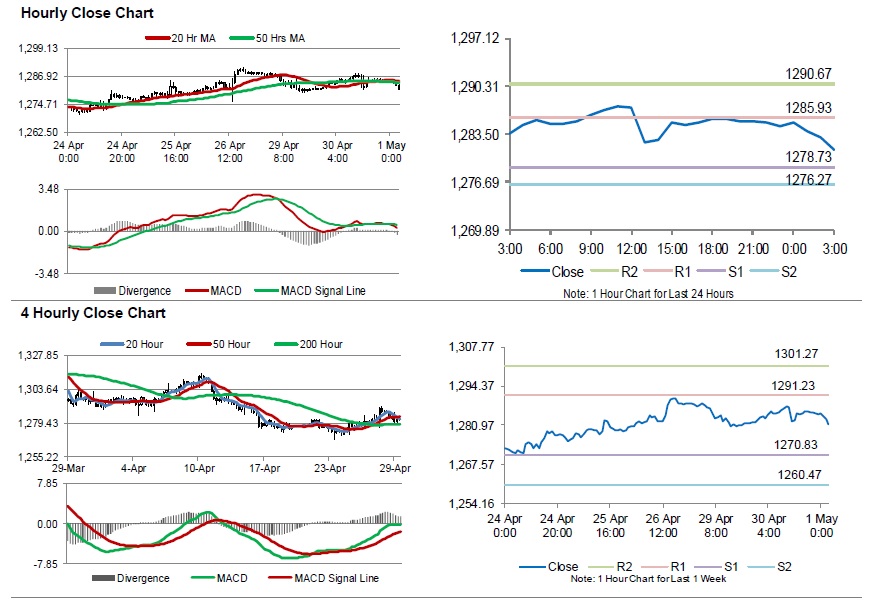
For the 24 hours to 23:00 GMT, Gold rose 0.23% against the USD and closed at USD1285.10 per ounce, amid weakness in the greenback.
In the Asian session, at GMT0300, the pair is trading at 1281.20, with gold trading 0.30% lower against the USD from yesterday’s close.
The pair is expected to find support at 1278.73, and a fall through could take it to the next support level of 1276.27. The pair is expected to find its first resistance at 1285.93, and a rise through could take it to the next resistance level of 1290.67.
The yellow metal is trading below its 20 Hr and 50 Hr moving averages.
Silver: White Metal Trading On A Weaker Footing In The Asian Session
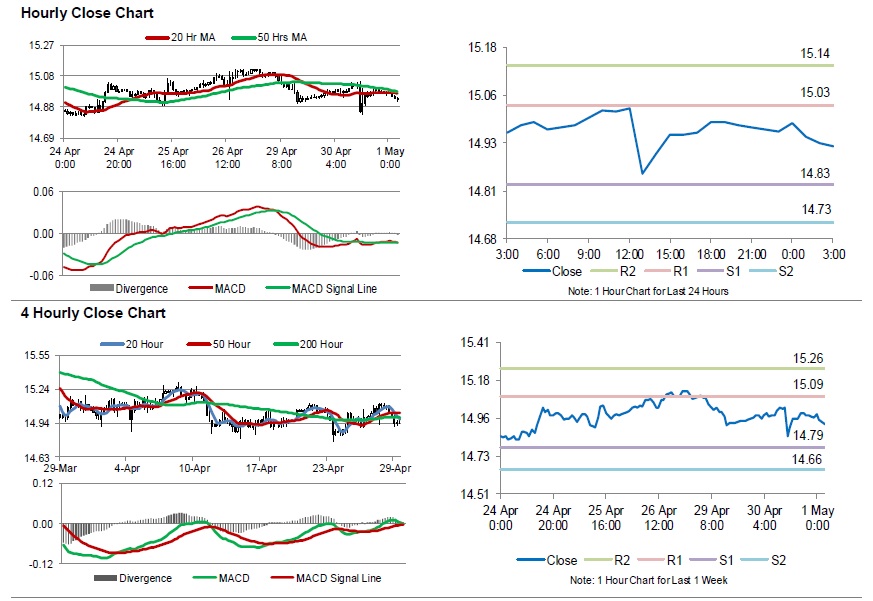
For the 24 hours to 23:00 GMT, Silver rose 0.07% against the USD and closed at USD14.97 per ounce, tracking gains in gold prices.
In the Asian session, at GMT0300, the pair is trading at 14.93, with silver trading 0.27% lower against the USD from yesterday’s close.
The pair is expected to find support at 14.83, and a fall through could take it to the next support level of 14.73. The pair is expected to find its first resistance at 15.03, and a rise through could take it to the next resistance level of 15.14.
The white metal is trading below its 20 Hr and 50 Hr moving averages.
Australia AiG PMI improved to 54.8, but employment and wage indices dropped
Australia AiG Performance of Manufacturing Index rose 3.8 pts to 54.8 in April, indicating faster growth. All subsectors except machinery & equipment, and metal products improved. Top concerns for manufacturers in April included the upcoming Federal election, high energy prices, high input costs (due to drought, a low dollar and high commodity prices) and tighter credit conditions.
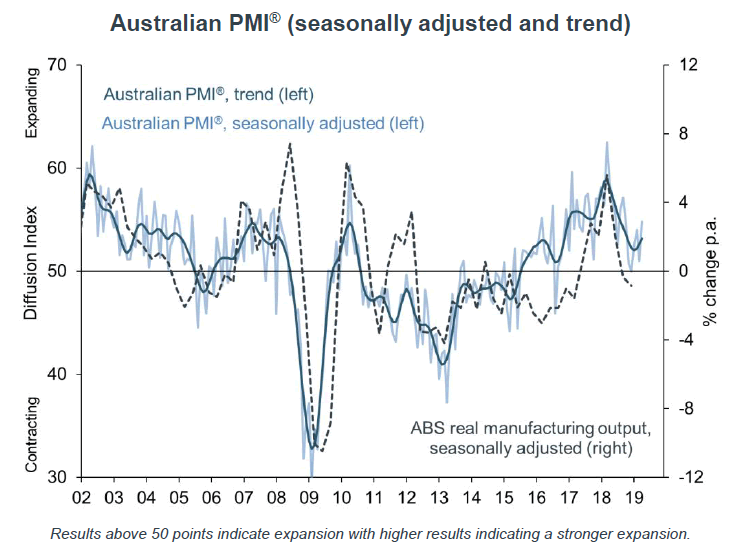
Employment index dropped sharply by -5.1 pts to 51.5. The release also noted ABS data indicated that total manufacturing employment fell dramatically over summer, with a reduction in employment of 41,600 over the three months to February 2019 (-6.3% q/q, trend). Average wage index dropped -3.5 to 57.7, indicating lower wage pressures across the manufacturing sector. Also, this wage index has been trending down since peaking at September 2018.
Crude Oil: Oil Trading Lower, Ahead Of EIA’s Weekly Crude Oil Stockpiles Data
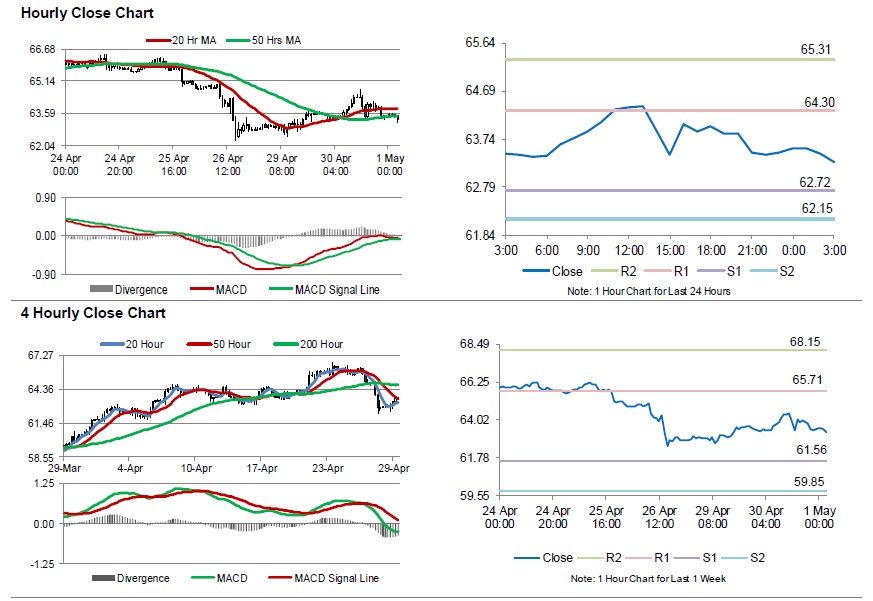
For the 24 hours to 23:00 GMT, Crude Oil declined 0.11% against the USD and closed at USD63.47 per barrel, amid ease in fears over political turmoil in Venezuela. Additionally, the American Petroleum Institute (API) reported that US crude oil inventories climbed by 6.8 million barrels to 466.4 million barrels for the week ended 26 April 2019.
In the Asian session, at GMT0300, the pair is trading at 63.28, with oil trading 0.30% lower against the USD from yesterday's close.
The pair is expected to find support at 62.72, and a fall through could take it to the next support level of 62.15. The pair is expected to find its first resistance at 64.30, and a rise through could take it to the next resistance level of 65.31.
Going ahead, investors will keep a close watch on the weekly crude inventories data from the Energy Information Administration (EIA), due later in the day.
Crude oil is trading below its 20 Hr moving average and showing convergence with its 50 Hr moving average.
NZ Labour Market Review: Waiting On Wage Growth
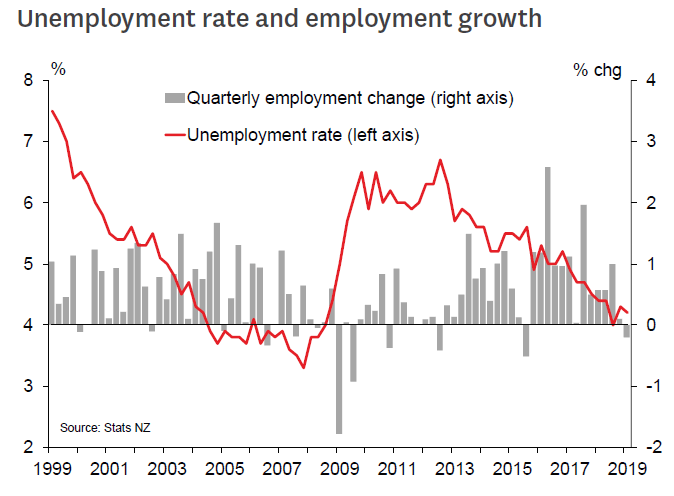
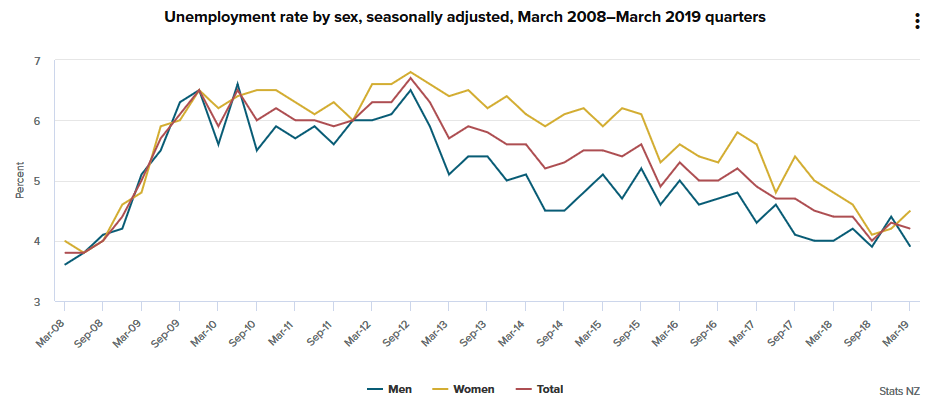
- The unemployment rate fell to 4.2% in the March quarter, beating market forecasts.
- However, jobs growth has slowed over the last year or so, in line with the slowdown in GDP growth.
- Wage growth has not picked up to the extent that we would expect in a tight labour market.
- Today’s results give no clear guidance to the Reserve Bank ahead of next week’s Monetary Policy Statement.
The New Zealand labour market surveys for the March quarter were a distinctly mixed bag. The rate of unemployment fell slightly, beating market expectations of a flat result. But jobs growth has slowed over the last year or so, and wage pressures have been surprisingly slow to emerge.
On balance, the surveys don’t provide a clear steer for the Reserve Bank as it prepares next week’s Monetary Policy Statement. The RBNZ previously judged that the economy was operating around ‘maximum sustainable employment’, and today’s results won’t change that assessment. However, the muted starting point for wage growth and the slowing momentum in employment raise questions about the extent to which inflation will pick up in the coming years.
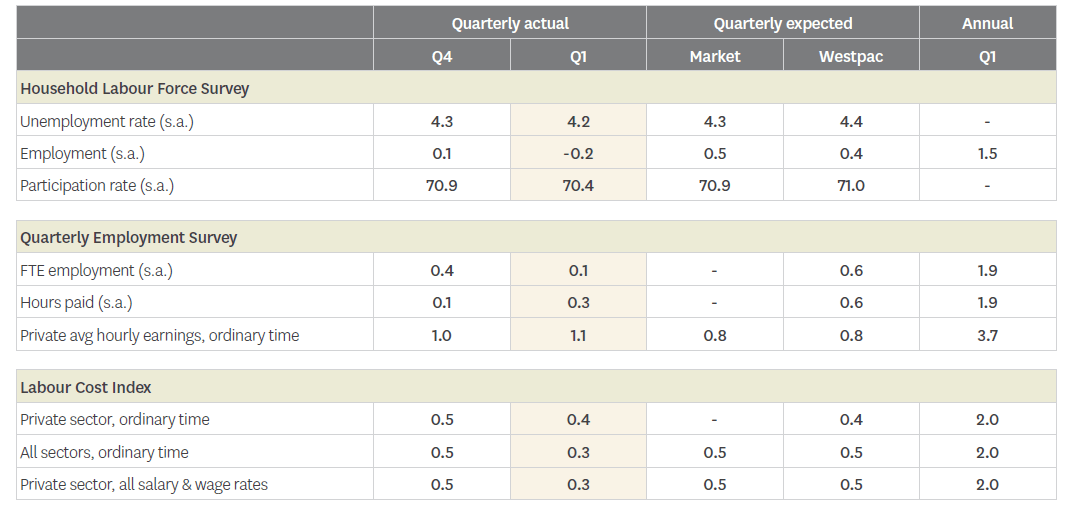
The Household Labour Force Survey (HLFS) provided conflicting signals on the face of it, with a fall in the unemployment rate to 4.2%, but also a 0.2% drop in employment. We usually regard the unemployment rate as the more reliable measure, given the known volatility in employment. In that regard, the fact that unemployment has continued to trend lower is a more positive result than we expected.
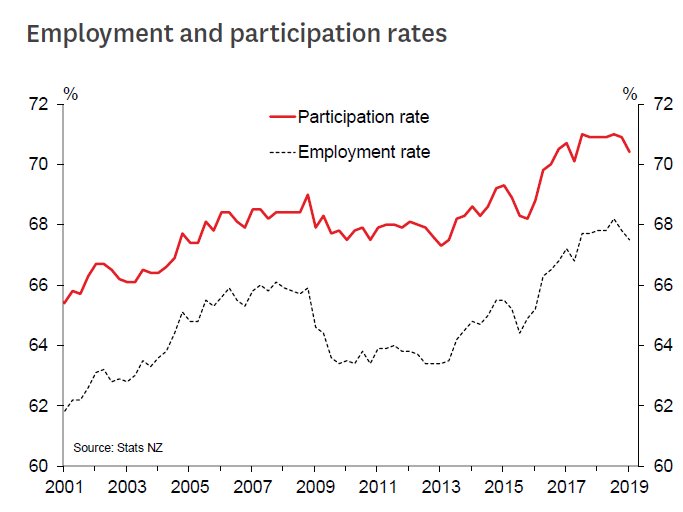
In contrast, we think that the fall in employment in the HLFS overplays the extent of weakness. Large or unusual movements in employment often come with matching changes in the labour force participation rate, as was the case this time – participation fell from 70.9% to 70.4%. And a closer look suggests that the declines were quite narrowly focused. Full-time employment saw a solid 0.8% rise, while part-time employment plunged by 3.3%. Meanwhile, the fall in participation appears to have been concentrated in the over-50 age groups. Put together, these suggest that the survey may have captured an unusually high number of retirees this time.
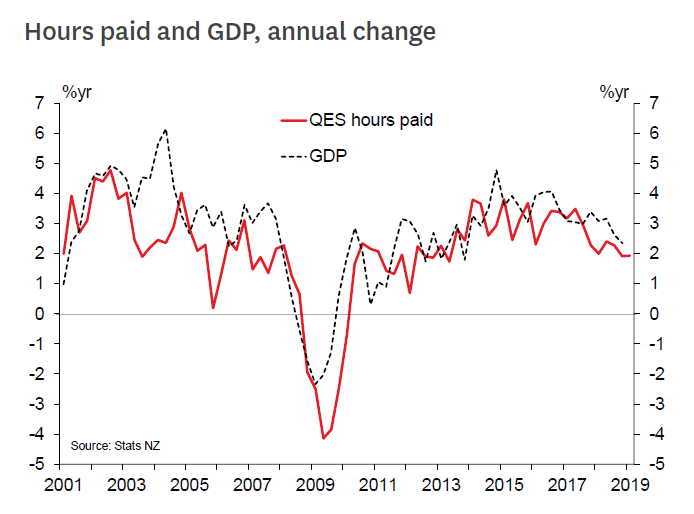
Nevertheless, there is clear evidence that the pace of jobs growth has slowed in the last year or so. The Quarterly Employment Survey (QES) recorded just a 0.1% rise in full-time equivalent jobs, and a 0.3% rise in hours paid. Annual growth has dropped below 2% for both measures. The slowdown in the QES measures corresponds with the slowdown in GDP growth over the last year or so, and today’s results point to the likelihood of another subdued GDP outturn in the March quarter (our current forecast is 0.5% growth).
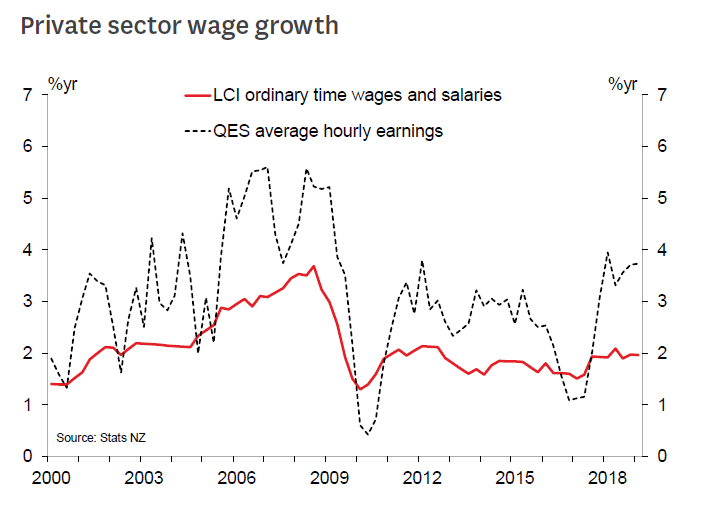
The measures of wage growth were similarly mixed. The Labour Cost Index (LCI) rose by 0.4% overall, in line with our forecast, but the private sector component was surprisingly soft. Other wage measures weren’t quite as subdued. The unadjusted LCI, which includes pay rises based on experience or promotions, ticked up slightly to 3.4% growth on an annual basis. The QES measure of average hourly earnings was stronger than we expected, with annual growth ticking up to 3.7%.
It’s not the case that wages haven’t picked up in recent years – even the LCI, a slow-moving beast by design, has accelerated to dome degree. But with an unemployment rate as low as 4.2%, and with widespread anecdotes that firms are finding it hard to attract workers, it’s surprising that wage growth hasn’t been able to take another leg higher in the last year or so.
We still expect a more substantial lift in wage growth over the rest of this year, but much of that will be driven by the Government in some form. The June quarter will include a 7.3% increase in the minimum wage, the biggest increase in 12 years. And at some point, public sector pay settlements (e.g. primary school teachers) will provide a boost.
But a sustained lift in wage growth will depend on the strength of the economy. In the mid-2000s, rapid GDP growth saw the unemployment rate drop below 4%, which was followed by a substantial lift in wage growth (even after adjusting for inflation). That sort of momentum has been lacking this time around.
New Zealand employment dropped -0.2% qoq in Q1, NZD dips
New Zealand Dollar drops notably today after weaker than expected job data. Employment contracted -0.2% qoq in Q1, below expectation of 0.5% qoq growth. Unemployment rate dropped to 4.2%, down from 4.3% and matched expectations. But labor force participation rate dropped -0.5% to 70.4%. Labor cost index rose 0.3% qoq, below expectation of 0.5% qoq.
Today's data shouldn't change RBNZ's view that New Zealand is current staying at maximum sustainable employment. The reduced momentum in job growth and sluggish wage would provide little support to the already low inflation reading. Weak CPI is a key factor around the case of RBNZ rate cut in near term, probably in May, but the meeting remains live.
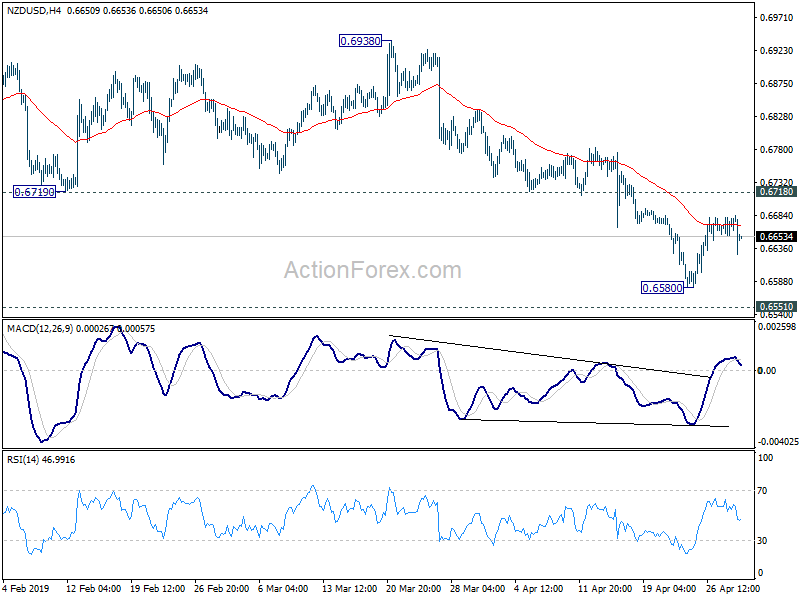
While NZD/USD dipped notably today, it's staying in range above 0.6580 temporary low. More sideway trading remains in favor. But upside should be limited by 0.6718 resistance. Break of 0.6580 will target 0.6551 support next.
China to open up banking and insurance sectors as new round of trade negotiation with US starts
New round of US-China trade negotiations started in Beijing today. US Treasury Secretary Steven Mnuchin said he had a "nice working dinner" yesterday and "it's good to be back here" in Beijing. It widely known that while progress has been made two key sticky points remained unresolved, an enforcement mechanism and the timelines for lifting imposed additional tariffs.
Meanwhile, China Banking and Insurance Regulatory Commission said it will further open up the banking an insurance sectors. And it plans to issue 12 new measures soon. The measures include dropping the USD 10B asset requirements for foreign companies to set up a legal entity in the country. The USD 20B asset requirements for foreign banks to set up a branch will also be removed. Approval procedures for foreign banks to conduct Yuan businesses will be removed.
EUR/USD And USD/CHF: US Dollar Correcting Gains
EUR/USD started a strong recovery after testing the 1.1115 support area. USD/CHF is currently correcting lower and it could extend losses towards 1.0160 or 1.0140.
Important Takeaways for EUR/USD and USD/CHF
- The Euro found support above 1.1100 and recently recovered higher against the US Dollar.
- There is a connecting bullish trend line forming with support at 1.1210 on the hourly chart of EUR/USD.
- USD/CHF struggled to clear the 1.0225 resistance area and recently corrected lower.
- There is a major bearish trend line formed with resistance near 1.0200 on the hourly chart.
EUR/USD Technical Analysis
The Euro declined heavily this past week below the 1.1200 and 1.1150 support levels against the US Dollar. The EUR/USD pair traded towards the 1.1100 level and formed a new swing low at 1.1111 on FXOpen.
The pair formed a decent support base above the 1.1100 level and recently recovered higher. It climbed above the 1.1150 resistance level and settled above the 50 hourly simple moving average.
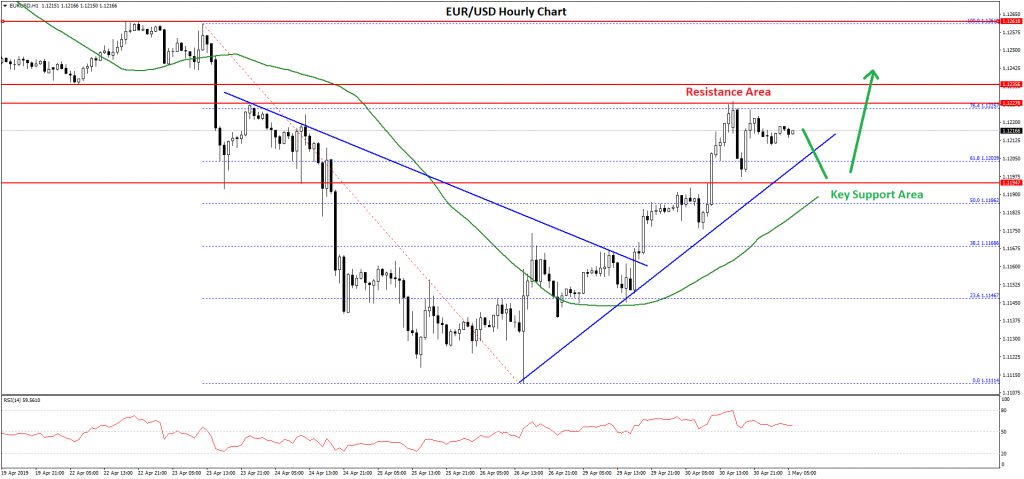
Besides, there was a break above the 61.8% Fib retracement level of the last decline from the 1.1261 high to 1.1111 low. The pair is now trading nicely above the 1.1200 support level, with a positive angle.
At the moment, the price is facing hurdles near the 1.1225 level and the 76.4% Fib retracement level of the last decline from the 1.1261 high to 1.1111 low. If there is an upside break above the 1.1225 level, the pair could continue higher towards 1.1250 or even 1.1260.
On the downside, there are many supports near the 1.1210 and 1.1200 levels. There is also a connecting bullish trend line forming with support at 1.1210 on the hourly chart of EUR/USD.
Therefore, if there is a downside correction, the bulls could protect the 1.1200 support level. The next key support is near the 1.1190 level and the 50 hourly simple moving average. Only a close below the 1.1175 support level might push EUR/USD back in a bearish zone.
USD/CHF Technical Analysis
The US Dollar climbed significantly above the 1.0150 level against the Swiss franc. The USD/CHF pair even broke the 1.0200 resistance level and tested the 1.0235 level.
However, it seems like the pair struggled to gain momentum above the 1.0225 and 1.0230 levels. As a result, there was a downside reaction below the 1.0200 support level and the 50 hourly simple moving average.
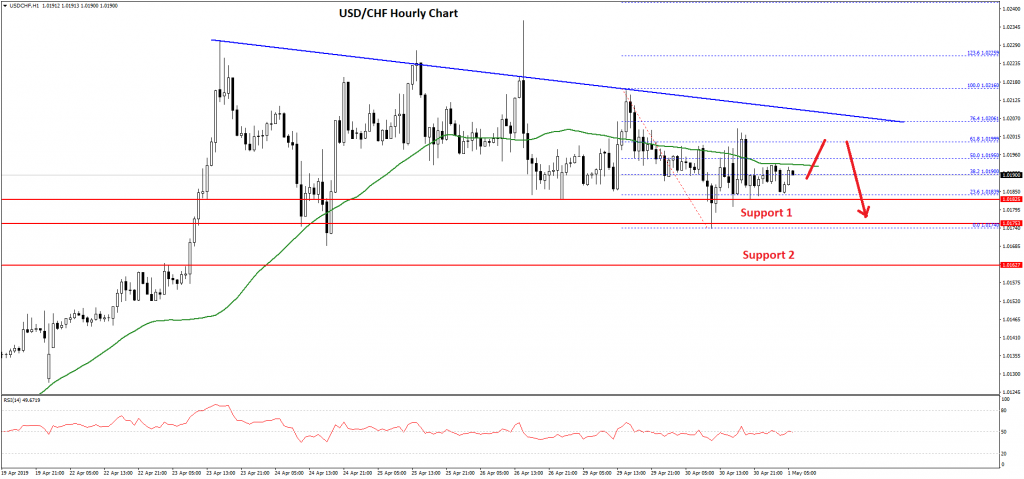
The pair even broke the 1.0180 level and tested the 1.0175 level. It recovered recently above the 1.0190 level and the 50% Fib retracement level of the recent drop from the 1.0216 high to 1.0175 low.
However, the 1.0200 resistance area prevented gains along with the 61.8% Fib retracement level of the recent drop from the 1.0216 high to 1.0175 low. There is also a major bearish trend line formed with resistance near 1.0200 on the hourly chart.
Therefore, the pair is likely to face a strong resistance near the 1.0200 level. In the short term, there are chances of more downsides below the 1.0180 and 1.0175 support levels.
The next key support for USD/CHF is near the 1.0160 level, where buyers might appear and protected additional losses. Any further losses will most likely push the pair towards 1.0140.