Sample Category Title
WTI Oil Futures Reach 4-Month High, Strongly Positive In Short Term
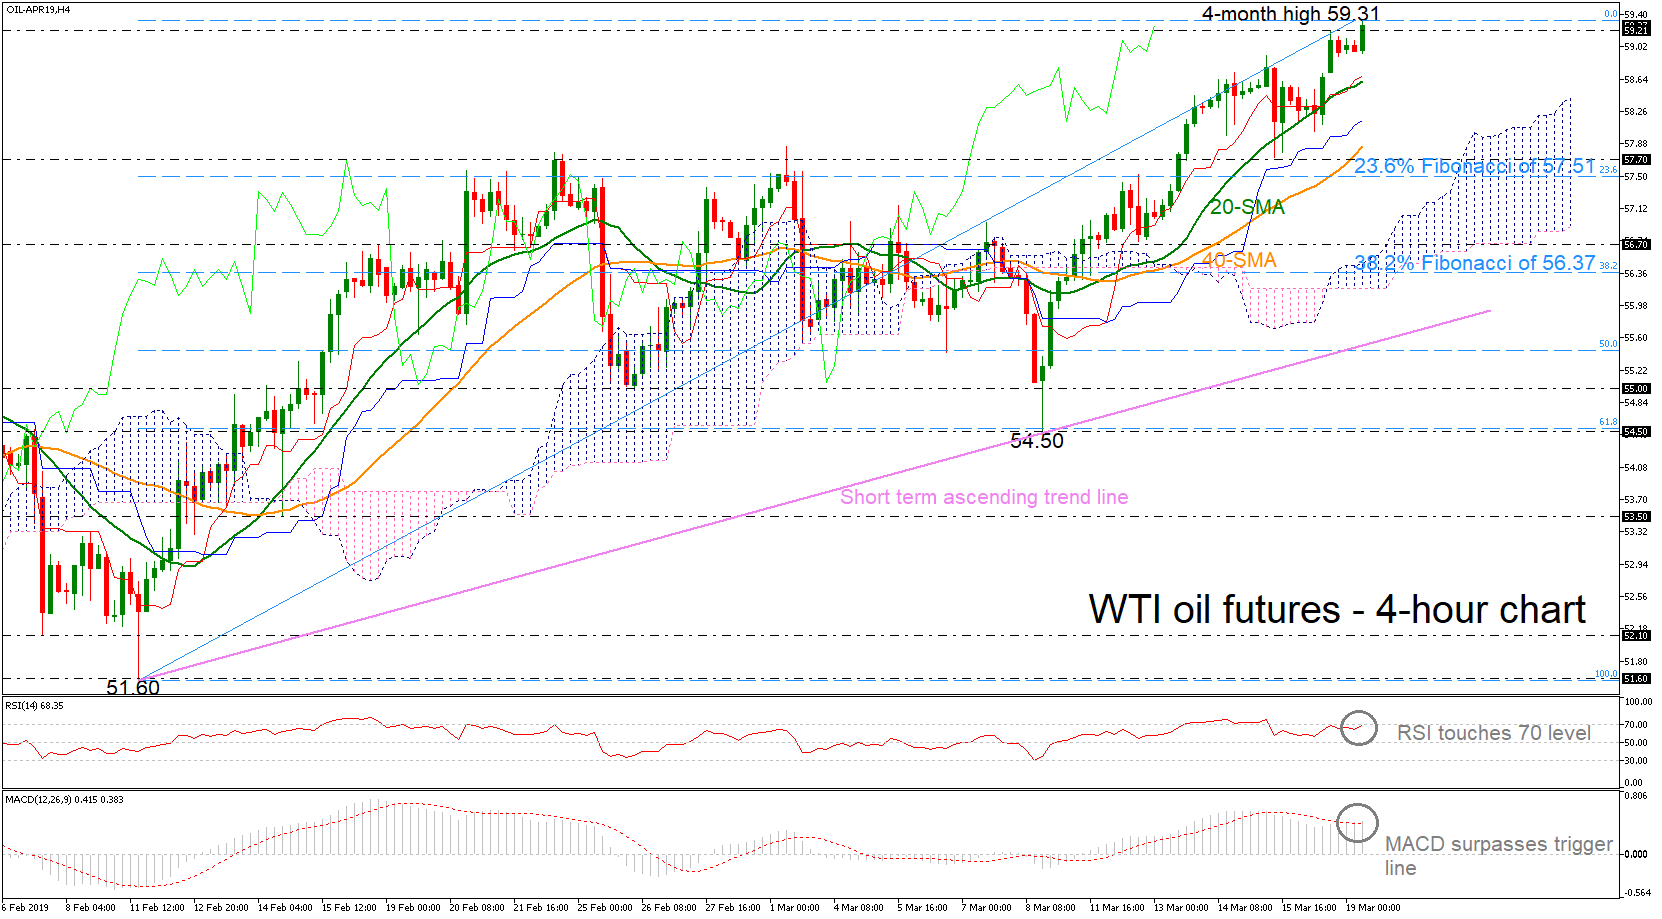
WTI crude oil futures have been in a flying mode since yesterday’s trading session, recording a new four-month high around 59.32 today. The price is set to touch overbought levels according to the RSI indicator which is holding a shy below the 70 level, while the MACD is ready to post a bullish crossover with its trigger line in the 4-hour chart. Moreover, the price is hovering well above the Ichimoku cloud.
Another positive extension could find resistance at the 61.45 barrier, where the market topped on November 2018, increasing bullish sentiment in the short term. More upside pressures could drive the commodity towards the next hurdle of 63.20, taken from the peak on November 2018.
In case of a successful penetration to the downside of 59.21, oil prices could rest near the red Tenkan-sen line and the 20-simple moving average (SMA) around 58.60. Even lower, the next stop could be around the 40-SMA and the 57.70 support level, while deeper the price could touch 57.51, the 23.6% Fibonacci retracement level of the upleg from 51.60 to 59.31.
Overall, the market is in an ascending tendency over the last month following the rebound on the 51.60 support barrier.
Investors Are Focused On The British Pound
Yesterday, the US dollar weakened slightly against a basket of major currencies. Investors took a wait-and-see attitude before the Fed's monetary policy decision. Financial market participants expect the Fed to keep interest rates unchanged following a two-day meeting, which will start today. The dollar index (#DX) closed the trading session in the negative zone (-0.08%).
At the moment, the British pound is in the spotlight. The pound fell in price after it became known that British Prime Minister Theresa May wanted to carry out the third voting for her Brexit deal in Parliament. However, the pound was under pressure after the Parliament canceled the vote. According to the representative of the House of Commons, John Bercow, fundamental changes had to take place with the offered agreement in order to vote. Theresa May should officially ask EU for the Article 50 extension, since the Brexit date expires on March 29. All 27 EU countries should approve the extension of the Article at the summit on Thursday. But the problem is that Theresa May still hasn't made the request. If May does not make a request for an extension until Thursday, the pound will have serious problems, because it will force the EU to hold an emergency summit on March 28.
The "black gold" prices are showing positive dynamics amid a decrease in OPEC+ production. At the moment, futures for the WTI crude oil have approached $59.60 per barrel.
Market Indicators
- Yesterday, the bullish sentiment prevailed in the US stock market: #SPY (+0.36%), #DIA (+0.25%), #QQQ (+0.06%).
- The 10-year US government bonds yield is at the level of 2.59-2.60%.
The news feed on 19.03.2019:
- Reports on the UK labor market at 11:30 (GMT+2:00);
- German ZEW economic sentiment index at 12:00 (GMT+2:00).
BOE Preview – Staying Cautious Despite Temporary Bounce in Economic Data. Brexit Uncertainty Remains
BOE would leave the Bank rate at 0.75% in March. Despite the bounce in the January data, the members would still remain cautious as global economic slowdown remains a key theme of this year. Meanwhile, the members would maintain a cautious outlook over Brexit uncertainty, especially the UK parliament has voted for an extension of Article 50 last week.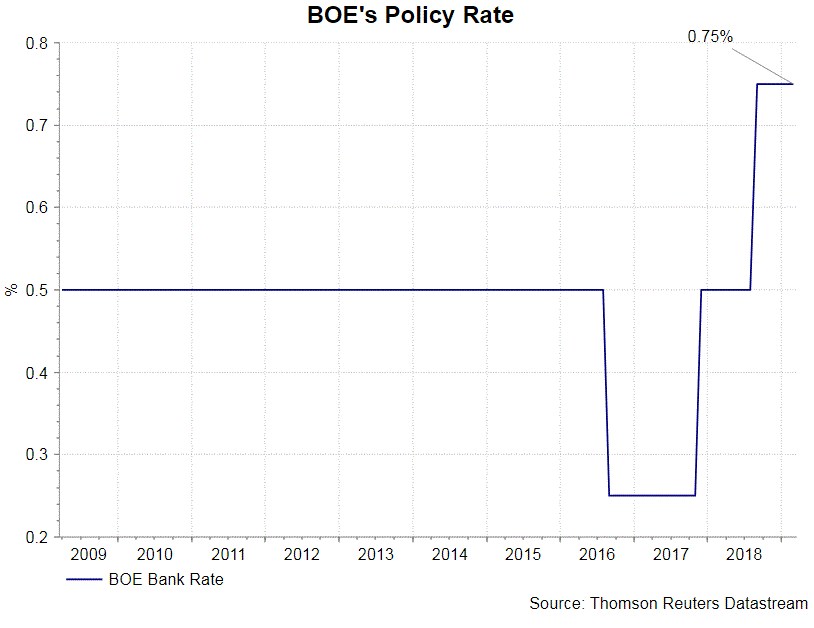
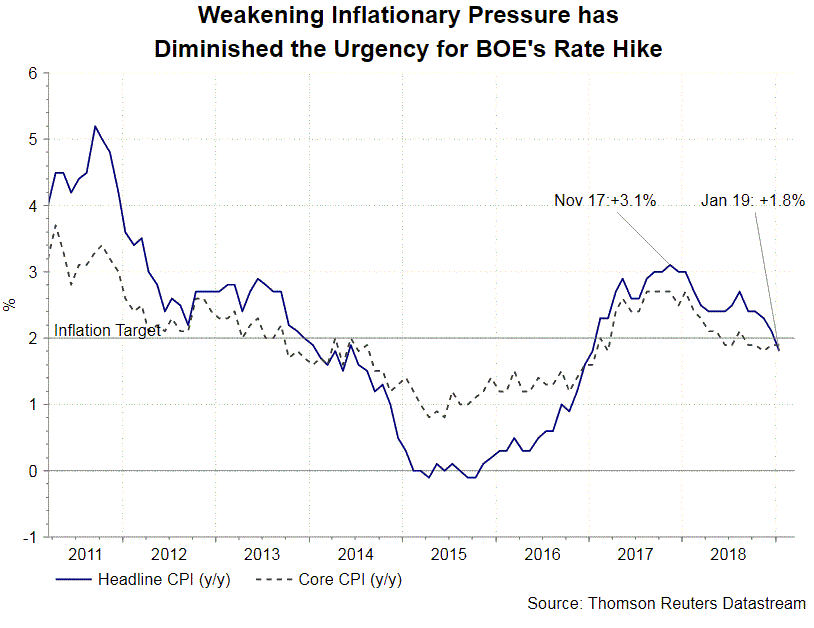
Since the February meeting, economic data were mixed. GDP growth recovered to +1.4% y/y in January, from a weak +1% in December. On quarterly basis, GDP growth decelerated to +0.2% in 4Q18, from +0.6% in the prior quarter. On the job market, the number of jobs soared +222K in the three months through January, beating consensus of +120K and December's +167K addition. The unemployment rate slipped -0.1 percentage point to 3.9% during the period. However, the Claimant count unemployment increased +27K in February, while the January figure was revised higher to 15.7K. On inflation, the January report showed that the headline CPI eased sharply to +1.8% y/y from +2.1% in the prior month. Core CPI steadied at +1.9%. As the upcoming February data are expected to show no change from a month ago, current inflation level should give the central bank room to stand on the sideline.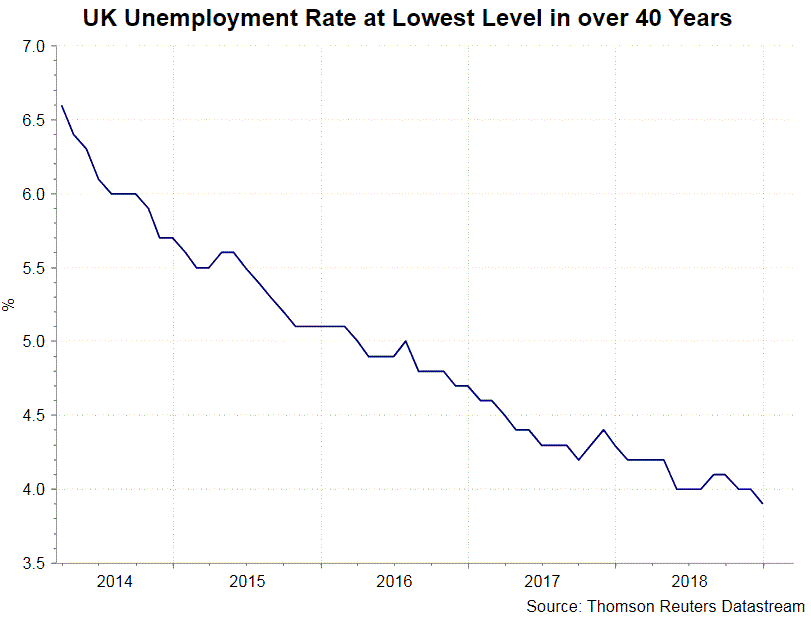
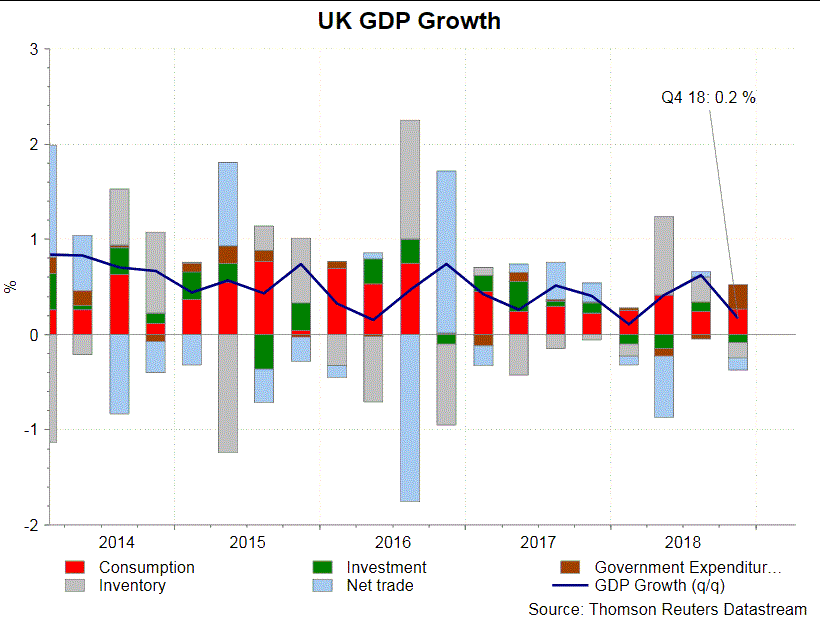
 The Brexit drama continues. Last week, following the defeat of the revised version of the Withdrawal Agreement (the deal), the UK parliament rejected with majority to leave the EU with no deal. Meanwhile, the MPs approved to extend Article 50, delaying the official Brexit date from March 29. However, the next step is highly uncertain with regard to the duration of the extension and what the government would do during the period of extension. House of Commons speaker John Bercow has just blocked a third "meaningful vote" on "substantially the same" motion as MPs rejected last week. PM Theresa May initially attempted to put the deal to the vote again this week, after which the duration of the extension would be decided. Her attempt was premised on the speculations that some Eurosceptic PMs would eventually support the deal in order to avoid a prolonged extension of Article 50.
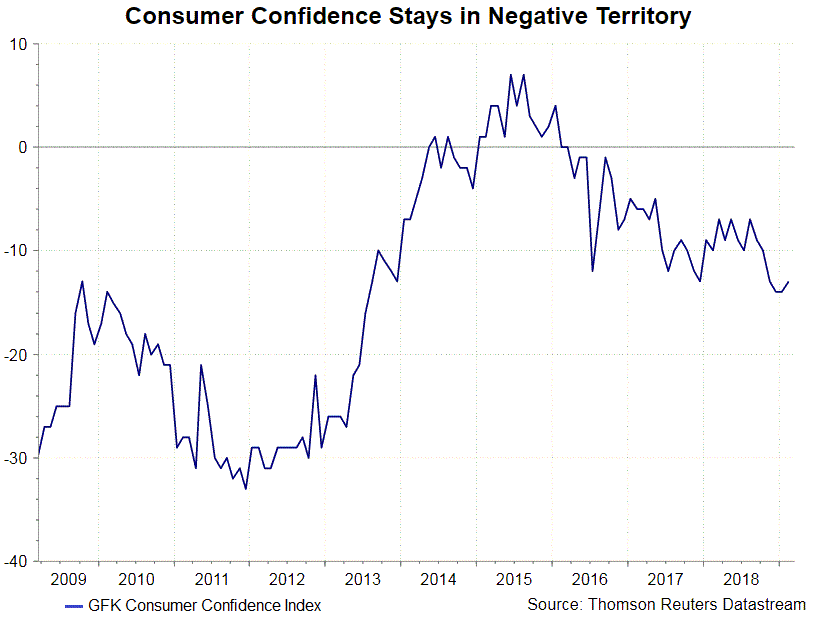
At the February meeting, the central bank reiterated a tightening monetary bias and noted that any rate hike would only take place after “the fog of Brexit” is clear. We expect it would reaffirmed this stance this month. Delaying the time for leaving the EU means prolonging the uncertainty. This has already been hurting consumer confidence and business investment. The chart below shows that business investment has been falling after reaching a peak in 4Q17. Meanwhile, the number of working hours has been increasing steadily. This probably reflected the decision that corporations have become more cautious in capital investment due to Brexit uncertainty. the productivity is then replaced by higher labor force which could be reduced in a more timely basis. Despite a mild recovery in January, consumer confidence has remained negative and at the lowest level since 2014. Apparently, a strong employment market has failed to restored sentiment.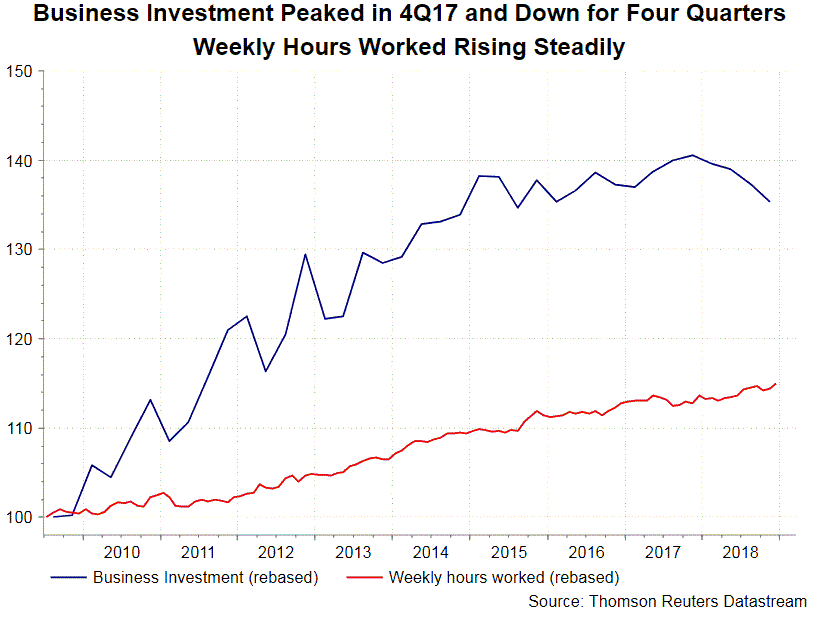
The Analytical Overview Of The Main Currency Pairs
The EUR/USD currency pair
Technical indicators of the currency pair:
Prev Open: 1.13255
Open: 1.13362
% chg. over the last day: +0.14
Day's range: 1.13336 – 1.13544
52 wk range: 1.1214 – 1.2557
The USD index holds the two-week minimums before the Federal Reserve meeting. The financial market participants are waiting for the regulator to approve a "careful" approach towards hardening the monetary policy. Right now the currency pair is moving in a flat. The key support and resistance levels are 1.13250 and 1.13600. EUR has further growth prospects. You should open positions from the key levels.
At 12:00 (GMT+2:00) ZEW will publish the economic mood index in Germany.
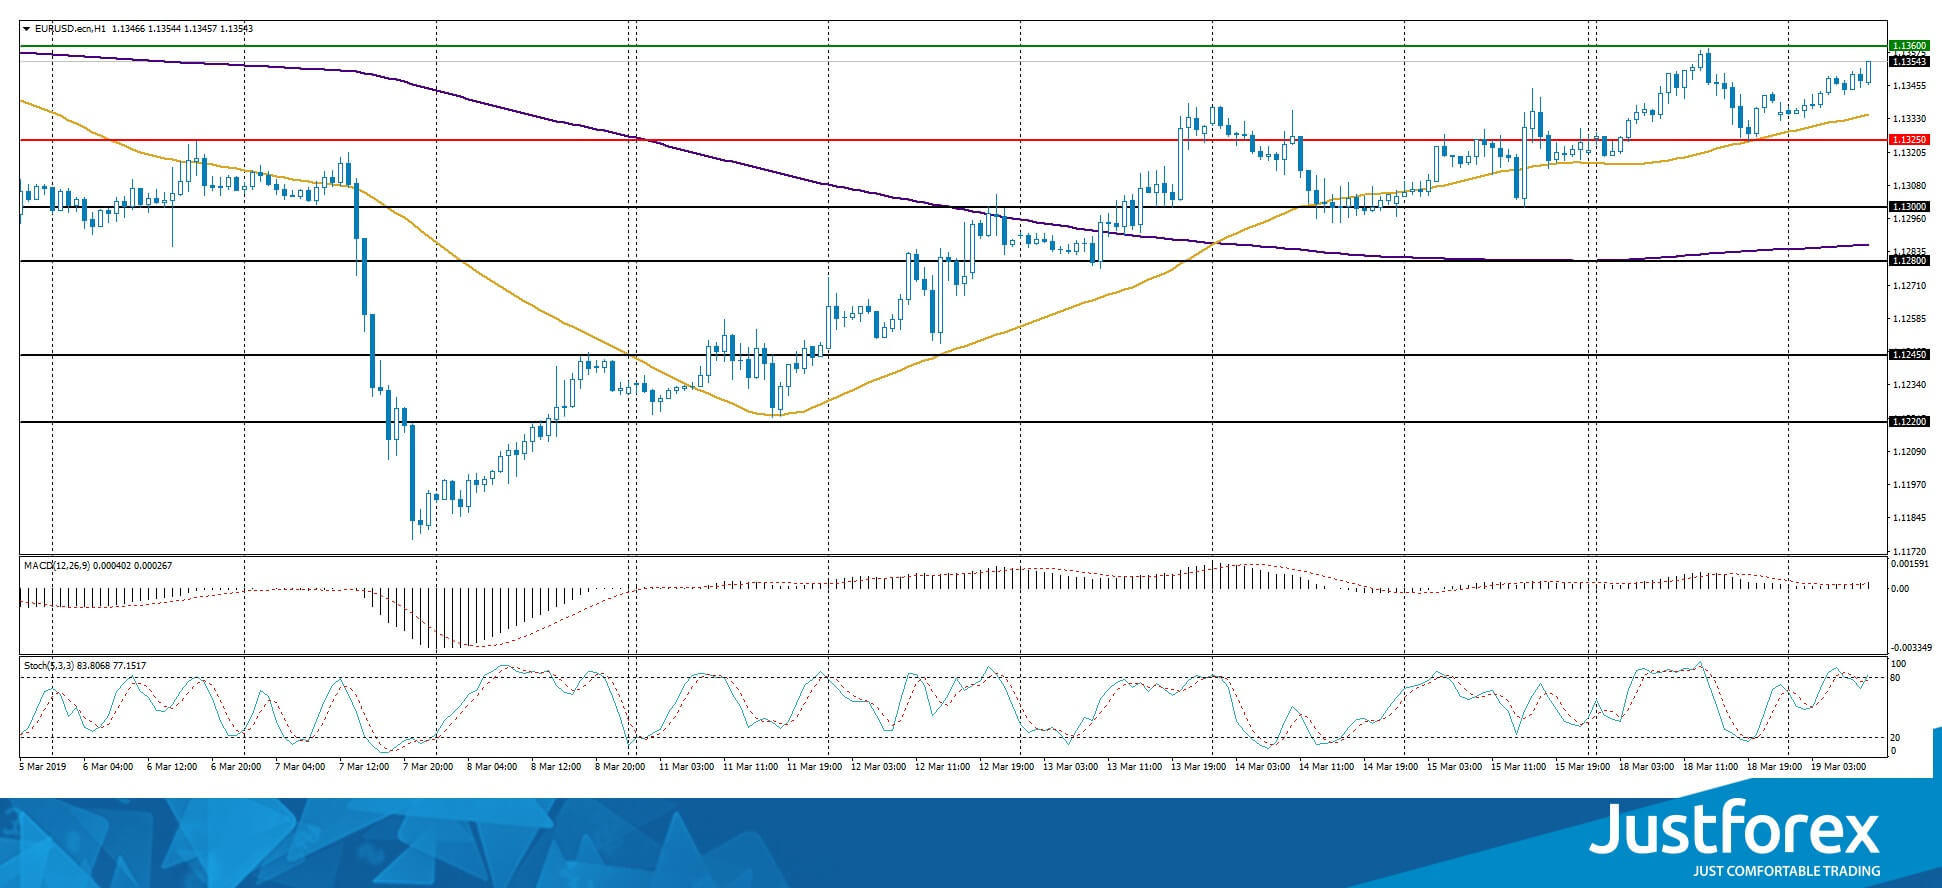
The price fixed above 50 MA and 200 MA which points to the power of the buyers.
The MACD histogram is in the positive zone and keeps rising, which gives a signal to buy EUR/USD.
The Stochastic Oscillator is in the overbought zone, the %K line is crossing the %D line. There are no signals at the moment.
Trading recommendations
Support levels: 1.13250, 1.13000, 1.12800
Resistance levels: 1.13600, 1.14000
If the price fixes above the local resistance of 1.13600, expect the quotes to grow toward 1.14000.
Alternatively, the quotes can descend toward 1.13000-1.12800.
The GBP/USD currency pair
Technical indicators of the currency pair:
Prev Open: 1.32955
Open: 1.32466
% chg. over the last day: -0.24
Day's range: 1.32431 – 1.32806
52 wk range: 1.2438 – 1.4378
GBP/USD keeps trading in a flat. The key levels are 1.12400 and 1.33000. The investors are waiting for new data regarding Brexit. The GBP is under pressure after John Bercow refused to approve a new Brexit vote. The official stated that the deal should be presented in a different format. You should open positions from the key levels.
At 11:30 (GMT+2:00) the UK will publish a labour market report.
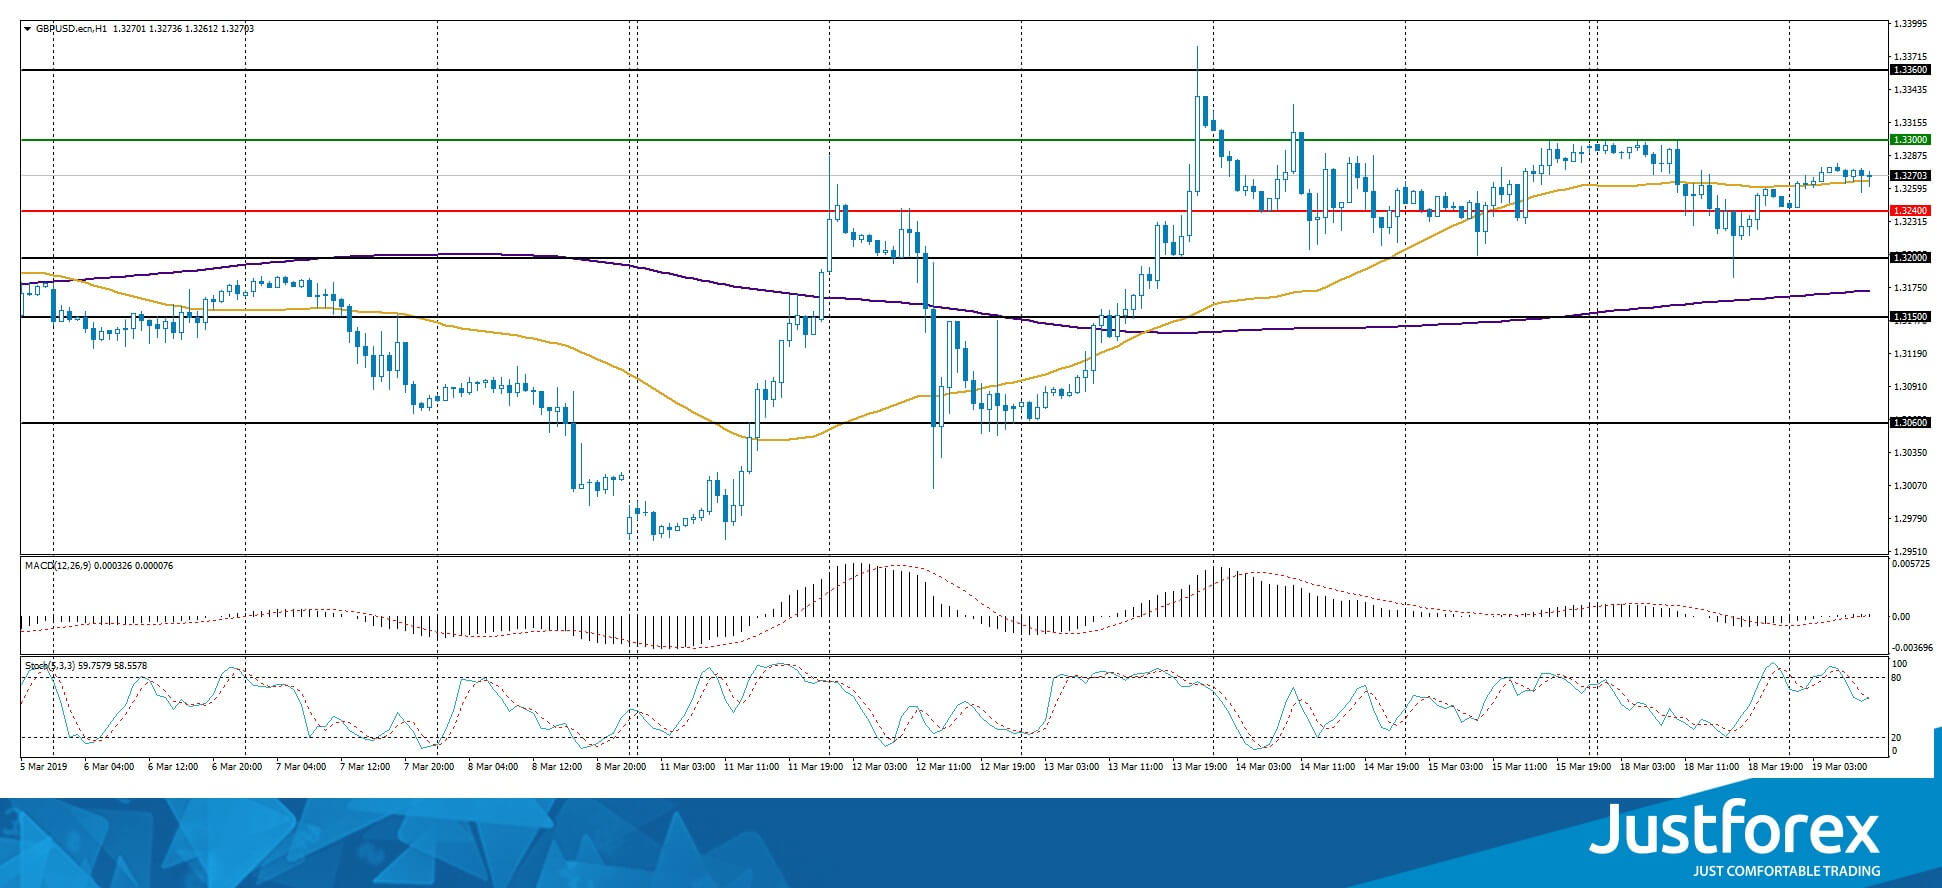
The indicators do not provide precise signals, the price has crossed 50 MA.
The MACD histogram is close to 0.
The Stochastic Oscillator is in the neutral zone, the %K line is crossing the %D line. There are no signals at the moment.
Trading recommendations
Support levels: 1.32400, 1.32000,1.31500
Resistance levels: 1.33000, 1.33600
If the price fixes above 1.33000, expect the quotes to rise toward 1.33500-1.33700.
Alternatively, the quotes can fall toward 1.32000-1.31500.
This article reflects a personal opinion and should not be interpreted as an investment advice, and/or offer, and/or a persistent request for carrying out financial transactions, and/or a guarantee, and/or a forecast of future events.
The USD/CAD currency pair
Technical indicators of the currency pair:
Prev Open: 1.33316
Open: 1.33375
% chg. over the last day: -0.09
Day's range: 1.33224 – 1.33441
52 wk range: 1.2248 – 1.3664
USD/CAD keeps trading in a flat. The technical picture is ambiguous. Right now the local support and resistance levels are 1.33100 and 1.33400. The demand for USD is weakened before the Federal Reserve meeting. Additional support for CAD is caused by the bullish oil market. The quotes have a tendency to descend. You should open positions from the key levels.
The Economic News Feed for 19.03.2019 is calm.
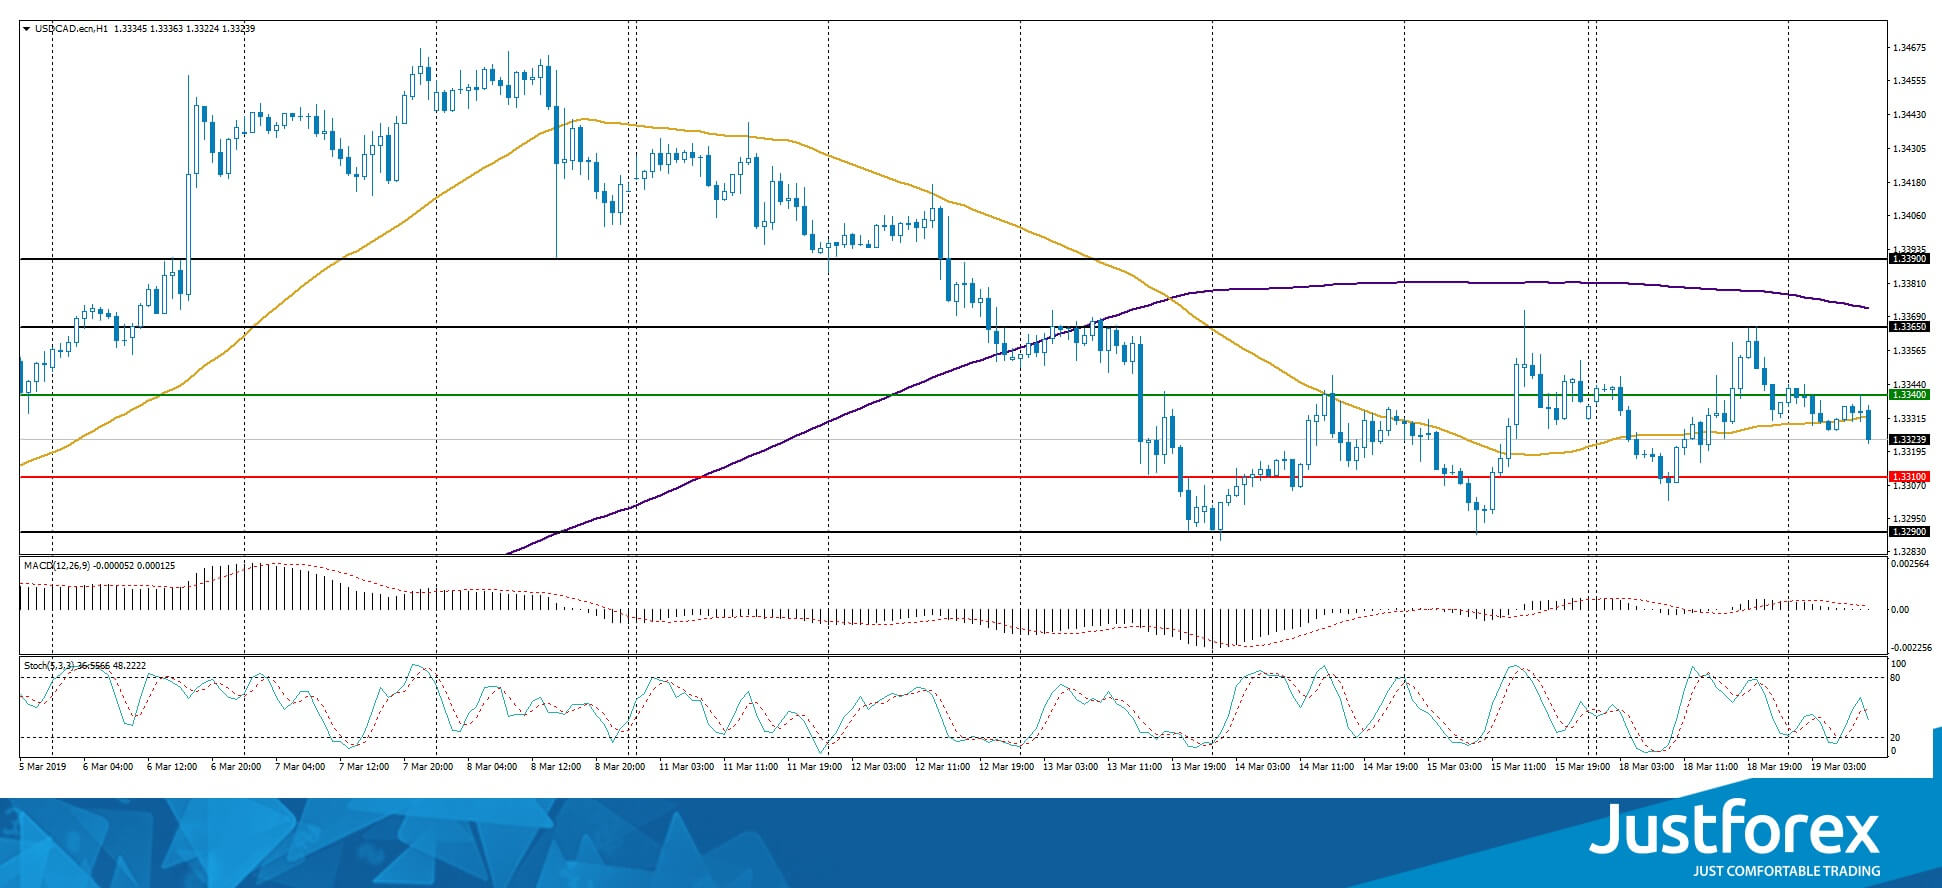
The indicators do not provide precise signals, the price has crossed 50 MA.
The MACD histogram is close to 0.
The Stochastic Oscillator is in the neutral zone, the %K line is crossing the %D line. There are no signals at the moment.
Trading recommendations
Support levels: 1.33100, 1.32900, 1.32500
Resistance levels: 1.33400, 1.33650, 1.33900
If the price fixes below 1.33100, expect the quotes to fall toward 1.32800-1.32600.
Alternatively, the quotes can grow toward 1.33650-1.33900.
The USD/JPY currency pair
Technical indicators of the currency pair:
Prev Open: 111.466
Open: 111.443
% chg. over the last day: -0.15
Day's range: 111.158 – 111.443
52 wk range: 104.56 – 114.56
USD/JPY started to descend. The trading instrument updated the local miniums. Right now the quotes are consolidating. The local support and resistance levels are 111.150 and 111.400. The demand for USD is weakening. You should keep an eye on the US Treasury bonds` yield dynamics and open positions from the key levels.
The Economic News Feed for 19.03.2019 is calm.
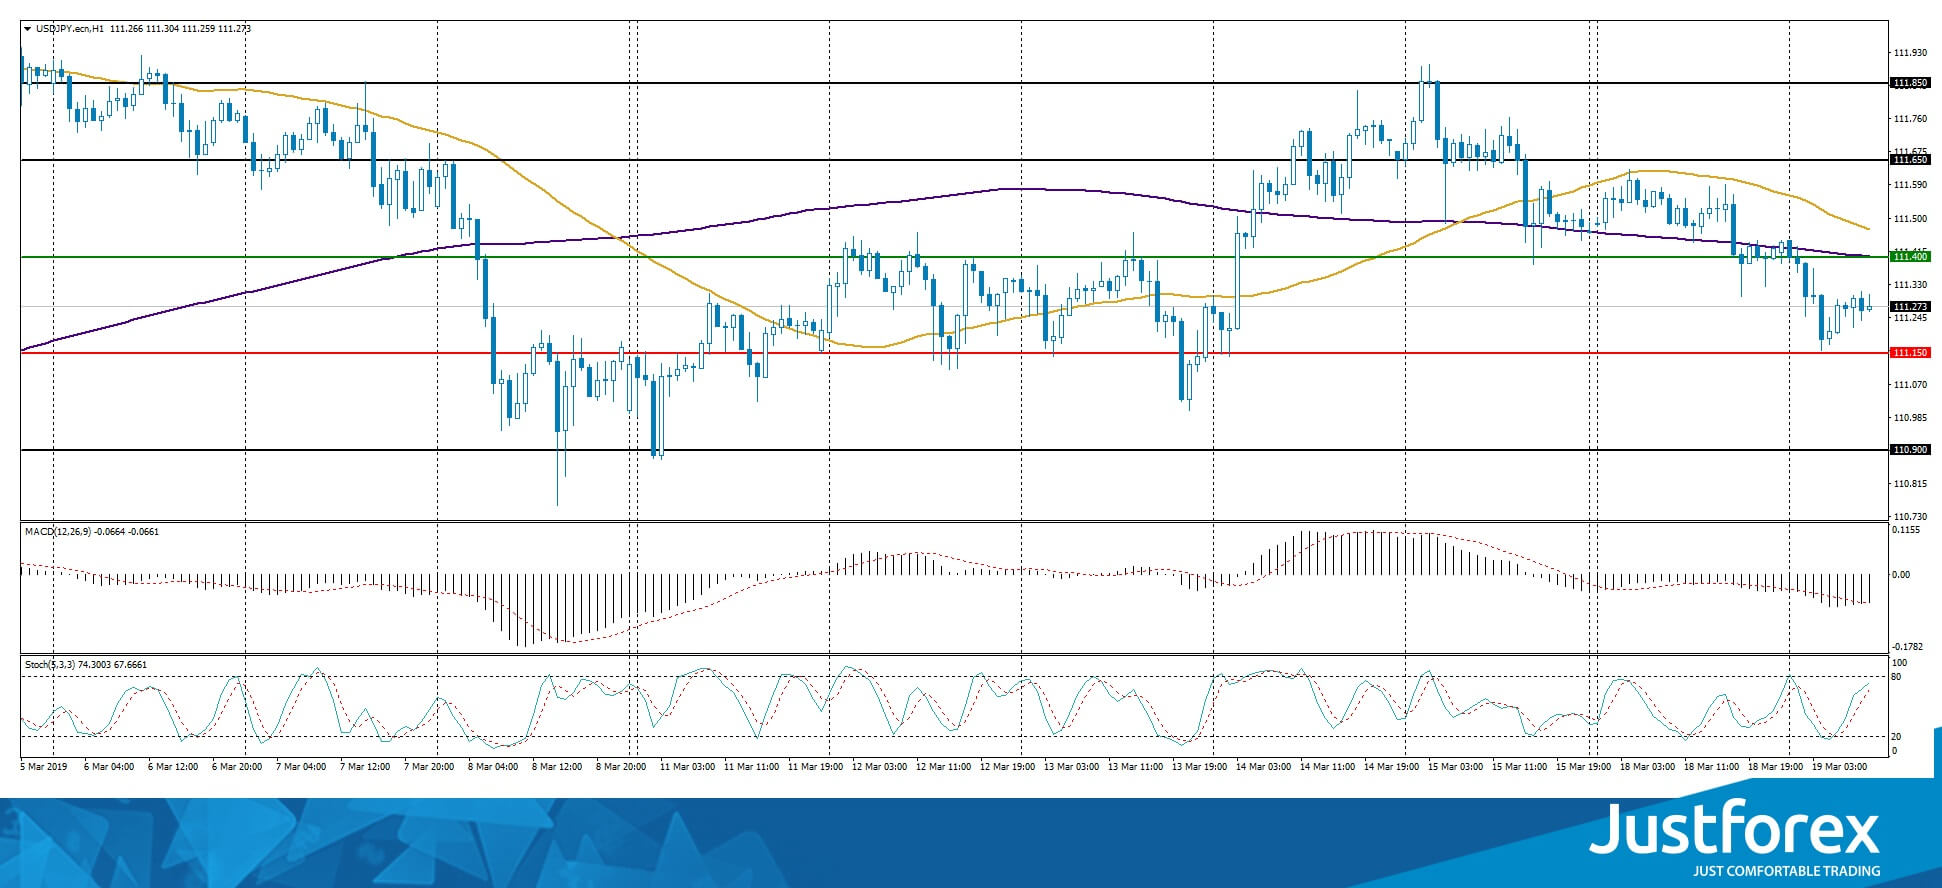
The indicators do not provide precise signals, 50 MA started to cross 200 MA.
The MACD histogram is in the negative zone but above the signal line, which gives a weak signal to sell USD/JPY.
The Stochastic Oscillator is in the neutral zone, the %K line is above the %D line which points towards the bullish mood.
Trading recommendations
Support levels: 111.150, 111.900, 110.600
Resistance levels: 111.400, 111.650, 111.850
If the price fixes below the local support 111.150, expect the quotes to fall toward 110.900-110.700.
Alternatively, the quotes can grow toward 111.600-111.800.
USD Slides Further, RUB Better Bid
Traders await the Fed, RUB better bid
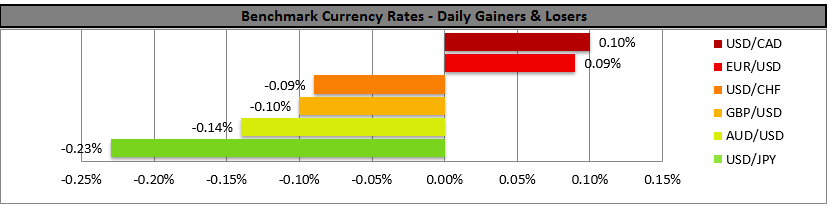
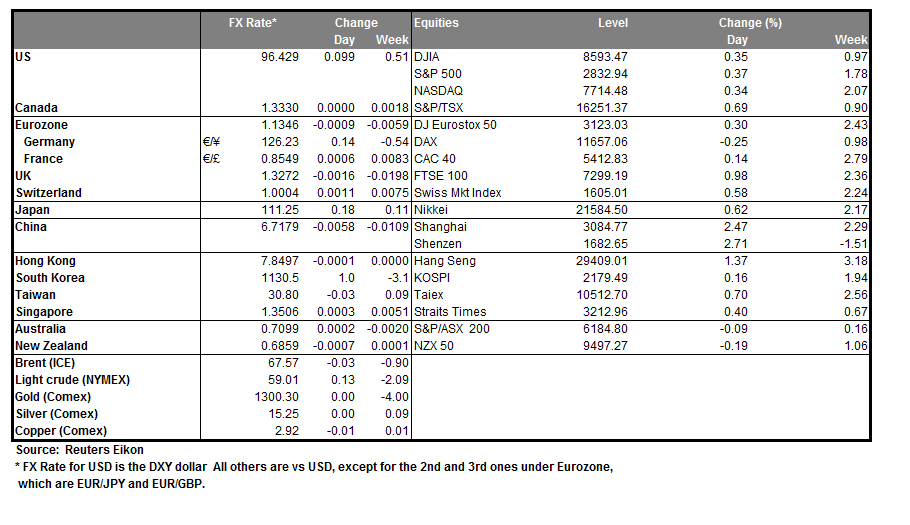
The US dollar continued to lose ground against most of its peers as sentiment on risk remained roughly positive ahead of tomorrow FOMC meeting. The dollar index gave up another 0.14% Tuesday morning as it reached 96.39. The single currency appreciated to 1.1355 (+0.15%) against the buck and is on its way to test yesterday’s high at 1.1359. Even safe haven currencies are grinding higher both the Japanese yen and Swiss franc blinking green on the screen. USD/JPY eased as low as 111.16, while the Swiss franc stabilised around parity against the USD.
Among EM currencies, the Russian rouble was the best performers over the last two days amid better than expected manufacturing data. Industrial output increase by a solid 4.1%y/y in February compared with a consensus of 1.5%. We could reasonably expect that the RUB would continue to appreciate in the medium to long term as the probability of US sanctions as slowly vanishing. In addition, the fact that the CBR has substantially increased its gold reserve, at the expense of US treasuries. Over the last 4 years, the CBR has increased its gold holding by 880 tons (+80%), while at the same time reducing its holding of long-term US treasuries by almost 90%. This could only positive for the rouble.
EU stocks sidestep growth risks
Expectations for global inflation continue to decrease as deflationary pressure mount. This indicated that the Fed will unlikely be challenged by suspected inflation over 2% target. The ECB in reactions slashed its 2019 forecast for both economic growth and inflation. Yet this might be a bit too late as the ECB is clearly behind the curve on this one. Market based measure indicate an elevated risk of a recession. German 10 year bond yields have decline to near zero perhaps the strong signal that European growth outlook is extremely weak. In addition, European equities are now tracking a similar pattern seen during the last recession between mid-211 and early 2013. EU economy growth remains positive with a quarterly GDP pace of 0.4% (1.6% annualized quarterly basis) suggesting the economic downturn currently is not deep. EU composite purchasing managers index (PMI) has decelerated from 58 to current reading of 51.9 (still above the 50 divide line).
Through the 2011-13 recession the PMI trended around 46, indicating a recession. European stocks have stage an impressive recovery bounce outpacing the most optimist EU analyst. Stocks recent recovery reflects optimize for economic stability however, increasing risk of a real recession could lead to further market declines. There are plenty of developments that could tip Europe into a necessary path. UK anticipated “Brexit”, leadership changes this year in Europe, including the head of the ECB and trade discussion of US led auto tariffs. European stocks have priced in a harder growth environment, which may leave them better equipped than other developed markets that are near their historical highs. There are some reassuring signs of progress, more volatility ahead if Europe’s economy fails to right itself.
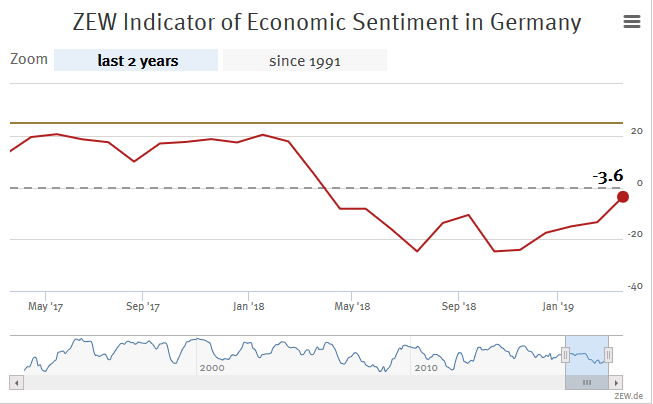
German ZEW improved significantly as major risks considered less dramatic
German ZEW Economic Sentiment improved notably to -3.6 in March, up from -13.4 and beat expectation of -11.0. German ZEW Current Situation, however dropped to 11.1, down from 15.0 and missed expectation of 13.0. Eurozone ZEW Economic Sentiment improved to -2.5, up from -16.6 and beat expectation of -15.1. Eurozone ZEW Current Situation also dropped to -6.6, down from -3.0.
ZEW President Professor Achim Wambach said in release that the significant improvement shows that "major economic risks are considered to be less dramatic than before". Those include possible delay in Brexit and renewed hope for a deal. Also, "progress made in the negotiations between China and the US to end the trade war between the two nations may also have contributed". Still the indicators point to "relatively weak growth" in first half in Germany.
USD Weakens Ahead Of FOMC Meeting
The US dollar was on the retreat yesterday once again and during today’s Asian session, ahead of the FOMC’s meeting. Markets seem to expect that the FOMC would adopt an even more dovish policy on Wednesday and there seem to be also concerns that about the US growth outlook. Analysts point out that there may be expectations of a possible rate cut by year end according to Feds Funds Futures. Analysts also point out that should the Fed show a really gloomy outlook for growth and rates, the hit could extend beyond the USD, also to the equity markets. We expect there to be increased volatility for USD pairs as there seems to be high risk on the final outcome of the meeting. USD/JPY dropped yesterday breaking the 111.40 (R1) support line (now turned to resistance). We could see the pair weakening further, as the FOMC interest rate decision draws near, yet it may prove sensitive to today’s financial releases. Should the pair continue to be under the market’s selling interest, we could see the pair breaking the 110.90 (S1) support line and aim for the 110.30 (S2) support barrier. Should on the other hand the market favour the pair’s long positions, we could see it breaking the 111.40 (R1) resistance line and aim for the 112.00 (R2) resistance hurdle.
Pound gets some support yet remains in check.
The pound dropped yesterday due to Brexit developments, yet corrected higher during today’s Asian session. UK Parliament’s speaker Bercow said that Theresa May’s deal could not be voted on again, unless a different proposal is submitted. Analysts pointed out that chances of the UK crashing out of the EU have increased once again, as the EU requires a clear plan and strategy before they grant an extension. However it should be noted that the EU is not open to renegotiating the last deal, so substantial alterations could be off the table. Hence, we could see the chances of a longer delay of the Brexit date increasing, along with alternative solutions being presented once again, such as a second referendum and general elections. We expect volatility for the pound to continue as a number of developments along with financial releases and BOE’s interest rate decision are due out, in the next days. Cable dropped by 120 pips yesterday, yet corrected higher, remaining above the 1.3265 (S1) support line. We could see the pair trading in a bearish market, should the pound weaken. It should be noted though that the pair could prove sensitive to todays’ financial releases as well as any Brexit headlines. Should the bears dictate the pair’s direction, we could see it breaking the 1.3265 (S1) support line and aim if not break the 1.3175 (S2) support level. Should on the other hand, the bulls take over, we could see the pair breaking the 1.3350 (R1) resistance line and aiming higher.
Other economic highlights, today and early tomorrow
In today’s European session we get UK’s Employment Data for January as well as Germany’s ZEW Economic Sentiment indicator for March. In the American session, we get the US Factory orders growth rate for January, the API weekly crude oil inventories figure and just before the Asian session starts, we get New Zealand’s Current account balance for Q4. Please note that the minutes of BoJ’s meeting in January are due out, during tomorrow’s Asian session. As for speakers be advised that ECB’s Peter Praet and RBA’s assistant governor Bullock are scheduled to speak today and during tomorrow’s Asian session.
GBP/USD
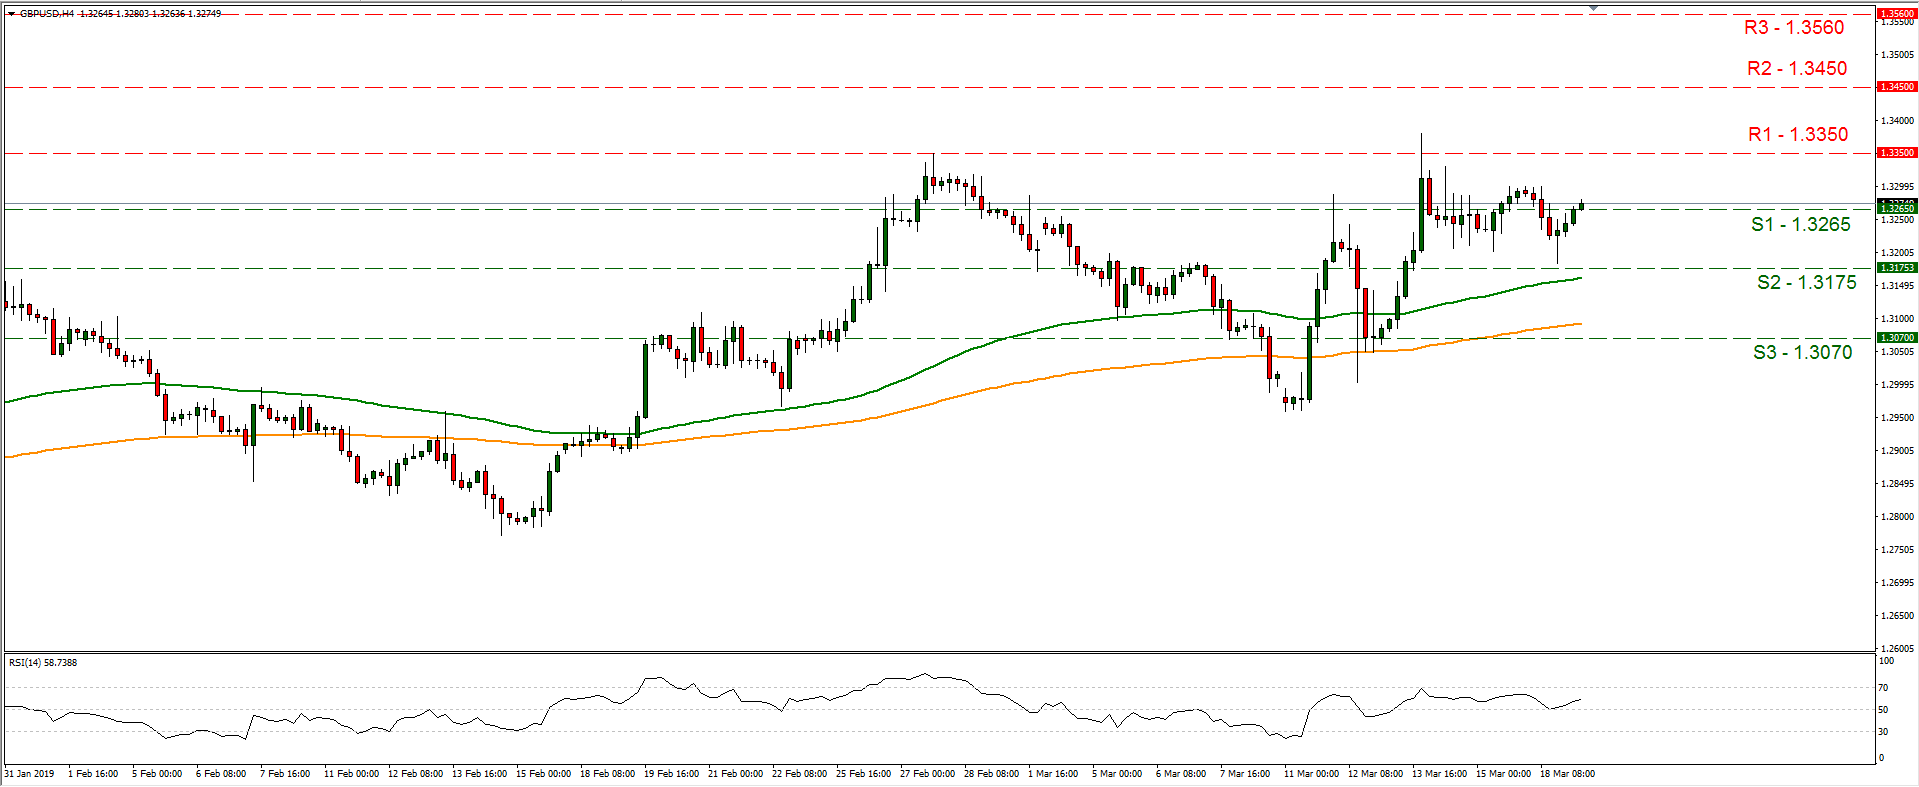
Support: 1.3265 (S1), 1.3175 (S2), 1.3070 (S3)
Resistance: 1.3350 (R1), 1.3450 (R2), 1.3560 (R3)
USD/JPY H4
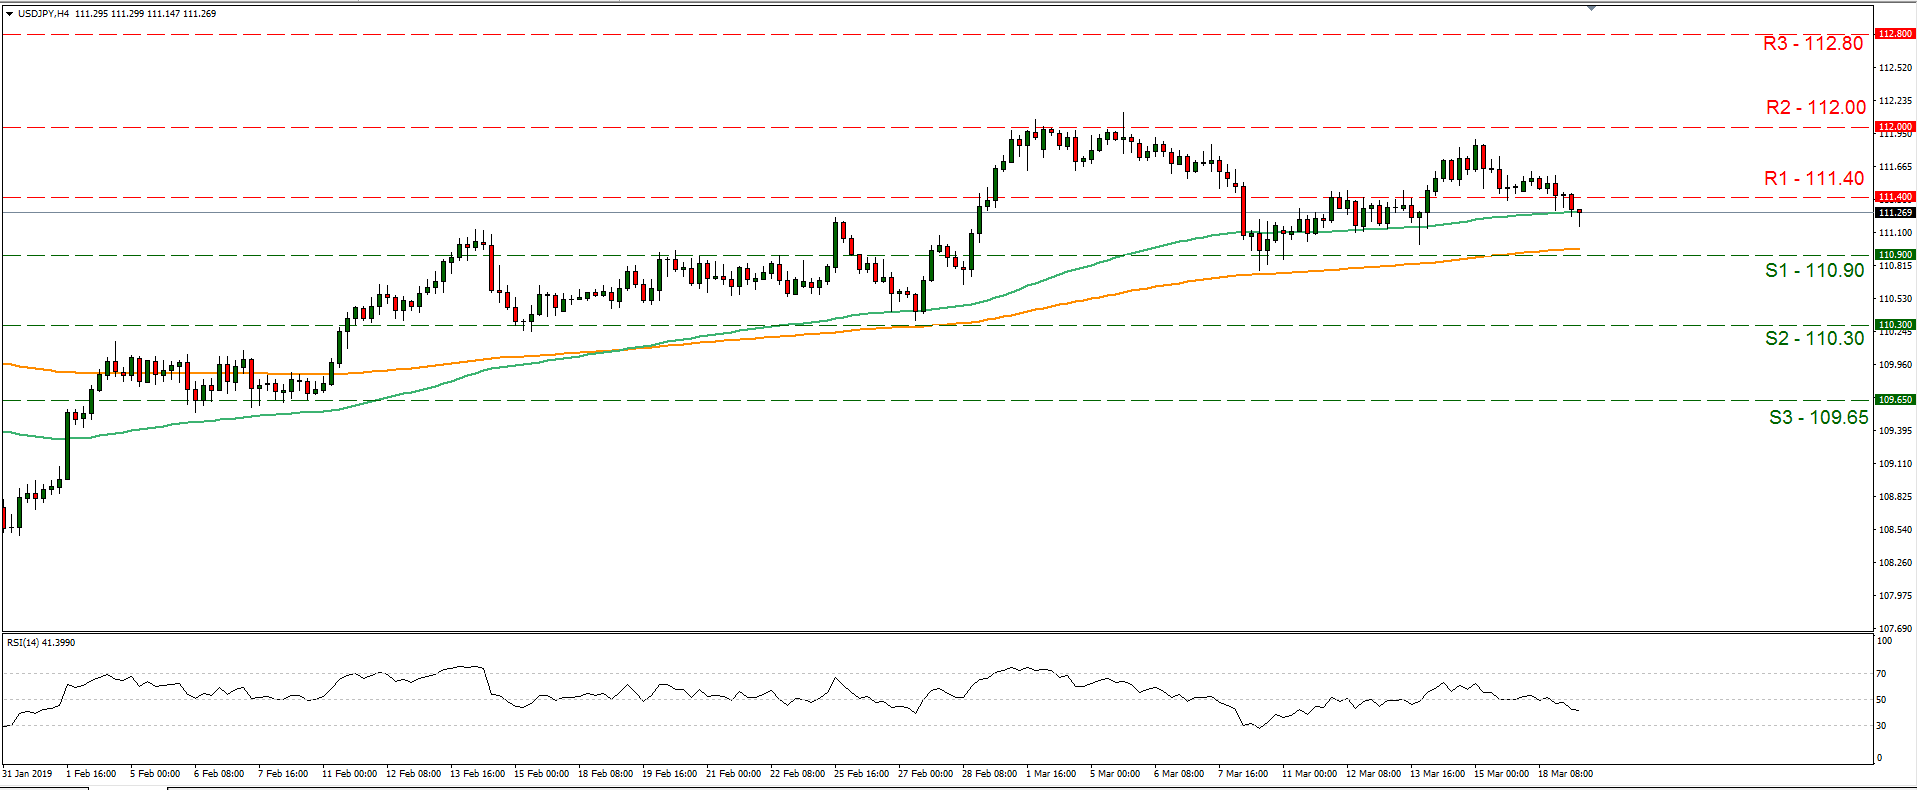
Support: 110.90 (S1), 110.30 (S2), 109.65 (S3)
Resistance: 111.40 (R1), 112.00 (R2), 112.80 (R3)
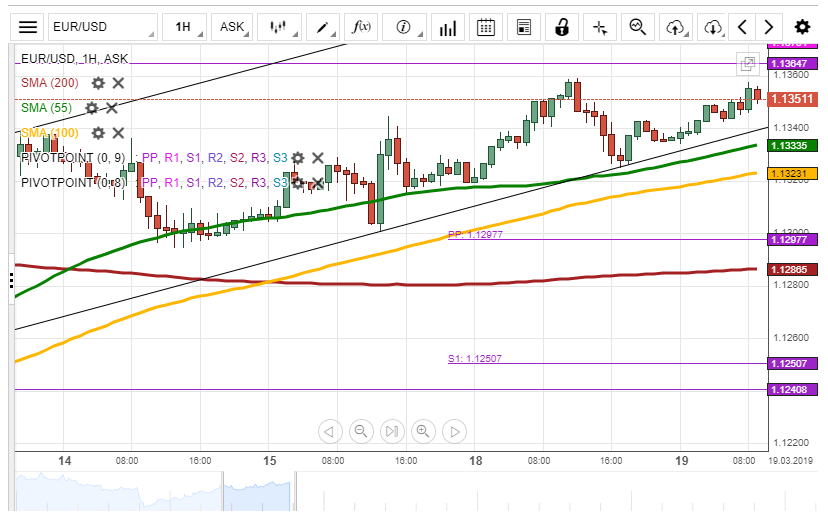
EUR/USD Will Trade At 1.1360
During Monday's trading session, the European Single Currency depreciated against the US Dollar to 1.1320. On Tuesday morning, the rate recovered itself to the 1.1354 mark.
In regards to the near-term future, it is expected that the rate will surge to the monthly pivot point at the 1.1364. Besides, the rate might break the resistance level of the monthly pivot point to trade at the 1.1360 level.
However, the monthly pivot point at the 1.1364 mark could retrace the currency exchange rate to push it to the 1.1340 level.
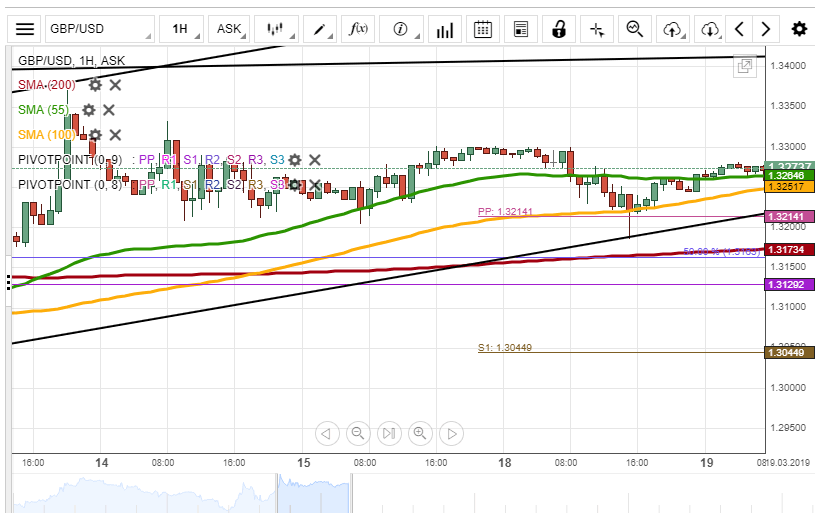
GBP/USD Could Reach 1.3300
During Monday's trading session, the currency exchange rate passed through most of the technical indicators to end the trading session at 1.3200. On Tuesday morning, the 55-hour simple moving average supported the rate to trade at the 1.3269 mark.
In regards to the near-term future, most likely, the 55-hour and the 100-hour simple moving average will support the British Pound during the day to push it to the 1.3300 level.
On the other hand, today's UK Average Earnings Index release at 9:25 GMT might push the rate to pass through the support levels towards the weekly PP at the 1.3214 mark.
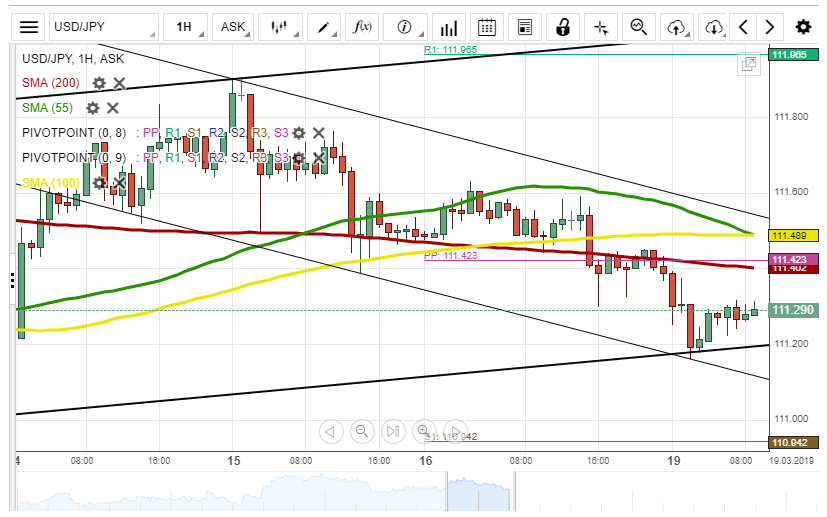
USD/JPY Might Depreciate To 111.00
During Monday's trading session, the currency exchange rate passed the support level of the 200-hour simple moving average to end the trading session at 111.20. On Tuesday morning, the rate was trading sideways at the 111.28 mark.
In regards to the near-term future, it is expected that the rate will break the pattern line at the 111.21 mark. In this case, most likely, the rate will end the trading session at the 111.00 level.
However, the pattern line at the 111.21 mark could support the rate to push it to the 111.40 level.