Sample Category Title
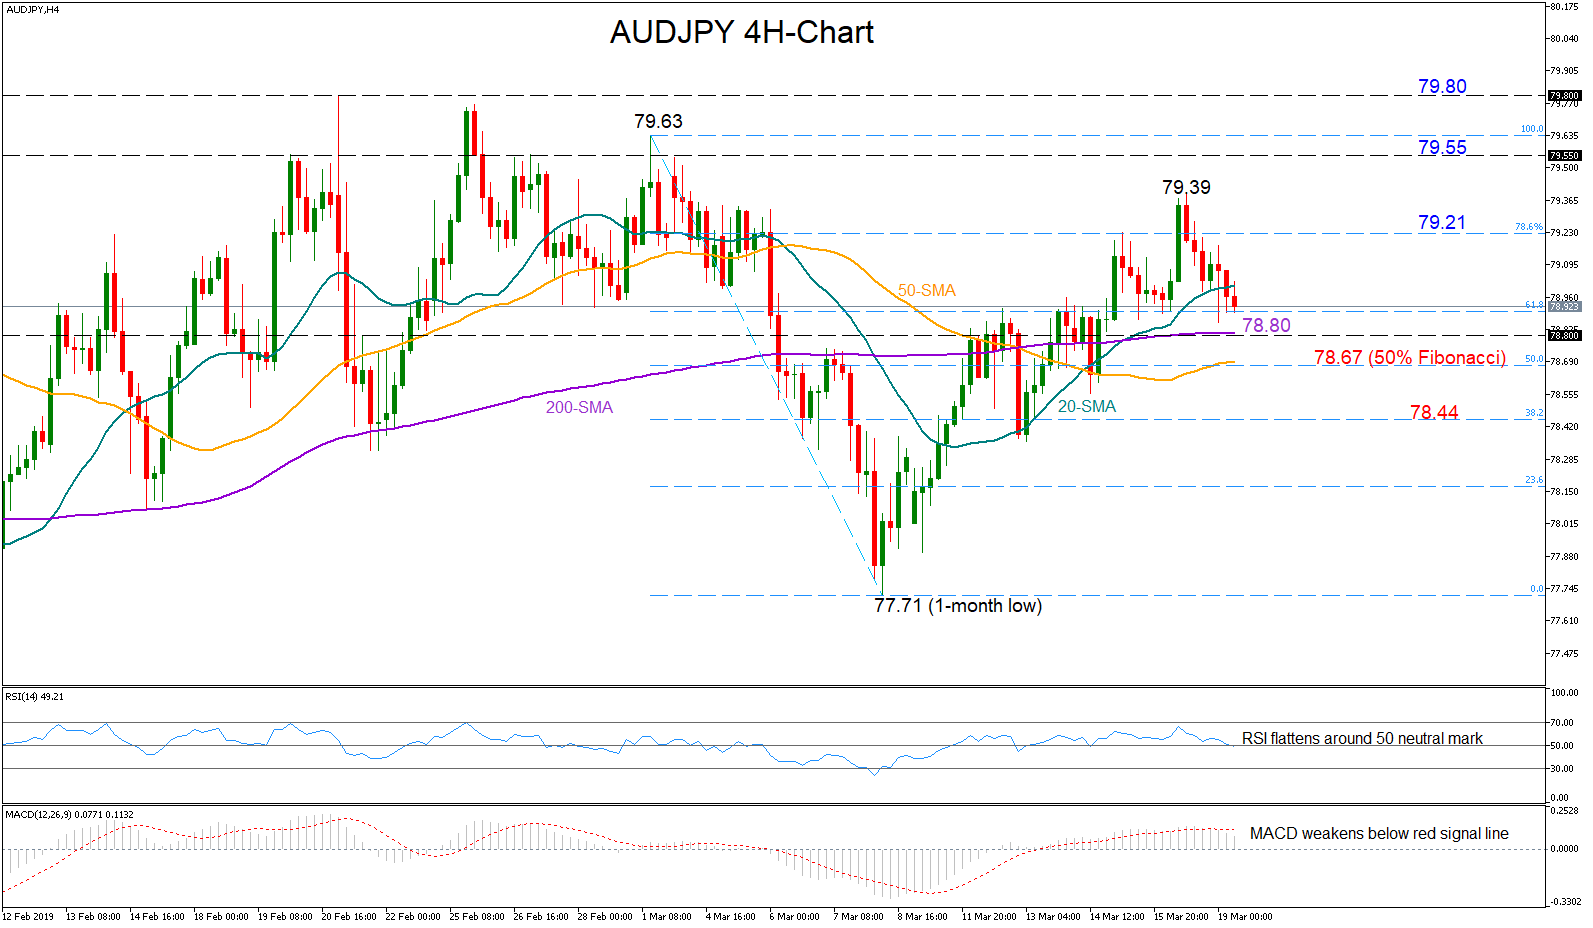
DAX Supported By A Rising Trend Line
Pivot (invalidation): 11625.00
Our preference Long positions above 11625.00 with targets at 11725.00 & 11790.00 in extension.
Alternative scenario Below 11625.00 look for further downside with 11570.00 & 11540.00 as targets.
Comment A support base at 11625.00 has formed and has allowed for a temporary stabilisation.
EURUSD Trendline Resistance Holding
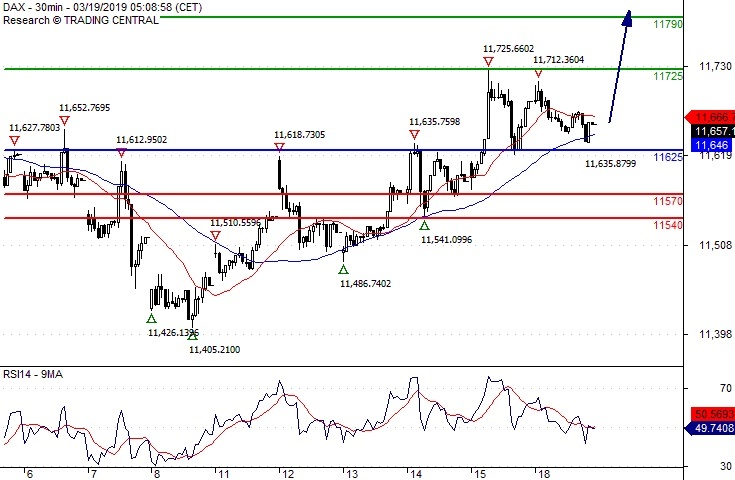
The euro currency is holding firm against the US dollar in early Tuesday, with the pair still well supported by strong dip-buying demand. The EURUSD pair has found strong resistance from the 1.1360 level, with bulls now needing to break above key trendline resistance on the four-hour time frame. If the 1.1360 level is broken, the EURUSD pair will likely advance towards the 1.1400 level.
The EURUSD pair is strongly bullish while trading above the 1.1360 level, key technical resistance is found at the 1.1410 and 1.1450 levels.
If the EURUSD pair moves under the 1.1325 level, sellers may test towards the 1.1290 and 1.1260 levels.
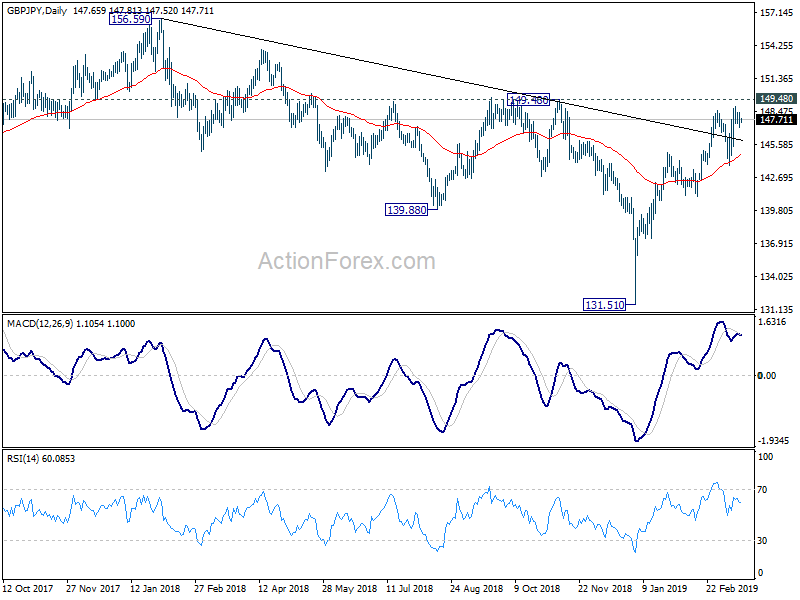
GBP/JPY Daily Outlook
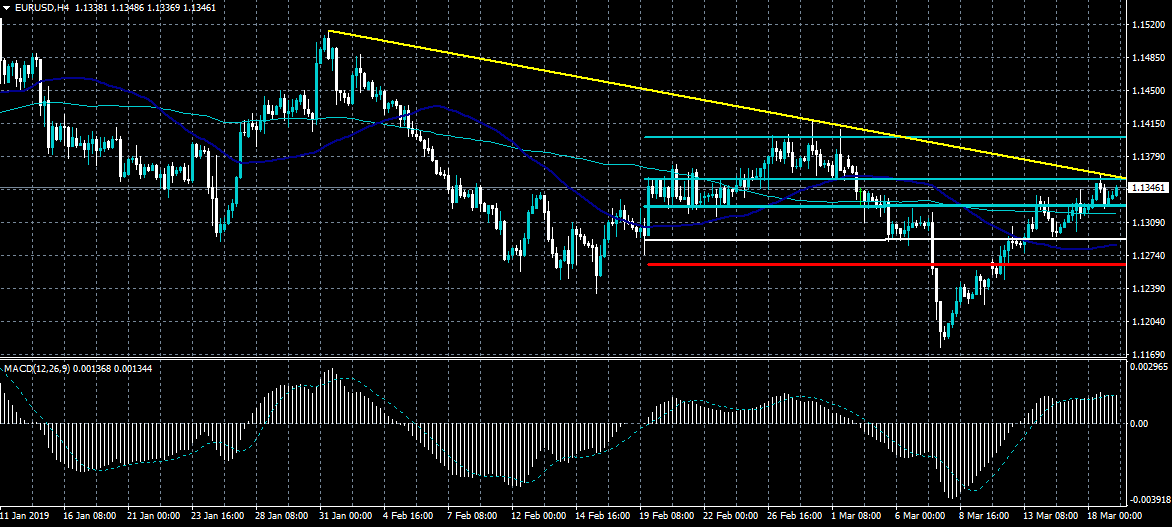
Daily Pivots: (S1) 147.01; (P) 147.70; (R1) 148.39; More...
Intraday bias in GBP/JPY remains neutral first and some more consolidations could be seen. On the upside, decisive break of 149.48 key resistance will carry larger bullish implication and target 156.58 resistance next. On the downside, though, break of 143.72 support will indicate near term reversal and turn outlook bearish for 141.00 support.
In the bigger picture, the strong rebound from 131.51 suggests that medium term fall from 156.59 (2018 high) has completed already. The corrective structure of such decline in turn argues that it's the second leg of the corrective pattern from 122.36 (2016 low). And this pattern is starting the third leg. On the upside, decisive break of 149.48 will pave the way to 156.59 resistance and above. However, firm break of 141.00 support will dampen this view and turn focus back to 131.51 low instead.
LTCUSD Bulls Need To Break $65.00 Level
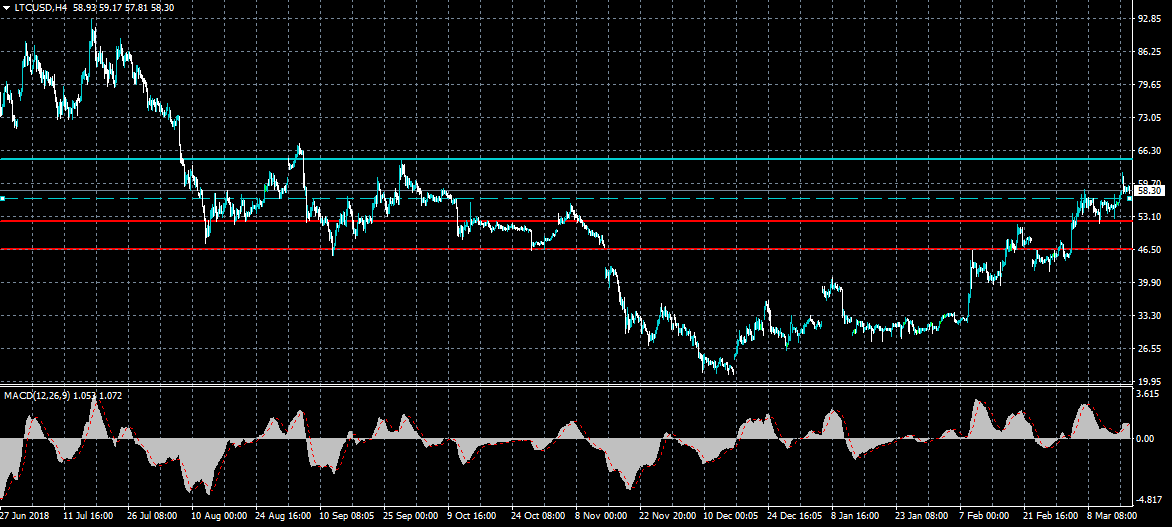
Litecoin is under slight downward pressure on Tuesday, with the fourth largest cryptocurrency by market capitalization struggling to hold price above the $60.00 level. Buyers need to trigger a bullish inverted head and shoulders pattern above the $65.00 level. The overall bullish bias surrounding the LTCUSD pair remains in place while price trades above the $53.00 support level.
The LTCUSD pair is bullish while trading above the $53.00 level, key technical resistance remains at the $60.00 and $65.00 levels.
If the LTCUSD pair moves under the $53.00 level, sellers may test towards the $46.50 and $36.00 support levels.
USDJPY Below Trendline Support
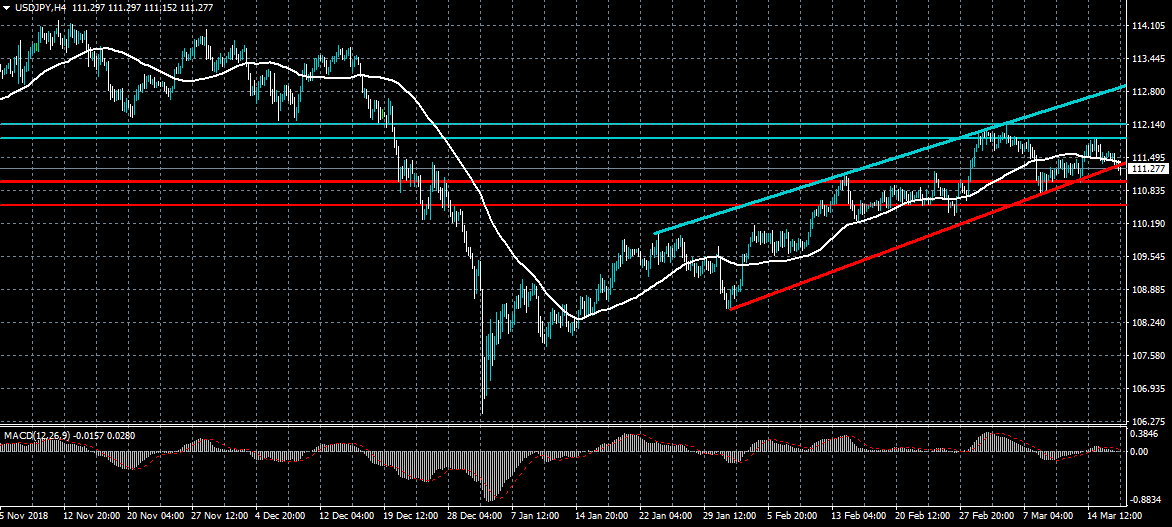
The US dollar continues to move lower against the Japanese yen currency, with the pair now trading below key weekly trendline support. The USDJPY pair now has a strong bearish bias while trading below the 111.30 level and could weaken further towards the 110.90 level. USDJPY bulls need to move price above the 111.45 level in order to shift the pairs bearish bias.
The USDJPY pair is strongly bearish while trading below the 111.30 level, key support is found at the 110.90 and 110.60 levels.
If the USDJPY pair trades below the 111.45 level, buyers may test towards the 111.80 and 112.15 resistance levels.
EUR/JPY Daily Outlook
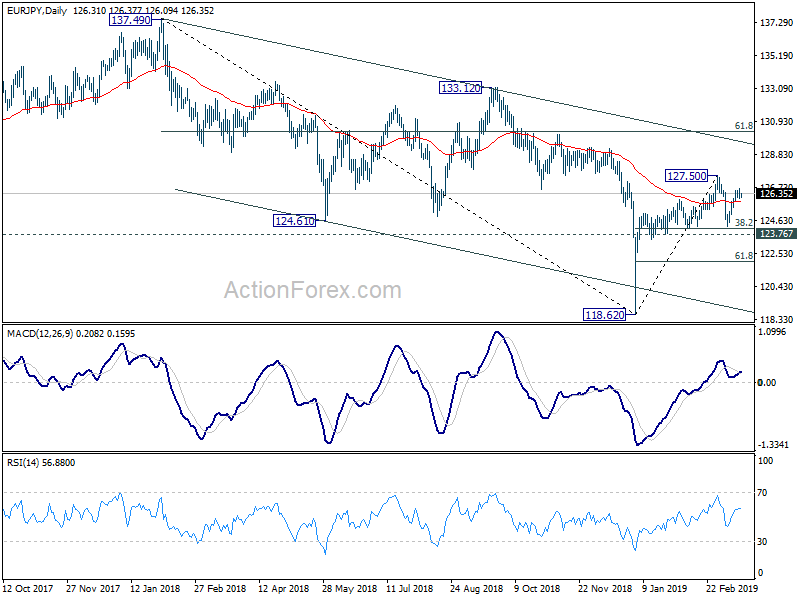
Daily Pivots: (S1) 126.09; (P) 126.40; (R1) 126.65; More....
Intraday bias in EUR/JPY remains neutral for the moment. Overall, with 124.23 cluster support (38.2% retracement of 118.62 to 127.50 at 124.10) intact, near term bullish ness is retained. On the upside, break of 127.50 will target 129.50 resistance next. On the downside, however, decisive break of 124.10/23 should confirm completion of whole rebound from 118.61. Deeper fall should at least be seen to 61.8% retracement at 122.01 and below. In this case, the chance of resuming larger down trend will also increase.
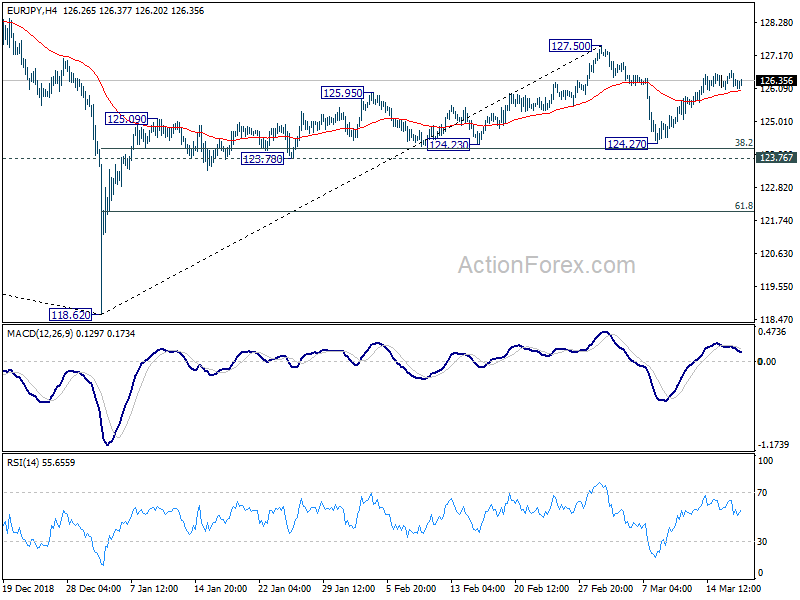
In the bigger picture, current development argues that medium term decline from 137.49 (2018 high) has completed with three waves down to 118.62 already. Decisive break of 133.12 resistance will confirm this bullish case. And whole up trend from 109.03 (2016 low) might resume through 137.49 in that case. On the downside, break of 124.23 support will invalidate this case. And in such case, the down trend from 137.49 could possibly resume through 118.62.
Sterling Rises After Commons Speaker Rejects Another Brexit Vote
US stocks ended the day higher as traders waited for the Fed decision, which is expected tomorrow. The Dow, S&P 500, and Nasdaq gained by 65, 10 and 25 points respectively. The Fed is expected to leave interest rates unchanged at its meeting, which begins today. It is also expected to reiterate its earlier statement that it will be patient on further rates. This is because of the overall slowdown in the US and global economy and the low rate of inflation. In Asia, stocks dropped ahead of that decision, with Nikkei, Hang Seng, and Shanghai declined by 0.26%, 0.25%, and 0.23% respectively.
The Australian dollar rose slightly against the USD after RBA released its minutes for the meeting held earlier this month. In the meeting, the bank left interest rates unchanged and continued to worry about the slowing global economy and the risks in the housing sector. The country’s real estate prices have been declining in major cities like Sydney and Melbourne. This has affected the home owners, investors, and banks. In fact, data released today showed that the real house prices had declined by 2.4% in the fourth quarter. This was the biggest decline in more than ten years. The statement said:
Taking account of the available information on current economic and financial conditions and how they were expected to evolve, members assessed that the current stance of monetary policy was supporting jobs growth and a gradual lift in inflation. However, members noted that significant uncertainties around the forecasts remained, with scenarios where an increase in the cash rate would be appropriate at some point and other scenarios where a decrease in the cash rate would be appropriate. The probabilities around these scenarios were more evenly balanced than they had been over the preceding year.
The sterling strengthened in the Asian session as complexities surrounding Brexit continued. This is after the parliament’s speaker ruled out another vote on Brexit unless there were significant changes in its wording. This was a blow to Theresa May, who was hoping to table the vote yesterday. Still, the speaker’s decision makes sense because the deal May was to present had already been rejected by the same parliament. In addition, members would not have an incentive to vote for it because they have already voted on extending the exit period if there is no deal.
On economic data, traders will receive the employment numbers from the UK. The unemployment rate is expected to remain at 4.0% while the average wage is expected to rise by 3.2%. This will be lower than the previous 3.4%. The claimant count change is expected to rise by 13.1K, which is lower than the previous 14.2K. In Germany, traders will receive the ZEW economic sentiment, which is expected to decline by -11.0.
EUR/USD
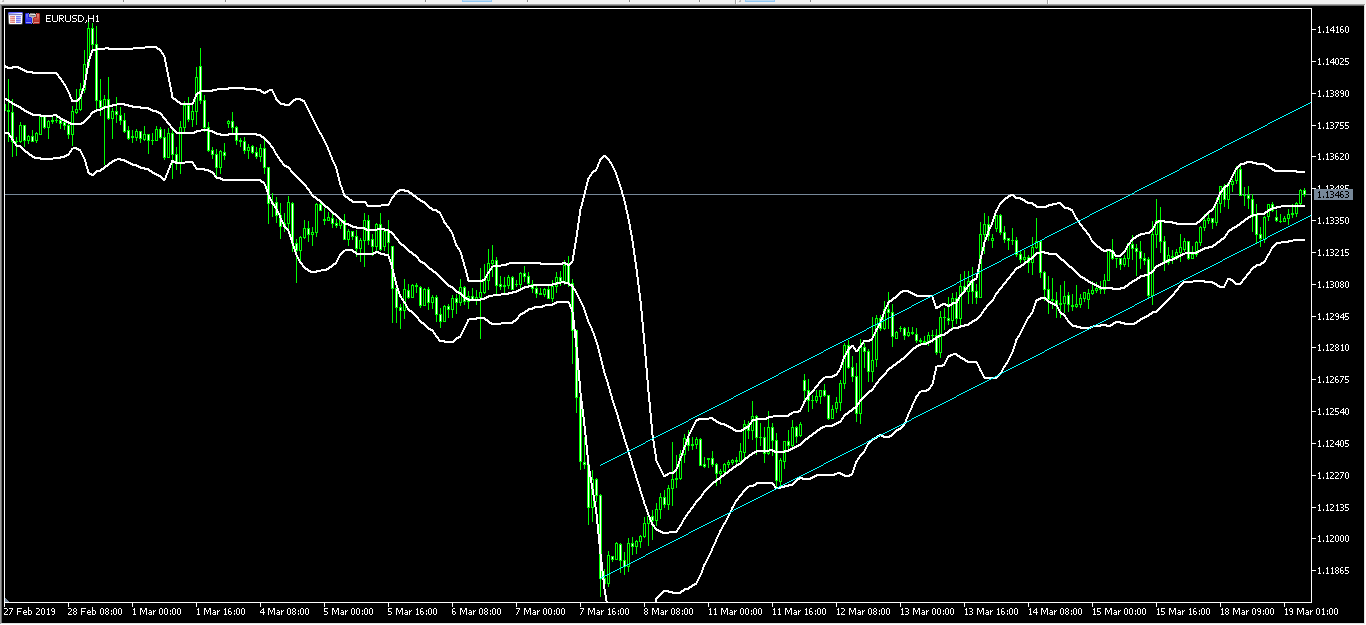
The EUR/USD pair rose during the Asian session as traders waited for the statement from the Fed tomorrow. The pair is trading at 1.1346, which is slightly lower than yesterday’s high of 1.1360. On the hourly chart, the current price is close to the upper line of the Bollinger Bands. The pair is also trading in an upward channel as shown below. There is a likelihood that the pair will continue to move up, with the next target being the yesterday’s high of 1.1360.
GBP/USD
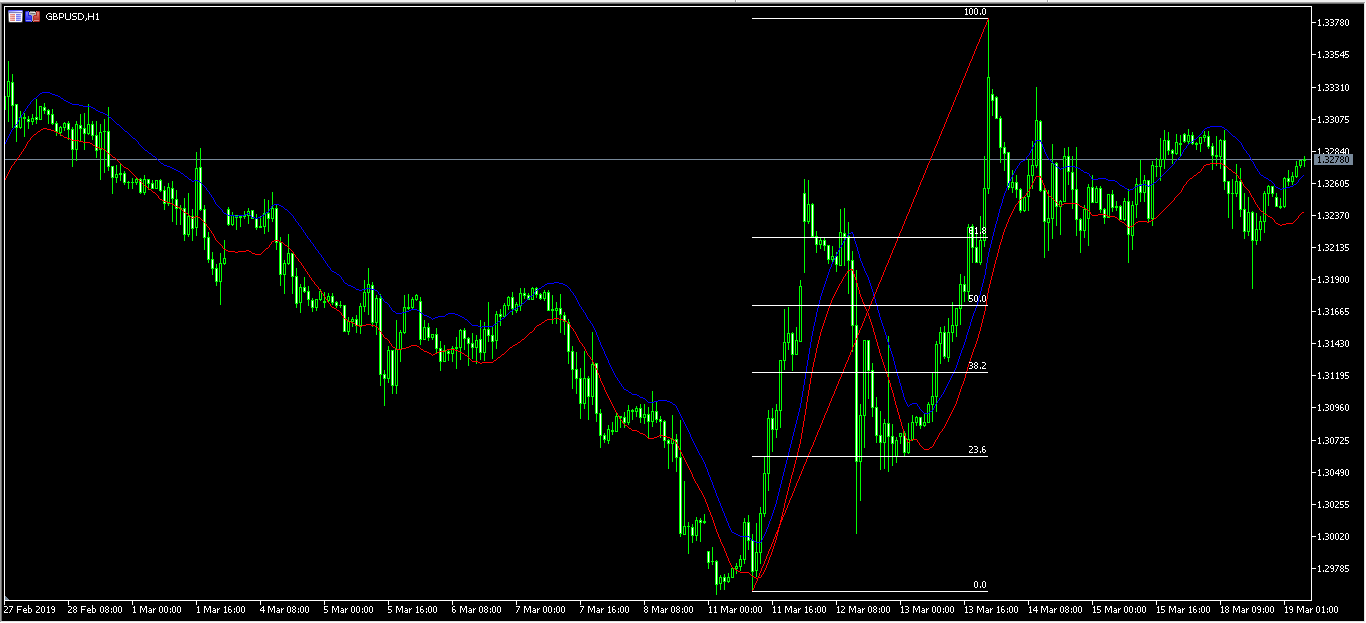
The GBP/USD rose after the speaker rejected Theresa May’s decision to table the Brexit vote again. The pair is now trading at the 1.3277 level, which is much higher than yesterday’s low of 1.3182. This level is between the 100% and 61.8% Fibonacci Retracement level. It is also above the upper line of the Envelopes indicator. The pair could continue moving up, but this will depend on the developments on Brexit. The important level to watch today will be 1.3300.
AUD/USD
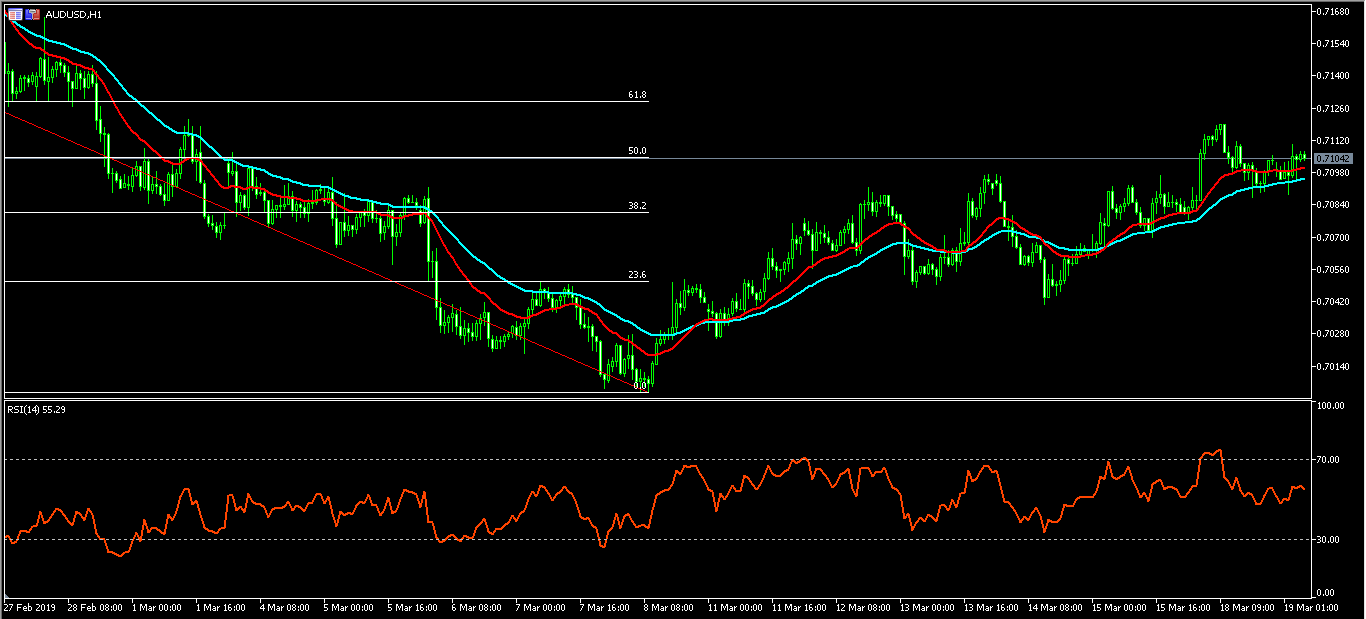
The Australian dollar rose slightly against the USD after the RBA released its minutes. The AUD/USD pair is trading at 0.7104, which is along the 50% Fibonacci Retracement level. It is also slightly above the 21-day and 42-day moving average. The RSI has remained relatively unchanged at the 50 level. The pair could consolidate within these levels until tomorrow when the Fed will release its decision.
GBPUSD Erases Some Losses, Bullish In Near Term
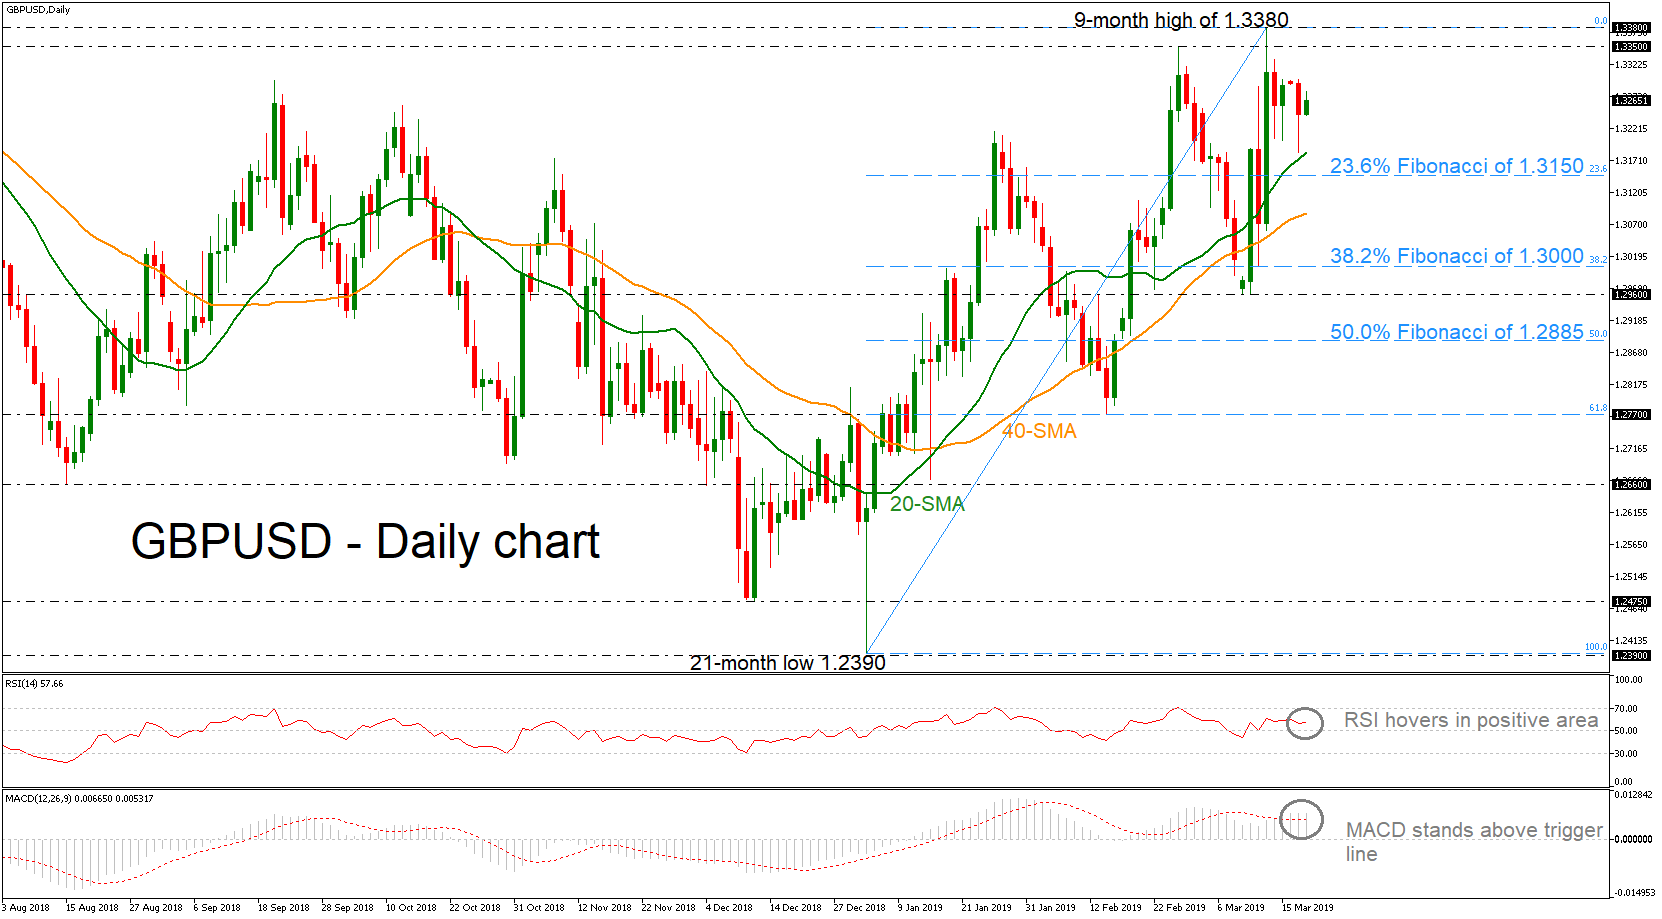
GBPUSD has been moving higher since the rebound on the 21-month low of 1.2390 on January 3, creating a bullish tendency in the daily timeframe. After touching the nine-month high of 1.3380, cable returned lower but is hovering above the 20- and 40-simple moving averages (SMAs). The market could maintain upside momentum as the RSI remains in a positive area and the MACD has jumped above its trigger line in the bullish zone.
An extension to the upside and above the 1.3350 – 1.3380 key area could meet the 1.3475 resistance level, taken from highs on June 7. Another successful upside break could bring 1.3600 into view, identified by the peaks on May 2018.
Otherwise, the pair could slip below the 20-day SMA to challenge the 23.6% Fibonacci retracement level of the upleg from 1.2390 to 1.3380 around 1.3150. Under this line, immediate support would come from the 40-day SMA, currently at 1.3090 before heading towards the 1.3000 psychological level which is the 38.2% Fibonacci.
Summarizing, GBPUSD has been trading in an upside tendency over the last two-and-a-half months, while looking at the long-term picture, the price seems to be neutral, creating a wide trading range within 1.2475 – 1.3380.
EUR/GBP Daily Outlook
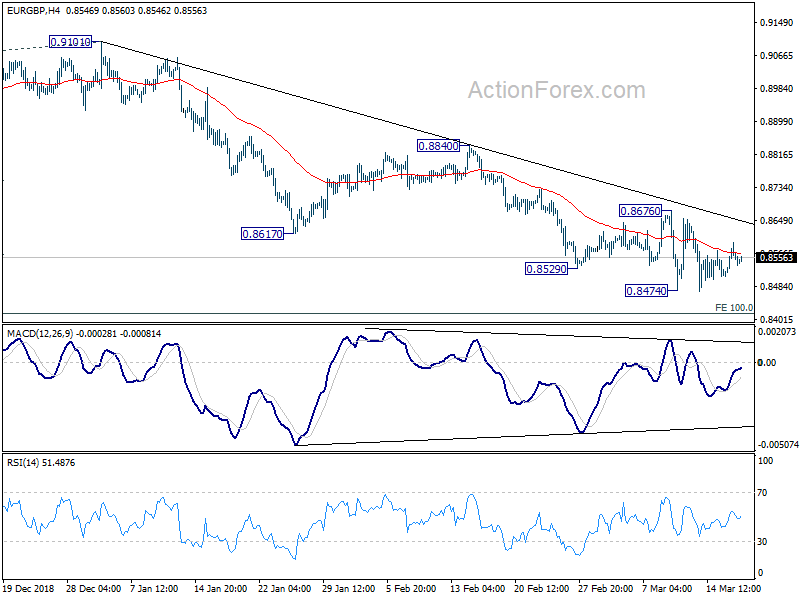
Daily Pivots: (S1) 0.8510; (P) 0.8553; (R1) 0.8595; More...
EUR/GBP is staying in consolidation from 0.8474 and intraday bias remains neutral at this point. With 0.8676 resistance intact, further decline is expected. Firm break of 0.8474 will resume larger down trend to 0.8416 long term projection next. However, on the upside, decisive break of 0.8676 will indicate short term reversal and bring further rise to 0.8840 resistance.
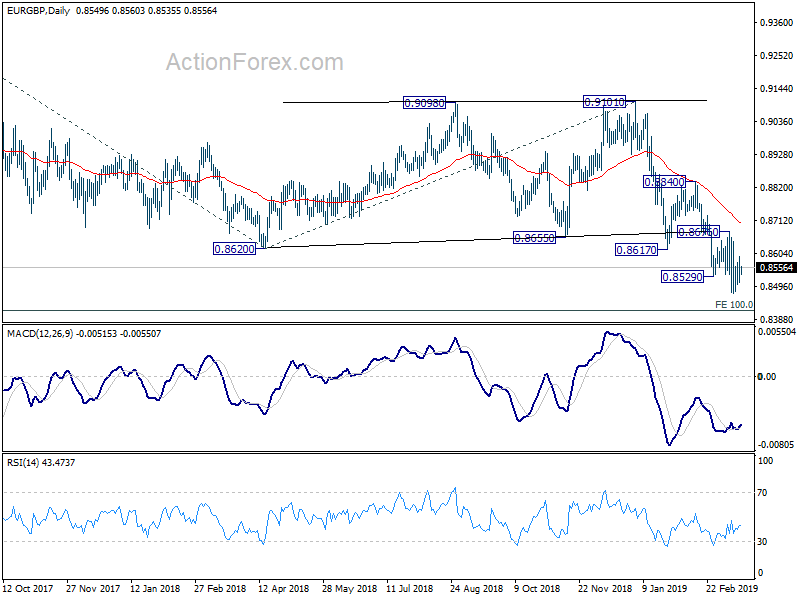
In the bigger picture, EUR/GBP is seen as staying in long term range pattern started at 0.9304 (2016 high). Current fall from 0.9305 (2017 high), is a falling leg inside the pattern. Such decline is now targeting 100% projection of 0.9305 to 0.8620 from 0.9101 at 0.8416 and possibly below. But for now, we'd expect strong support around 0.8312 support to contain downside and bring rebound.
AUDJPY Tops At 2-Week Highs, Key Resistance Remains At 79.80
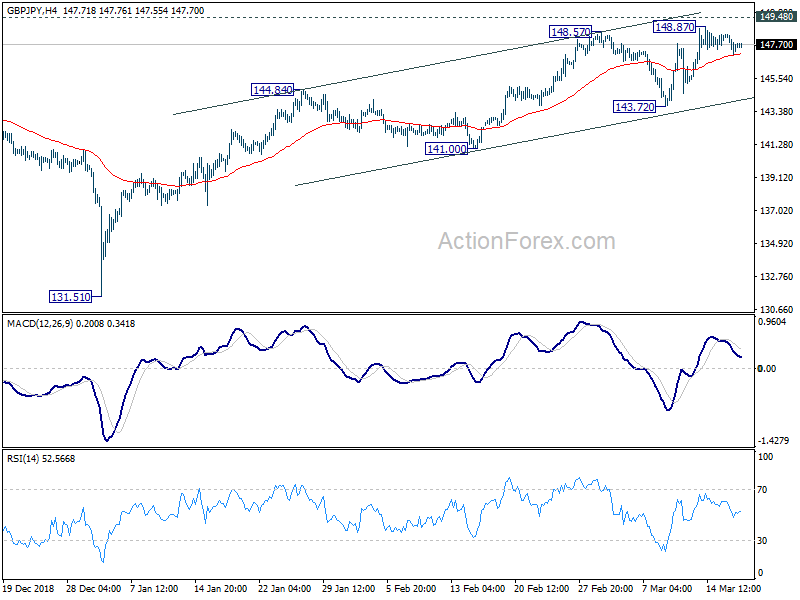
The four-hour AUDJPY established another higher high in the uptrend it started recording on March 8. Trading under the two-month peak of 79.39 now the short-term risk looks neutral to negative as long as the RSI hovers around 50 and the MACD keeps losing strength below its red signal line.
A southward extension below the 61.8% Fibonacci of 78.89 of the downleg from 79.63 to 77.71 would likely target the 200-period moving average currently at 78.80 . Another leg lower and particularly a decisive close below the 50% Fibonacci of 78.67 would invalidate the recent bullish move, probably staging a deeper decline towards the next key support near the 38.2% Fibonacci of 78.44.
Otherwise, the pair could meet the former resistance area around the 78.6% Fibonacci of 79.21 before heading up to the peak of 79.39. Higher, the market could search for a new top within the congested region of 79.55, though, only a significant rally above 79.80 would generate fresh buying interest for the pair. In this case the bulls would also bring the January upward pattern back into play.
In brief, AUDJPY faces a neutral-to bearish bias in the short term, while in the bigger picture the market is in a range between 79.80 and 77.71.